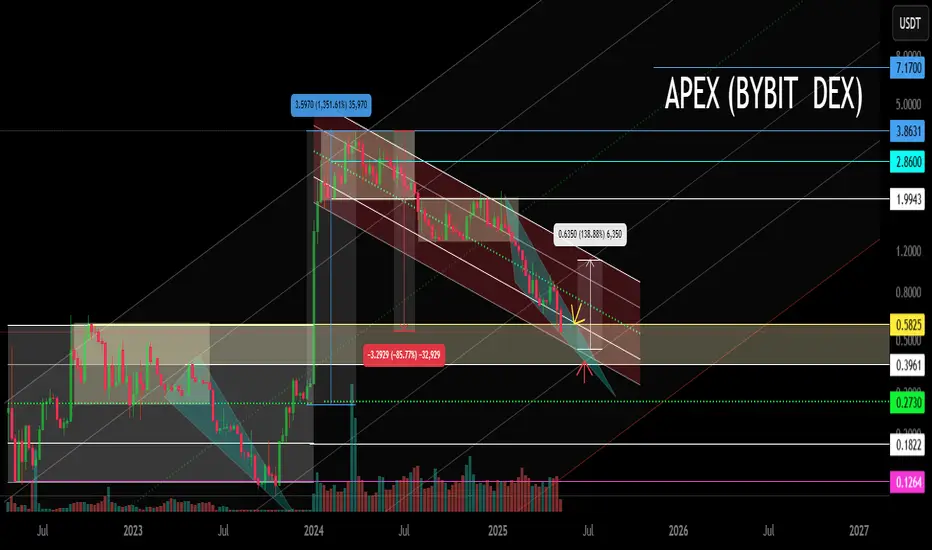
APEX Main trend. DEX exchange Bybit. Hype and super pump 05 2025Logarithm. Time frame 1 week. Correction (descending channel, two distribution zones) after a super pump of about 1500%. All key support and resistance zones were shown, including dynamic ones.
Also showed a local target in percentage in case of exit from a local descending wedge. There is a possibility that the price will enter the mirror support zone of the previous volatility zone of the horizontal channel, or even to the median (green dotted line). Just remember this. When working with the crowd hype, remember the risks.
Pivot Points
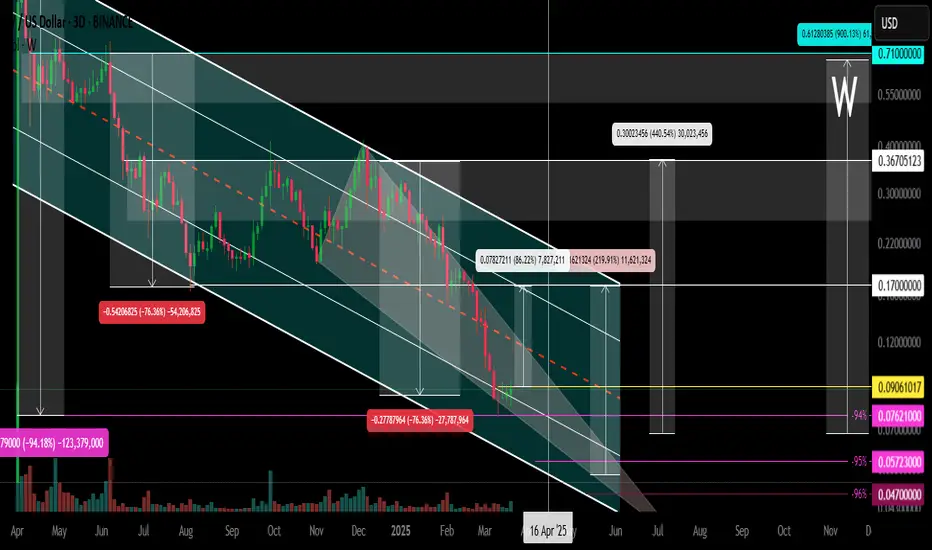
W / USDT Main trend. 23 03 2025Logarithm. Time frame 3 days. Descending channel, price in local clamping in consolidation at dynamic support of the internal channel. From listing -94% at the moment.
Local percentages, medium-term and long-term to key zones of chart logic and liquidity, are shown on the chart as a guide for building your tactics and risk control.
🔴 There is potential for a decline to external support of a large descending channel (optional). I showed this option for building tactics and money management. Such assets in terms of liquidity, as a rule, decrease by 96-98%
🟢 If, from this price clamp, the price goes up , then the first resistance is the dynamic resistance of the internal channel (from which there may be a local reversal). Then the external (similarly). If the trend breaks and exits the descending channel, then strong resistance is the previous consolidation of 0.24-0.36
Locally, this clamping zone looks like this.
GBP/JPY for Bearish as Pull-backwait for pull-back near by entry point and then go short
general trend is up trend
current phase is pull-back
have fun :)

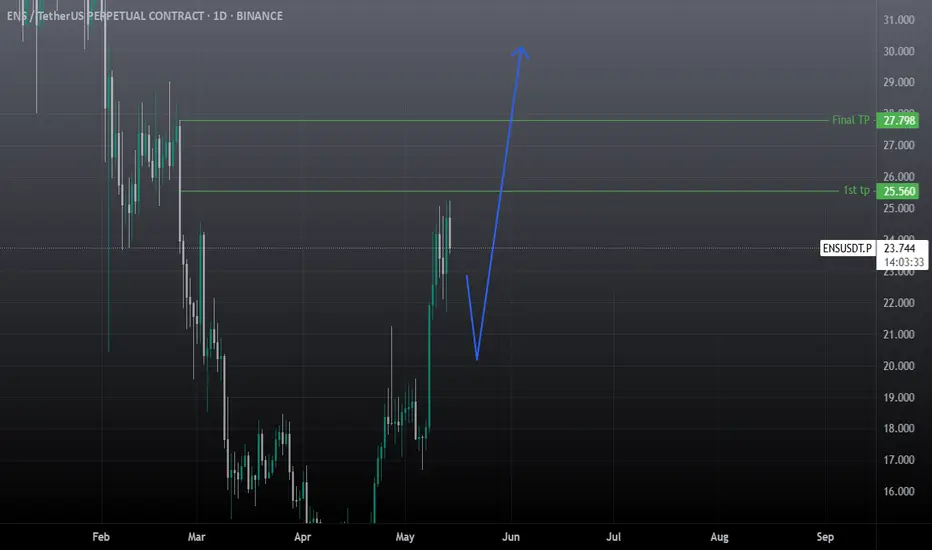
ENS SWING Trade SetupENS Showing strong momentum towards upside and dropped without touching POI, So it can go higher first then it may take correction, spot and future trader can take risk on this. Wait for the entries and enter from 20-19 level, if price reverse from any other point, then wait for the 4hrs candle closing above 26 and target the 30-32$ level. for scalp and day trading get long from 22.40 SL 21.65 and set tp 25.56 & 27.79$.
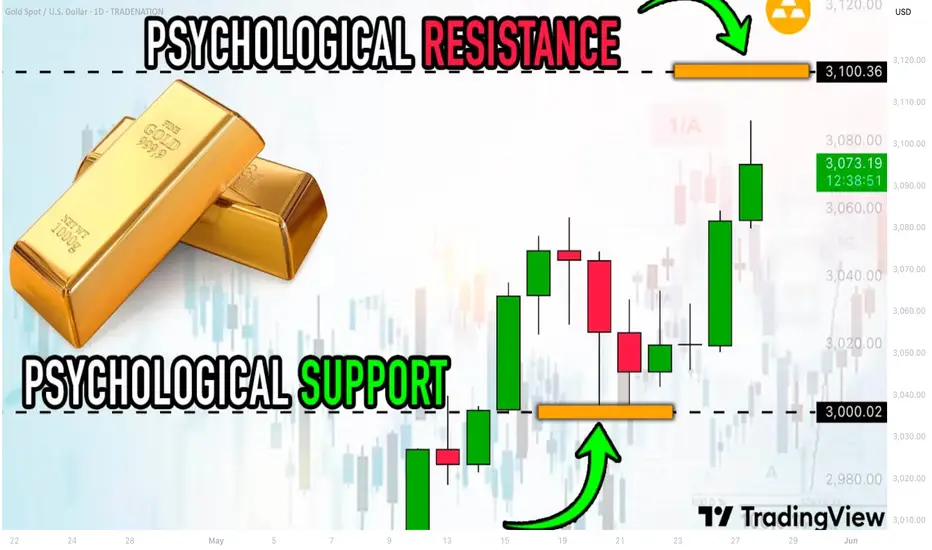
Best GOLD XAUUSD Psychological Levels Indicator on TradingView
There is one free technical indicator that will show you every significant psychological level on Gold XAUUSD chart.
It is available on TradingView and it is very easy to set.
Discover the best psychological support and resistance indicator for Gold trading , its settings and useful tips.
First, let's discuss the significance of psychological levels in GOLD XAUUSD analysis and trading.
The classic way of the search of significant supports and resistance is based on the analysis of a historic price action.
However, while Gold constantly sets new historic highs such a method does not work, because there are no historic resistances to rely on.
In such a situation, the only reliable strategy to find potentially strong resistances is to analyze psychological levels.
Psychological levels are the round numbers based price levels. Because of the common human psychological biases, these levels attract the interest of the market participants and the prices tend to react to them.
A great example of a psychological level in Gold trading is 3000 level.
It served as a resistance first and after a breakout turned into an important support.
And I found a free technical indicator that plots all the significant psychological levels efficiently.
One more thing to note is that I strictly recommend searching for psychological levels on a daily time frame, because it provides the most relevant perspective.
To use this indicator, search "round" in indicators wind ow.
It is called "Round numbers above and below".
Click on that and it will start working immediately.
You can see that the indicator plotted 3 significant psychological resistances above current prices and 3 supports below on Gold chat.
In the settings of the indicator, you can change the number of levels to identify and change the style of the horizontal lines.
Examine the reaction of the price to psychological supports that the indicator shows. These levels may remain significant in futures and applied for pullback/breakout trading.
With a crazy bullish rally that we contemplate on Gold this year, psychological levels will be the most reliable technical analysis tools for the identification of future bearish reversals and corrections.
This free technical indicator on TradingView will help you in search of the strongest ones.
❤️Please, support my work with like, thank you!❤️
I am part of Trade Nation's Influencer program and receive a monthly fee for using their TradingView charts in my analysis.
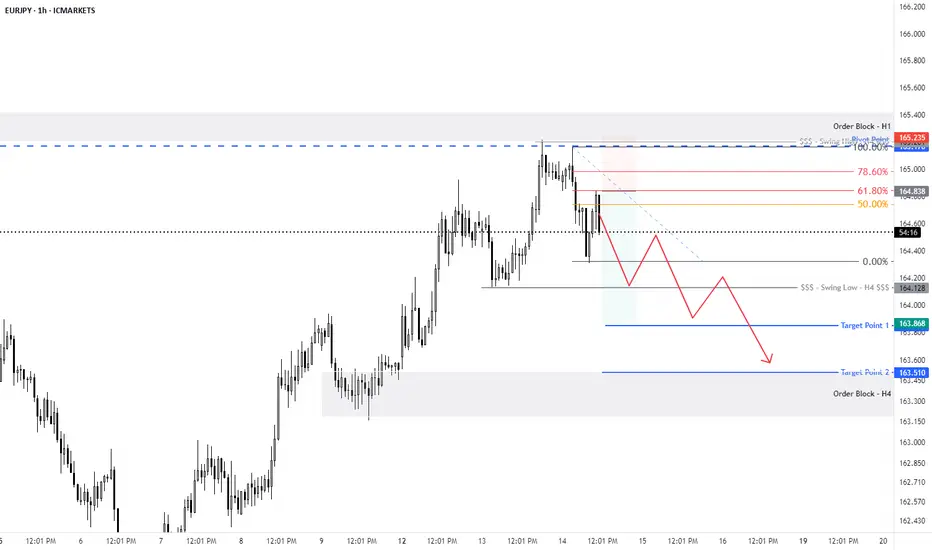
EUR/JPY For Bearish as pull-backyou can go short now
general trend is up trend
current phase is pull-back
have fun :)
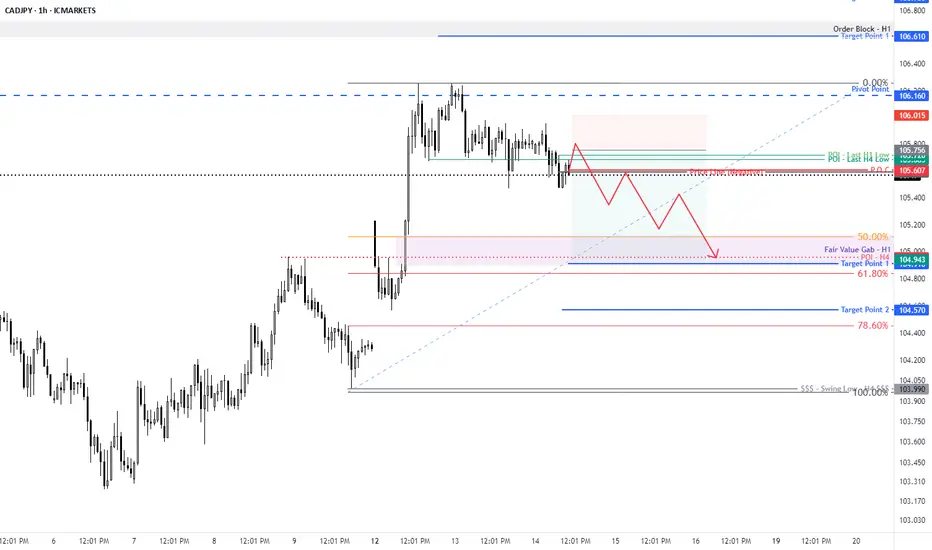
CAD/JPY For Bearish as pull-backyou can go short now
or
wait for pull-back near by entry point and then go short
general trend is up trend
current phase is pull-back
have fun :)
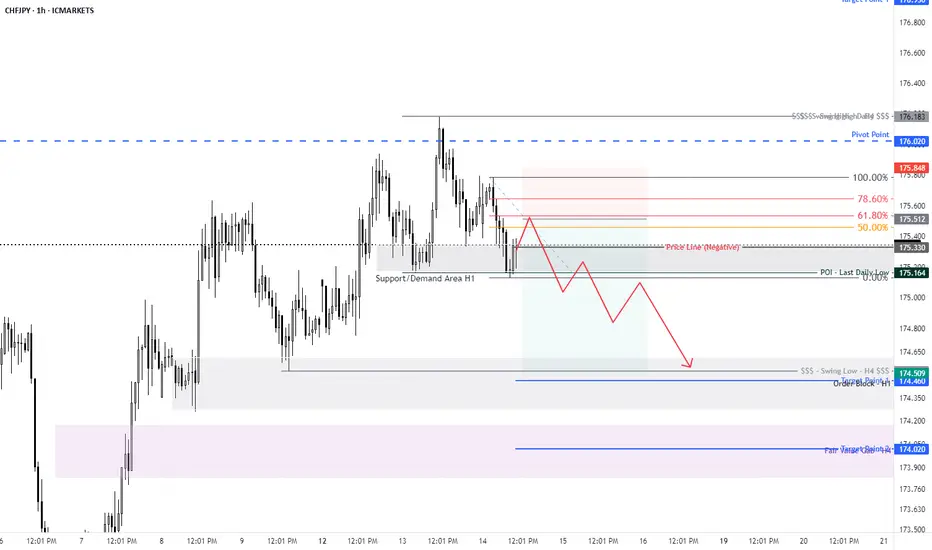
CHF/JPY For Bearish as pull-backyou can go short now
or
wait for pull-back near by entry point and then go short
general trend is up trend
current phase is pull-back
CHF under pressure
your confirmation will be break current support area (green arrow) and back to retest it and then fall down to targets
have fun :)
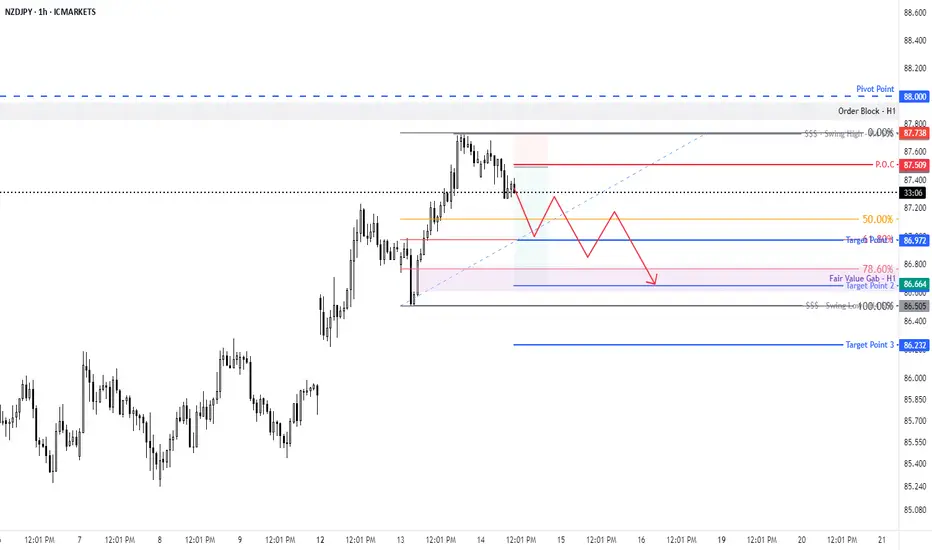
NZD/JPY For Bearish as pull-backyou can go short now
or
wait for entry point and go short
general trend is up trend
current phase is pull-back
NZD under Pressure
have fun :)
SWARMS Is Bulish (12H)A key flip zone on the SWARMS chart has been reclaimed.
The trigger line has been broken, and we have a bullish CH (Change of Character) on the chart.
As long as the flip zone holds, price may move toward the identified targets.
A daily candle close below the invalidation level would invalidate this analysis
Do not enter the position without capital management and stop setting
Comment if you have any questions
thank you

Pairing between BTC & Global Liquidity IndexSup everyone,
if you're active on twitter or have been looking around for crypto trade ideas you might have stumbled upon the Global Liquidity Index chart (at least I have).
I've stumbled upon it a few months back and have been testing it ever since, let me tell you what this chart is about:
The Global Liquidity Index basically measures how much money is flowing through global markets—think of it like the pulse of the financial system... traders and investors use it to get a sense of overall market conditions, liquidity availability, and risk appetite.
Now, here’s the cool thing: when you layer the Global Liquidity Index onto the Bitcoin chart, you notice something interesting— BITSTAMP:BTCUSD tends to react, but with a delay. Typically, there's about a 2-3 month lag. If global liquidity spikes or makes a sharp V-shaped recovery, Bitcoin usually mirrors this movement roughly 80 days later.
Why does this happen? Well, Bitcoin is a highly speculative asset, and institutions—especially banks—often wait to see solid liquidity signals before moving their capital into riskier assets like crypto. They prefer confirmation over speculation, which explains the delay.
So, in simple terms, by tracking global liquidity, you get a pretty useful heads-up about where Bitcoin might be headed a couple of months down the road.
The Global Liquidity Index is essentially a snapshot showing how much money central banks and financial institutions are injecting or pulling out of the global economy. Think of it like a big gauge tracking how "easy" or "tight" money conditions are worldwide.
It usually takes into account factors like:
Central Bank Policies: How much money central banks are printing or how they're changing interest rates.
Bank Reserves and Credit Availability: The amount banks can lend out, influencing how easily money flows through markets.
Government Spending and Stimulus: Fiscal policies injecting liquidity directly into the economy.
International Capital Flows: Money moving across borders, affecting global market liquidity.
When liquidity is abundant, there's more money sloshing around looking for places to invest. That typically pushes up asset prices—including speculative ones like Bitcoin—as investors seek higher returns. Conversely, when liquidity tightens (like when central banks raise interest rates or pull back stimulus), money becomes scarcer, risk appetite shrinks, and assets tend to dip.
So, when you're watching the Global Liquidity Index, you're basically monitoring how central banks and institutions are influencing market sentiment and investment behaviors, which eventually impacts speculative assets like Bitcoin—but with that notable delay we talked about earlier.
Practically speaking, here's how you apply the Global Liquidity Index to Bitcoin:
You watch for major turning points—peaks, bottoms, or sharp reversals—in global liquidity. Once you spot one, mark your calendar about 2–3 months forward (around 80 days). That’s usually when Bitcoin mirrors that move.
So, for instance, if the Global Liquidity Index sharply rebounds upward (a V-shaped recovery), you'd expect BTC to follow with a rally roughly two to three months later. On the flip side, if liquidity peaks and starts declining, it's a heads-up that Bitcoin could face downward pressure within the next few months.
This gives you a practical edge—you're essentially previewing BTC’s possible moves.
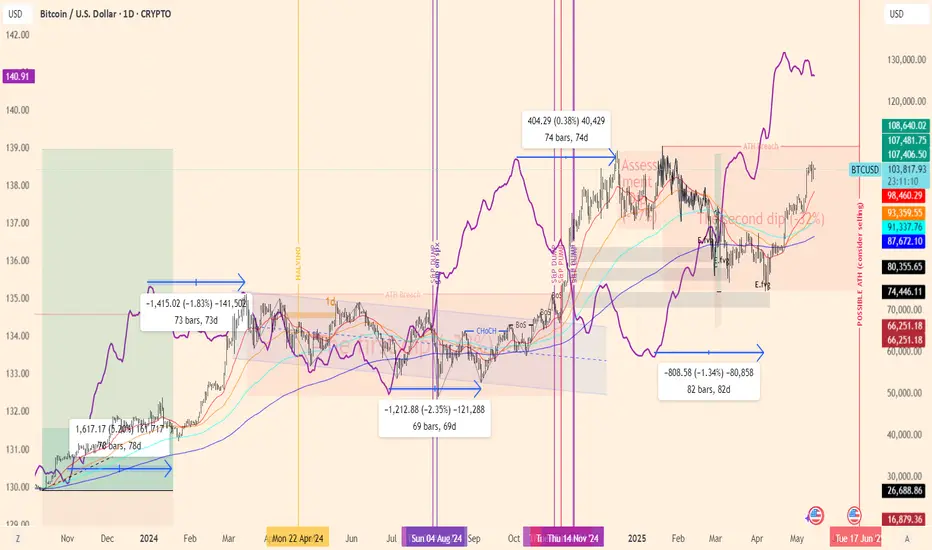
All things said, if you look at BTC's chart right now and apply the Global Liquidity Index to it you can see how the second has broken its previous high a few months back, but BTC yet has to break its, you can arrive to the conclusions here....
With no reversal in sight (for now) in the Global Liquidity Index, there don't seem to be signs of "spoofing", no case in which the index starts declining and so makes traders who know about this delay start to sell earlier than the delay.
End of the story - things look promising for BTC and you should definitely keep the Global Liquidity Index in your list of indicators.
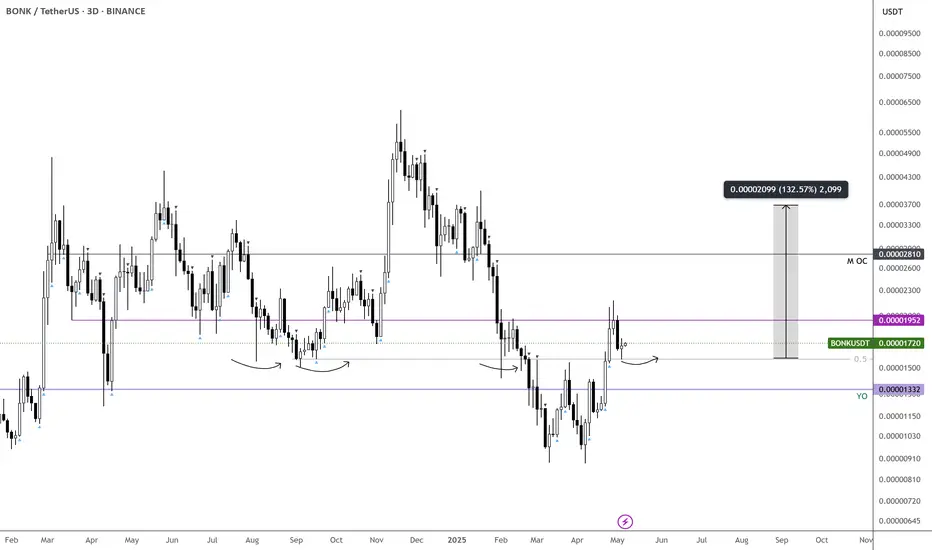
BONK looks ready to pivot—clear skies aheadLiking the price action so far. It’s flipped above the mid-level, which aligns with key pivots across multiple timeframes.
Ideally looking for a week of consolidation here before the next major move.
Entry around 0.0000158
Targeting 0.000028 if things unfold as expected
SEED_DONKEYDAN_MARKET_CAP:BONK BINANCE:BONKUSDT
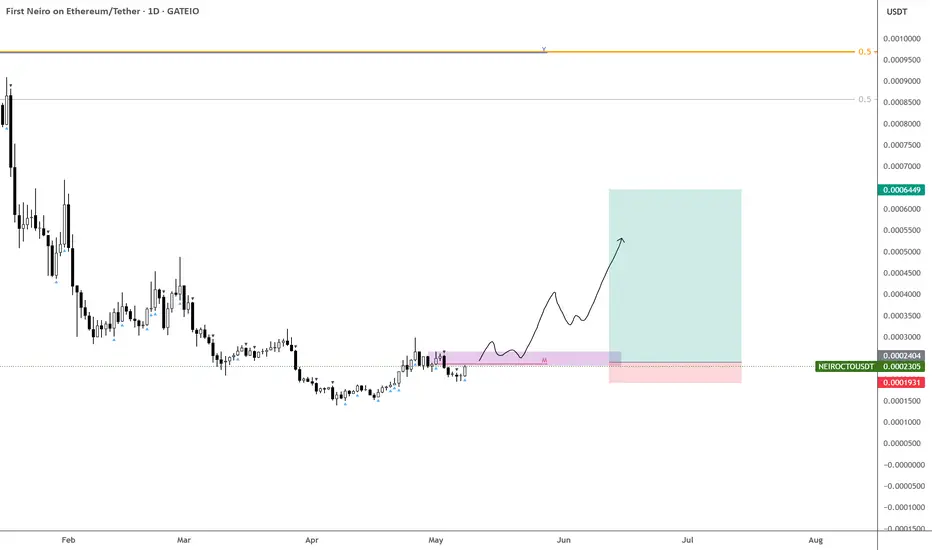
NEIRO on Reversal Watch – Waiting for ConfirmationBought a bit here, but the main trigger is above the Monthly Open and the block it's currently sitting on.
Structure still leans bearish on the daily and higher timeframes, so I'd prefer a strong S/R flip at a key level rather than blindly expecting a market structure shift.
With ETH holding well and sitting near its previous ATL vs BTC, this could open the door for NEIRO and similar names to perform. Just look at how EURONEXT:AAVE , CRYPTOCAP_OLD:ETHFI , MIL:ENA , and $EIGEN are moving today.
XAUUSD | UNPRESIDENTED GOLD RALLY : Where to Next?GOLD has been trading extremely bullish over the past year, with high volume indicating lots of interest and movement in this commodity's market:
Is this where we should be getting worried?
Rapid surges in gold prices have historically been followed by sharp corrections as markets adjust. Three key examples illustrate this;
🧨 the 1980 spike to $850 due to global instability, followed by a 65% drop;
🧨 the 2011 peak near $1,900 driven by economic anxieties, leading to a 40% decline by 2015;
🧨and the 2020 high above $2,075 amid pandemic fears and stimulus, which subsequently settled into a lower range.
Noticing how gold has been trading in a parabolic curve, first corrections are likely to be down the curve (as it has been, historically):
Across past gold peaks ( 1980, 2011, and 2020) and recent record highs, markets share four core similarities:
🎈elevated inflationary expectations,
🎈low or negative real interest‐rate environments,
🎈heightened geopolitical and trade‐war tensions,
🎈aggressive central‐bank and ETF buying.
Today’s gold rally mirrors these patterns, driven by persistent inflation concerns and renewed safe‑haven demand amid Middle East conflicts and Ukraine risk. Aggressive central‑bank and ETF purchases have also replicated past behavior. Emerging‑market central banks have accelerated gold reserves diversification since 2022, just as they did after the 2008 crisis and the Euro‑debt peak in 2011.
Historically, swift peaks have been followed by multi‑year corrections as external conditions normalize. After January 1980’s peak, gold fell by two‑thirds over two years; following 2011’s high, it dropped 40% by 2013. If inflation cools or central banks signal genuine rate normalization, this rally may likewise give way to a sustained consolidation or correction.
Did the BBC just signal the peak??
Recently the BBC warned that while current trade‑war and market volatility parallels past booms, overreliance on gold alone risks miss-timing the eventual downturn when macro fears realize.
Therefore, if the curve breaks, it's likely the beginning of the hard correction.
__________________________
OANDA:XAUUSD

U.S. Bulls Take Charge: S&P 500 Set to Break OutHello,
📊 S&P 500 Market Outlook – Pro-Bullish Perspective
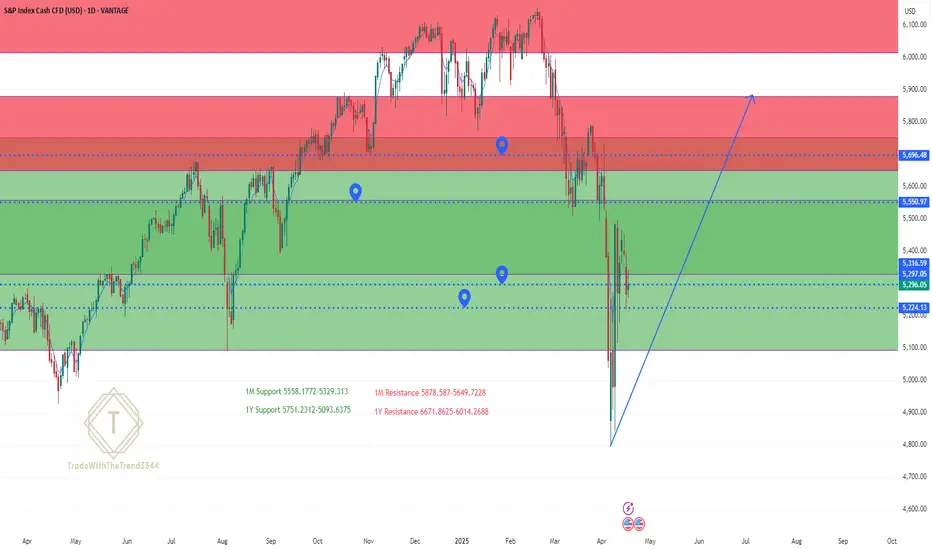
🔥 Market Recap: The S&P 500 recently saw a significant dip, marking a 1-year low at 4805.92, largely attributed to the shockwaves caused by President Trump’s sweeping tariff announcement on April 2. This move sent markets into a tailspin, creating heightened volatility levels not seen since the early pandemic days.
However, savvy traders recognized opportunity amidst the panic and entered strategic buy zones around those lows. Since then, the index has managed to stabilize above key technical levels, signaling potential bullish momentum building from the ground up.
🧭 Current Key Technical Levels to Watch:
1W Pivot Point (PP): ✅ Holding above 5224.13
1D Pivot Point (PP): ⚠️ Testing resistance at 5297.05
1M Strong Support/Resistance: ⛔ Acting as resistance at 5329.31
🚀 Bullish Confirmation Pathway:
To fully confirm a bottom-up bullish reversal, we’re looking for:
✅ Sustained close above the 1D PP @ 5297.05
✅ Break and hold above the 1M Resistance @ 5329.31
✅ Momentum toward the 1Y PP @ 5550.97
If these levels are conquered with conviction, it opens the door for an extended upside move toward 5878.58, aligning with a broader bullish sentiment.
🛑 Cautionary Downside Scenario:
Although currently less likely, a failure to maintain support above the 1W PP @ 5224.13 could reopen downside risk in the short term. We remain watchful of that level as a bull-bear pivot.
🌐 Macro Overview – Tariff Shock & Earnings Spotlight:
Trump’s abrupt tariff move has reshuffled the global economic deck, and investors are still processing its implications.
The S&P 500 is currently down ~14% from its February highs, but showing resilience.
Earnings season is now center stage, with major players like Tesla, Alphabet, IBM, and Boeing under the microscope.
⚠️ Volatility Index (VIX) is down from post-tariff highs (~60) to ~30, still elevated from the long-term median of 17.6, signaling cautious optimism.
💬 CEO Sentiment Matters:
As JJ Kinahan from IG North America noted:
“The view of CEOs going forward has never been more important.”
With traditional guidance uncertain, investors are leaning on transparent, scenario-based outlooks like United Airlines’ “dual roadmap” approach.
🔋 Magnificent Seven on Watch:
Alphabet: -20% YTD
Tesla: -40% YTD
These leaders are key sentiment barometers. If they bounce, the broader market is likely to follow.
🏛️ Fed & Trump Tensions:
Trump recently stated that Fed Chair Jerome Powell’s termination “cannot come fast enough,” pushing for rate cuts.
Powell, however, remains cautious, citing the need for more economic data before acting.
✍️ Final Note – A Cooling Tariff War?
💬 According to Trump’s latest statement, the tone around tariffs is beginning to cool, hinting at possible de-escalation.
This development adds further bullish tailwinds to the broader market outlook.
✅ Summary:
We are leaning bullish here with the base-building process in motion. Key levels are aligning, volatility is easing, and clarity from corporate earnings could be the catalyst to propel markets upward.
Watch for a clean breakout above 5329 — that’s where the real confirmation begins. Eyes on the prize: 5878.58 👀📈
The Support and Resistance outlined in green and red are the respective support/resistance for this pair currently for 1M-1Y timeframes!
No Nonsense. Just Really Good Market Insights. Leave a Boost
TradeWithTheTrend3344
Bitcoin (BTC/USDT) Technical Analysis – May 13, 2025 | 17:30 UTC🔍 Market Context
Bitcoin continues to exhibit structural bullish behavior, supported by macro-level demand and reduced circulating supply. However, recent momentum indicators signal a possible short-term exhaustion.
📊 Technical Overview (4H Chart)
🔧 Chart Parameters
Timeframe: 4H
Tools Used: Fibonacci Retracement, Volume Profile, Ichimoku Cloud, Pivot Points, RSI, MACD
🔹 Fibonacci Levels
(May 12 Low $101,206 → May 13 High $103,267)
0.236: $102,845
0.382: $102,420
0.5: $102,236
0.618: $102,052
🔹 Pivot Points (Classic)
S3: $101,580
S2: $102,110
S1: $102,650
Pivot: $103,010
R1: $103,550
R2: $103,990
R3: $104,420
🔹 Volume Profile
Weak participation above $103,000, indicating potential resistance and lack of buyer commitment at higher levels.
🔹 Ichimoku Cloud
Price remains above the cloud, maintaining a bullish bias.
Tenkan/Kijun convergence signals possible consolidation in the short term.
📈 Key Price Zones
Support to Watch:
$102,052 (0.618 Fib) – Critical level for bull structure to hold.
$101,206 – Previous swing low; breakdown may trigger broader correction.
Resistance to Watch:
$103,550 (R1) – Major breakout point.
$105,819 – All-time high, if momentum accelerates.
Order Flow: Block buying activity detected between $101,500–$102,000 (potential accumulation)
📉 Summary
Bitcoin is range-bound between $102,000–$103,500 ahead of key macro events.
Breakout Confirmation: Above $103,550 → Targets $105K+
Breakdown Signal: Below $102,000 → Opens path to retest $101,206
⚠️ Always use proper risk management. Backtest every scenario. No guarantees in live markets.

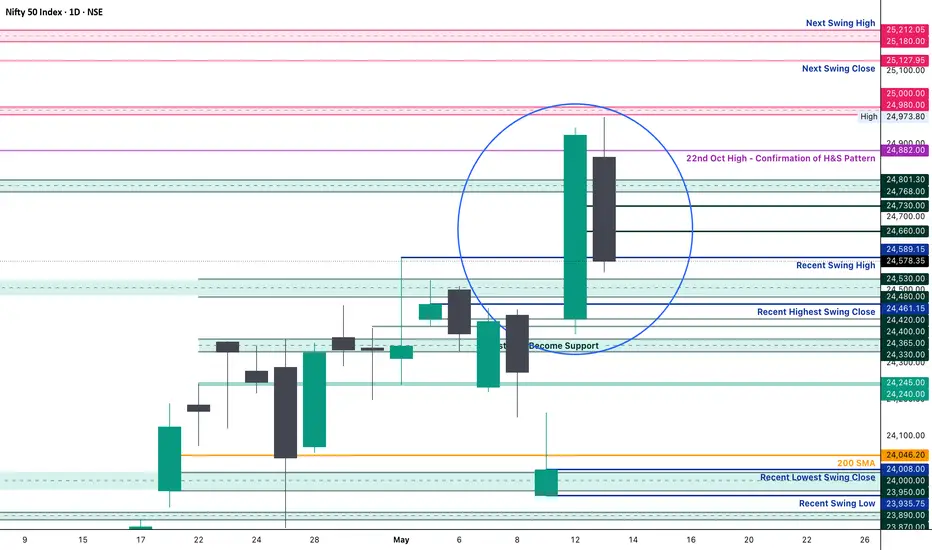
Nifty Analysis EOD - May 13, 2025 - Tuesday🟢 Nifty Analysis EOD - May 13, 2025 - Tuesday 🔴
Is it Retracement or Breakout Failed?
🔍 Nifty Summary
Nifty opened with a mild gap-down of 35 points and within the first 20 minutes, it sliced through multiple supports — Previous Day Close, 24,882, 24,801–24,768, and even 24,730 — in what looked like a determined breakdown. However, the follow-up was missing. Instead of extending lower, the index hovered indecisively near the CPR until 12:30 PM.
Post-lunch, a breakout attempt did arrive — but momentum was lukewarm. Both sides saw significant premium erosion, making it a tough day for option buyers.
Despite the early pressure, Nifty closed at 24,578 (-57 pts) — a mild negative close, but interestingly near multiple fib supports and recent swing zones, hinting at absorption.
🕵️ Intraday Walk
🔽 Broke PDC → 24,882 → 24,801–24,768 → 24,730 within 20 minutes.
🌀 Stuck inside CPR zone until 12:30 PM – volatility without trend.
📈 Breakout attempt post-lunch lacked strength.
💸 Both calls and puts decayed heavily – option writers ruled.
🧭 75-Min Chart Analysis / Zone Commentary
Market flirted with imbalance in the morning, but later balanced out, forming a neutral structure.
The rejection of deeper downside and close near key fibs point to a pause more than a trend.
🔍 Key Observations:
✅ Closed near recent swing high at 24,589
✅ Near 0.382 Fib retracement from the previous close (24,587)
✅ Near 0.618 Fib from the prior session (24,595)
❌ No follow-through after support breaks
❌ Momentum faded quickly after the breakout attempt
📌 Implication:
The market shows signs of absorption near support zones but lacks strength for a reversal — neutral to slightly bullish bias, but still cautious.
🛡 Gladiator Strategy Update
Strategy Parameters
ATR: 362.82
IB Range: 298.2 → 📏 Large IB
Market Structure: ⚖️ Balanced
Trade Highlights
📈 Long Trigger @ 12:40 PM
🎯 Target 1:1 Achieved
💼 Total Trades: 1
🔢 Support & Resistance Levels
🟩 Resistance Zones:
24,660
24,730
24,768 ~ 24,800
24,882
24,980 ~ 25,000
25,100 ~ 25,128
25,180 ~ 25,212
🟥 Support Zones:
24,882
24,800 ~ 24,768
24,730
24,660
24,590
24,530 ~ 24,480
24,461
24,420 ~ 24,400
24,365 ~ 24,330
24,245 ~ 24,240
🔮 What’s Next?
Today’s session looked like a failed to sustain above 24800 and lack of retracement. close around the fib level, raises a question about whether is it breakout failure or just retracement ?
In short: no clarity.
📌 If Nifty holds above 24,530–24,480, it may attract buying towards 24,730–24,800 again.
📉 But a sustained break below 24,480 could invite a retest of 24,365 ~ 24,330 zone.
➡️ For now, traders should stay nimble and option buyers cautious.
💬 Final Thoughts
“Confusion is a part of clarity. Let the market reveal itself — reacting is better than predicting.”
✏️ Disclaimer
This is just my personal viewpoint. Always consult your financial advisor before taking any action.
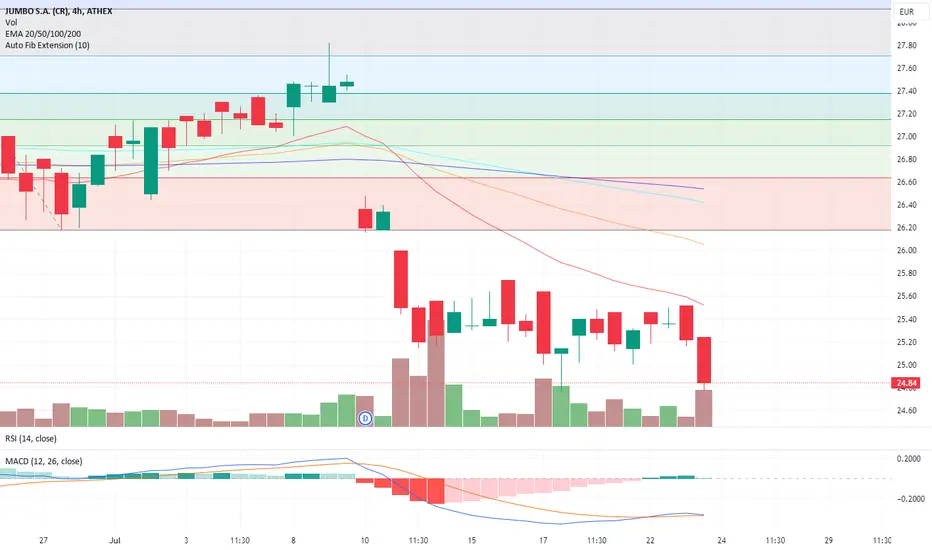
JUMBO (BELA) Comprehensive AnalysisThe JUMBO stock recorded a significant drop of 1.90% yesterday, closing at 24.72 euros, which is the lowest level in the last six months . The dividend cut has affected the stock price, but forecasts from major analysts indicate significant upside potential.
Last Closing Price: 24.72 euros
52-Week High/Low: 32.60 euros / 24.72 euros
Economic Analysis
Jumbo maintains a high dividend policy for 2024 despite market challenges. The company distributes 3% of its shares, with Apostolos Vakakis reducing his stake to 16.3%. The high dividend yield, combined with the expansion of the store network, enhances the attractiveness of the stock.
Expected Dividend Yield: 9.1%
2024 Revenue Growth Estimate: 4%-8%
Expected 2024 Earnings: Stable or slightly increased
Lowering Revenue and Profit Targets – Warning of Possible Revision
Jumbo informed investors that group sales increased by approximately 8% in the first half of the year, with a +9% increase recorded in June compared to the same month last year. Nevertheless, the company sets the bar for revenue and profit growth for the year at the lower end of the initial estimate of 8%-10%.
Jumbo warns that if current conditions worsen, which is reasonably expected, the sales growth rate could be limited to +4% with profitability hovering at 2023 levels.
Factors Affecting the Estimate
Commenting on the business environment, the company mentions that the situation in the Middle East, with the "closure" of the Suez Canal, although initially temporary, will continue to affect the global supply chain likely even after the elections in America. The current global trade situation resembles the pandemic crisis, with transportation costs skyrocketing and delivery times doubling.
Jumbo refuses to pass the burden of supply chain disruptions onto consumer prices. The company's strategy remains clear: it does not intend to offer overpriced products, as it estimates that the situation will reverse by the end of 2024 or 2025.
Jumbo's Strategy
Jumbo chooses products that meet the needs and capabilities of consumers. Faced with the dilemma of a product that includes the cost of disruptions and another with manageable costs, the company chooses the latter. This strategy is expected to lead to an increase in Jumbo's market share in the markets it operates, despite the expected reduction in inventory by the end of the year.
First Half 2024 Performance
Group sales increased by approximately +8% in the first half of 2024. In June 2024, sales recorded an increase of +9% compared to the same month last year.
Detailed sales performance by country:
Greece: Net sales increase of +6% in June 2024 and +7% for the first half.
Cyprus: Sales increase of +6% in June 2024 and +4% for the first half.
Bulgaria: Sales increase of +19% in June 2024 and +11% for the first half.
Romania: Sales increase of +17% in June 2024 and +14% for the first half.
Store Network Expansion
As of June 30, 2024, the JUMBO Group had 86 stores: 53 in Greece, 5 in Cyprus, 10 in Bulgaria, and 18 in Romania, with online stores in Greece, Cyprus, and Romania. By the end of 2024, two new superstores are expected to open in Nicosia and Bucharest. The opening of the new superstore in Timisoara is postponed to the first quarter of 2025.
Through partnerships, the group has a presence with 36 stores in 7 countries: Albania, Kosovo, Serbia, North Macedonia, Bosnia, Montenegro, and Israel. A second store in Israel is expected to start operating in August 2024.
It is reminded that on July 16, 2024, the dividend from the 2023 earnings, amounting to 1 Euro per share (gross), will be paid.
Citi and Pantelakis Securities See Over 20% Upside Potential for the Stock
Citi and Pantelakis Securities predict more than 20% upside potential for Jumbo stock, despite the recent downgrade of the guidance from the company's management for the 2024 results.
Citi Estimates
Citi maintains the target price at €32.5, with an estimated upside of 23.9% from current levels. Combined with the dividend yield expected to reach 9.1%, the total return is estimated to reach 33%. The investment bank issues a buy recommendation for the stock.
The target price of €32.5 derives from the average valuation based on the EV/EBITDA multiple, estimating that Jumbo will trade at 9 times the EV/EBITDA ratio for 2025 with a slight premium compared to the 5-year average, and from the discounted cash flow method. The target price implies approximately 14 times the P/E ratio for 2024, according to Citi.
Pantelakis Securities Estimates
Pantelakis Securities sets the target price at €36, with an estimated upside of 37%. They give an overweight recommendation and highlight that Jumbo is attractively priced at 10.1 times the P/E ratio for 2025 and 6.8 times the EV/EBITDA ratio.
Pantelakis Securities calculates that the market at current levels discounts a long-term drop in the EBITDA margin to 17.8% from 36.8% in 2023, which is not justified. Furthermore, they mention that the strong cash flow performance in 2025 at 8% and the generous and sustainable dividend payments (6.9%) further enhance Jumbo's valuation attractiveness.
Conclusion
Despite the downgrade of the guidance from Jumbo's management for the 2024 results, both Citi and Pantelakis Securities see significant upside potential for the company's stock. Their forecasts are based on stable valuations and estimates for strong cash flows and sustainable dividend yields, making Jumbo stock an attractive choice for investors.
Detailed Report
Jumbo, one of the leading retailers in Greece, operates in the sale of toys, baby products, gift items, household goods, stationery, seasonal and decorative items, books, and related products in Greece, Cyprus, Bulgaria, and Romania. This analysis focuses on the financial data and technical indicators of Jumbo S.A.'s stock, providing a comprehensive overview for investors and analysts.
Technical Analysis
Open: €25.24
High: €25.24
Low: €24.72
Close: €24.72
Moving Averages (EMA):
EMA 20: €25.52
EMA 50: €26.05
EMA 100: €26.42
EMA 200: €26.54
Jumbo's stock price is below all major moving averages, indicating a downward trend in the short, medium, and long-term horizons.
Relative Strength Index (RSI):
RSI (14): 31.23, indicating that the stock is in the oversold zone.
MACD:
Histogram: 0.0070
MACD: -0.3640
Signal: -0.3711
The MACD indicates bearish momentum, with the MACD line below the signal line.
Pivot Points
Support Levels:
S1: €24.82
S2: €24.30
S3: €23.84
Resistance Levels:
R1: €25.89
R2: €26.26
R3: €26.78
The stock price is near the first support level, indicating potential reversal points.
Financial Data
Key Statistics:
Market Capitalization: €3.43B
Trading Volume: 123.75K (30-day average volume: 173.45K)
P/E Ratio: 11.3x (below the Greek market average)
Revenue Estimate: €34.14
Analyst Forecasts:
Highest Estimate: €38.00
Lowest Estimate: €31.10
Average Estimate: €34.14
Analysts predict a 38.12% increase in stock price over the next year, based on current performance and future prospects.
Valuation Estimate
Jumbo's stock appears undervalued compared to its intrinsic value, based on analyst forecasts and market prices.
Future Growth
Key Information:
Earnings Growth Rate: 5.8% annually
Revenue Growth Rate: 7.1% annually
Expected Return on Equity: 23.8% in 3 years
Recent Updates:
Target price increased by 7.7% to €33.89 (May 23)
Target price increased by 7.3% to €33.76 (May 6)
Target price increased by 8.1% to €28.50 (August 11)
Target price increased by 8.4% to €27.64 (June 27)
Past Performance
Key Information:
Earnings Growth Rate: 14.2% annually
EPS Growth Rate: 14.2% annually
Revenue Growth Rate: 6.2% annually
Return on Equity: 22.8%
Net Margin: 28.0%
Jumbo has shown strong performance in previous years, with steady earnings and revenue growth, and high return on equity.
Jumbo S.A. demonstrates solid performance and has good growth prospects. Despite the recent drop in stock price, analysts remain positive about the company's future, with predictions for significant stock price increase over the next year. The company continues to invest in new markets and improve the efficiency of its existing operations, making it an attractive choice for investors.
CHF/JPY For Bullishwait for pull-back near by entry point and then go long
general trend is up trend
have fun :)

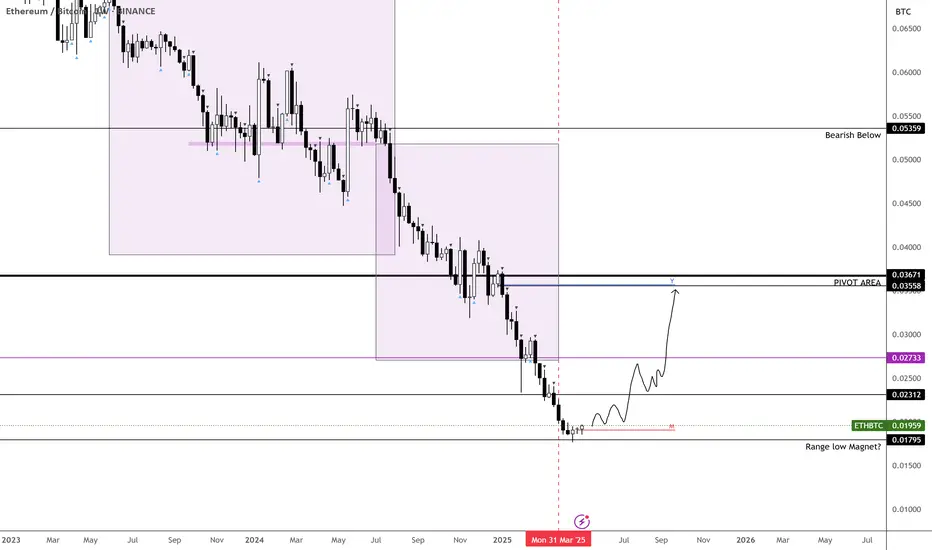
ETHBTC – Bottom Likely In!Finally stepping in to say it—ETHBTC has likely bottomed.
April marked the final month of its bearish phase, and it just tapped the impulse zone from the last major move, which also lines up with a key range low we haven’t seen since December 2019.
The weekly is starting to show early signs of strength, adding weight to this being a pivotal area.
From a risk/reward standpoint, this is arguably the best BINANCE:ETHBTC setup in a long time.
Time to act accordingly—this could be the moment many have been waiting for. I expect BTC dominance to give alts some room over the next couple of weeks. The real test comes in July.
MARKETSCOM:ETHEREUM BINANCE:ETHUSDT
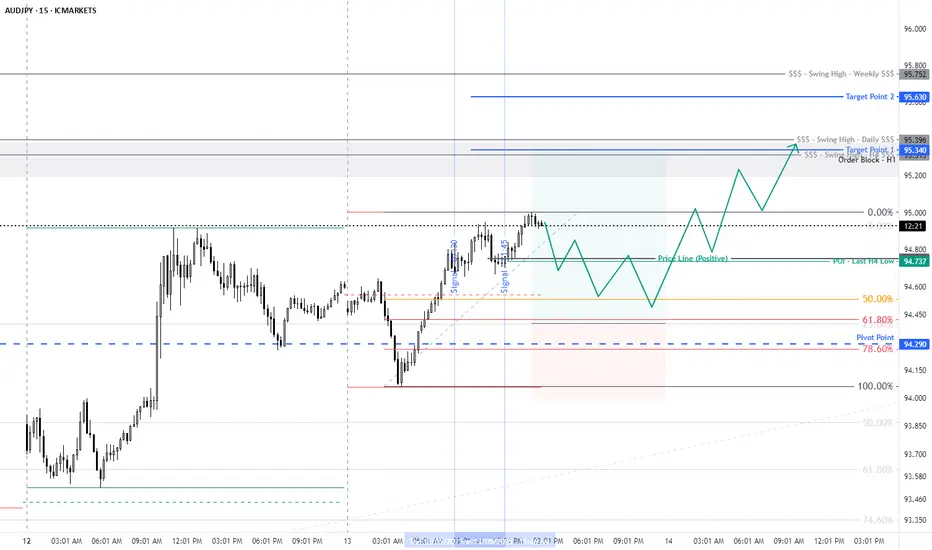
AUD/JPY For Bullishyou can long now
or
wait for pull-back near by entry point and then go long
general trend is up trend
have fun :)
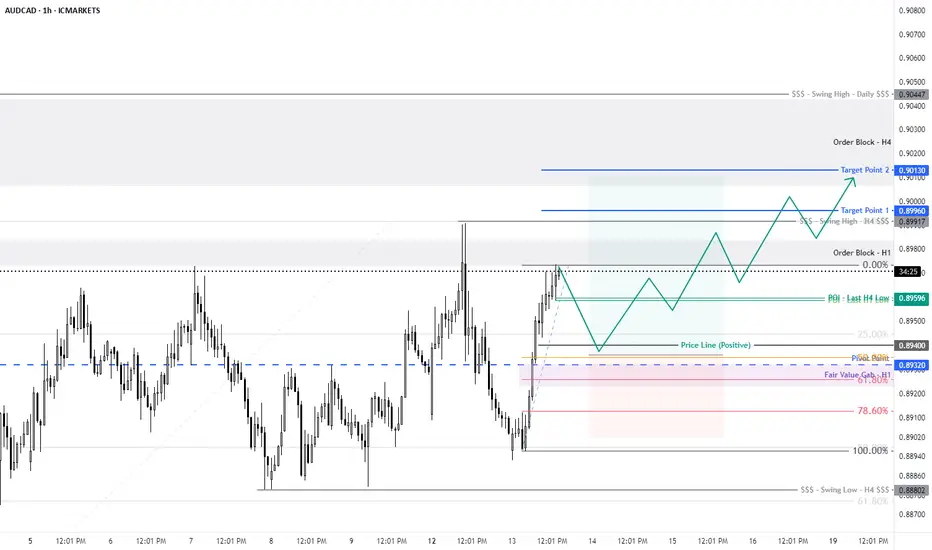
AUD/CAD For Bullishwait for pull-back near by entry point and then go long
general trend is up trend
have fun :)