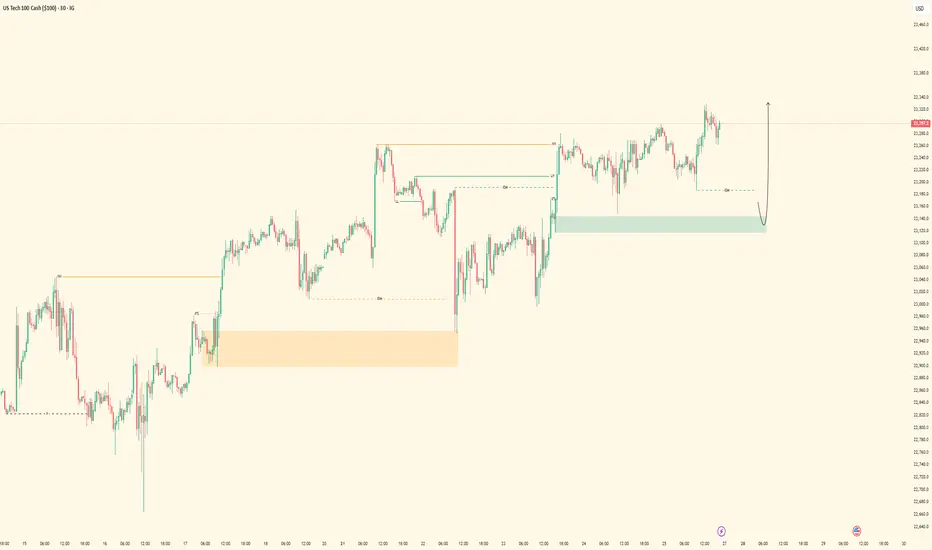
NASDAQ| Bullish Bias - Refined OB Near MitigationPair: NASDAQ (NAS100)
Bias: Bullish
HTF Overview (4H):
Strong bullish structure has been the narrative, and last week’s upside intent confirmed the move. Current action suggests price is preparing for continuation after brief consolidation.
LTF Confirmation (30M):
Structure has been refined with a key OB in play. Price is approaching mitigation, and I’ve been tracking this level closely since last week.
Entry Zone: Waiting for clear 5M shift after OB mitigation. 5M OB already tapped — now I’m watching for confirmation to execute.
Targets: 5M highs first, 30M highs if price maintains momentum
Mindset Note: Focused and flowing. No forcing — I’ve tracked this from HTF to LTF and now I’m just waiting for price to invite me in. Clarity + patience = execution.
Pivot Points
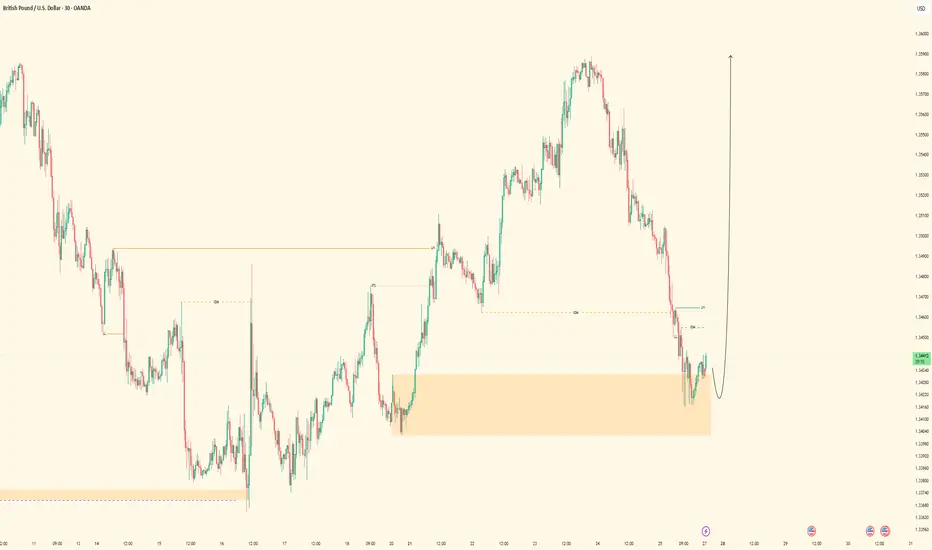
GBPUSD | Bullish Bias - Midframe Alignment After SSL SweepPair: GBPUSD
Bias: Bullish
HTF Overview (4H):
Price structure is clearly bullish with strong intent. Looking to ride momentum as price continues toward 30M and 4H highs.
LTF Confirmation (30M):
Structure has been refined. Price swept sell-side liquidity and cleanly mitigated a key 30M OB — now I’m monitoring for LTF alignment to catch the continuation.
Entry Zone: Waiting for 5M CHoCH to flip bullish. Entry comes on the pullback into demand once the shift confirms.
Targets: 5M highs, 30M highs — trailing based on delivery and momentum
Mindset Note: No emotion, no forcing. Waiting for alignment from Smart Money and letting price invite me in. Clarity leads, execution follows.
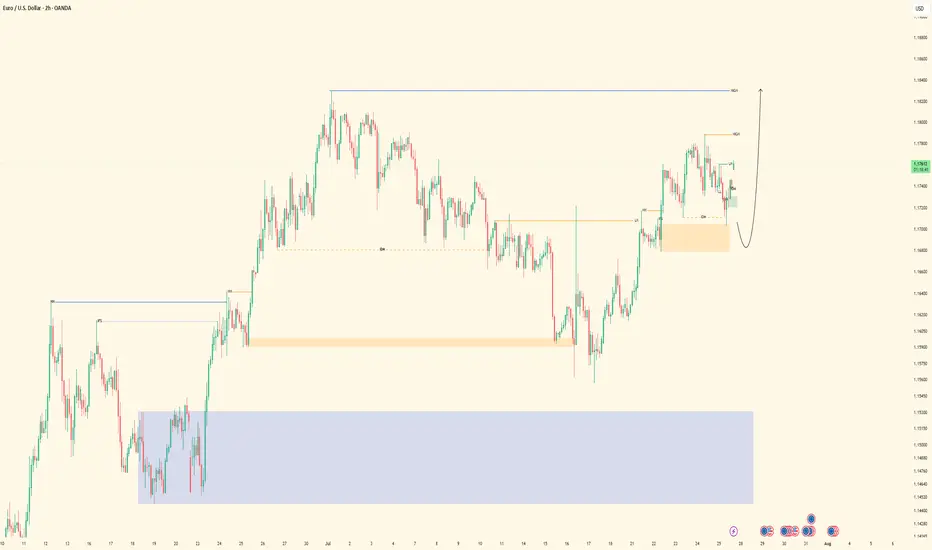
EURUSD| Bullish Bias - Refined OB Play into ContinuationPair: EURUSD
Bias: Bullish
HTF Overview (4H):
Bullish structure remains intact — recent break to the upside was followed by a healthy pullback. Now price is continuing the push toward external 4H highs.
LTF Confirmation (30M):
Structure refined from last week. Price recently mitigated a 30M demand OB and is now showing signs of continuation. Watching for clean 5M shift to confirm the next leg.
Entry Zone: 5M CHoCH flip followed by pullback into demand zone
Targets: 30M highs, then extended target at 4H highs
Mindset Note: Keeping it clean and reactive. No guessing — I’m tracking Smart Money flow, structure shift, and waiting on my cue.
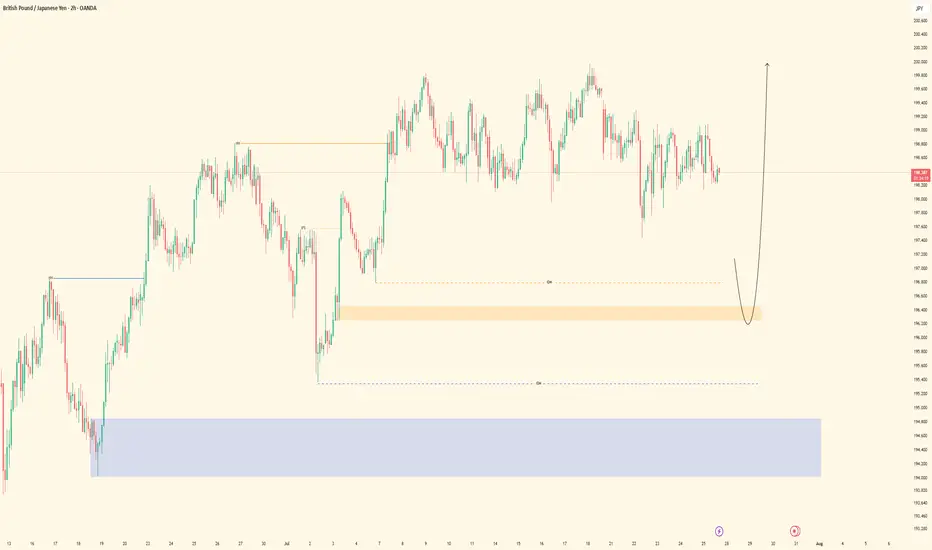
GBPJPY| Bullish Bias - Range Play Before The SweepPair: GBPJPY
Bias: Bullish
HTF Overview (4H):
Structure remains bullish, but price is currently sitting inside a tight top-of-range formation. No clear breakout yet — still waiting on a deeper sell-side liquidity sweep to fuel the next leg. Until then, the focus is on how price dances within mid-range liquidity.
LTF Confirmation (30M):
Still watching for a clean sweep of previous internal lows from last week. 30M OB is refined and marked — once it’s mitigated, I’ll wait for LTF confirmation.
Entry Zone: Will monitor for 5M shift and intent after OB mitigation.
Targets: Initial target = 5M highs; extended = 30M highs depending on price delivery.
Mindset Note: Sitting on hands until Smart Money shows its hand. No rushing range plays. Patience = precision.
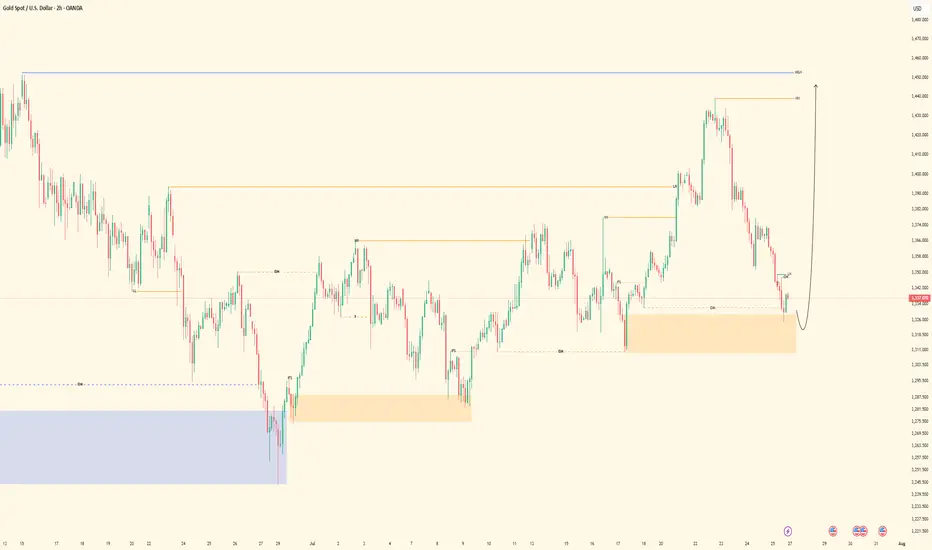
XAUUSD | Bullish - Deep Liquidity Grab + OB MitigationPair: XAUUSD
Bias: Bullish
HTF Overview (4H):
Structure remains bullish, with continuation expected toward prior 4H highs. Last week’s strong bullish intent signaled Smart Money’s directional commitment. Price reached deeper to seek liquidity beneath major sell-side lows, setting the stage.
LTF Confirmation (30M):
Price cleanly mitigated a 30M order block resting just under the swept liquidity. This reinforces the bias, and I’ll now be watching for LTF confirmations once the market opens.
Entry Zone: Within or just above the 30M OB
Targets: 5M and 30M internal highs. Trailing targets will depend on how price delivers.
Mindset Note: Patience is key here. I’m waiting for clean confirmation before executing — no rush. The story is written. I just need the trigger.
Sugar Future - New York (Raw) Quote | Chart & Forecast SummaryKey Indicators On Trade Set Up In General
1. Push Set Up
2. Range Set Up
3. Break & Retest Set Up
Notes On Session
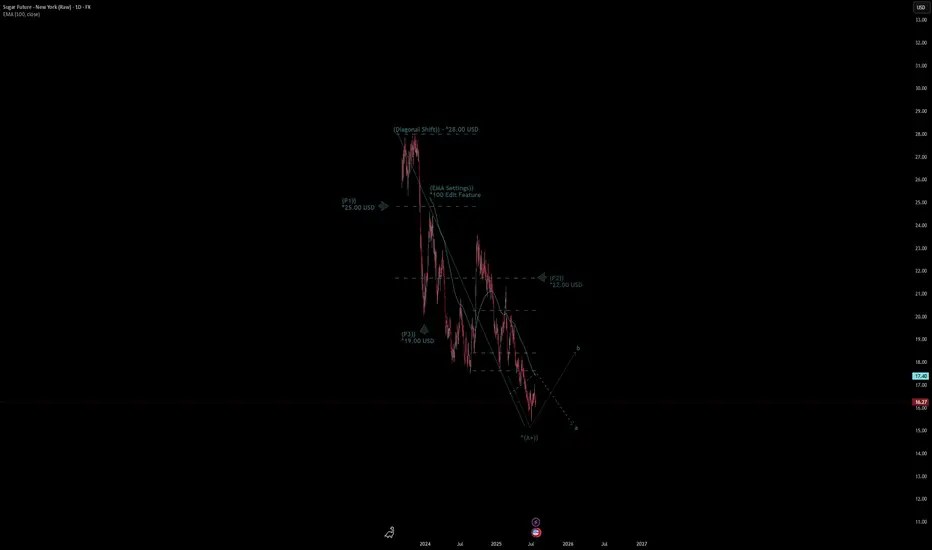
# Sugar Future - New York (Raw) Quote
- Double Formation
* (Diagonal Shift)) - *28.00 USD | Completed Survey
* (EMA Settings)) - *100 Edit Feature | Subdivision 1
- Triple Formation
* (P1)) / (P2)) & (P3)) | Subdivision 2
* (TP1) = a / Long Consecutive Range
* (TP2) = b / Short Consecutive Pullback | Subdivision 3
* Daily Time Frame | Trend Settings Condition
- (Hypothesis On Entry Bias)) | Regular Settings
- Position On A 1.5RR
* Stop Loss At 19.00 USD
* Entry At 16.00 USD
* Take Profit At 12.00 USD
* (Downtrend Argument)) & No Pattern Confirmation
- Continuation Pattern | Not Valid
- Reversal Pattern | Not Valid
* Ongoing Entry & (Neutral Area))
Active Sessions On Relevant Range & Elemented Probabilities;
European-Session(Upwards) - East Coast-Session(Downwards) - Asian-Session(Ranging)
Conclusion | Trade Plan Execution & Risk Management On Demand;
Overall Consensus | Sell
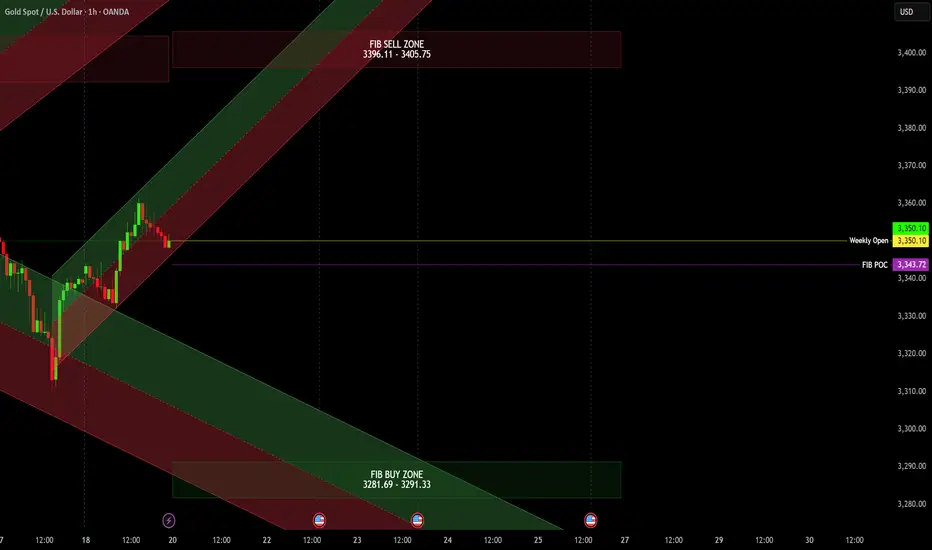
Gold weekly outlookGold Fib buy and sell zones for the week ahead as well as the current uptrend.
Wait for Monday to play and see what zone plays out
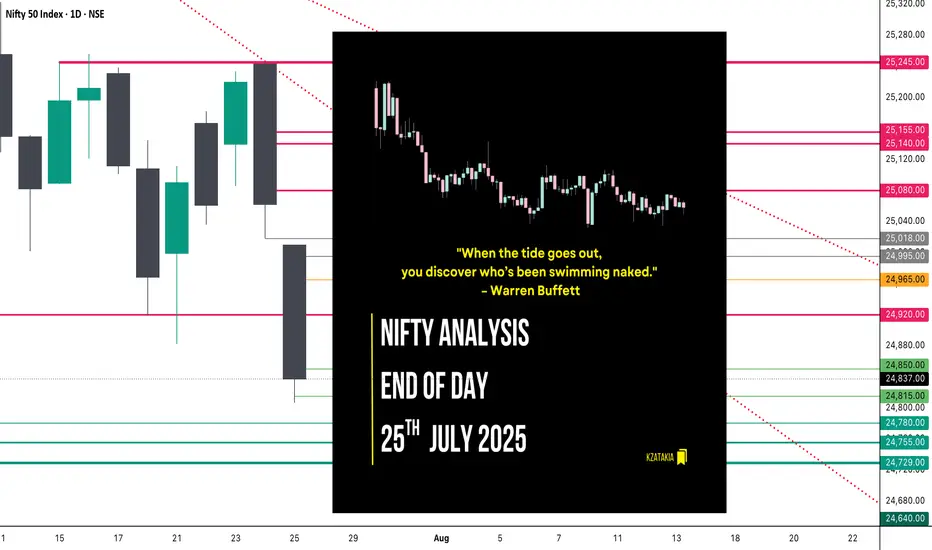
Nifty Analysis EOD – July 25, 2025 – Friday🟢 Nifty Analysis EOD – July 25, 2025 – Friday 🔴
"When the tide goes out, you discover who’s been swimming naked." – Warren Buffett
Nifty GapDowns Below Key Support and Slips Further
The market opened with a sharp GapDown, breaching the previous day's low and instantly shedding 150 points within the first hour. Nifty attempted to find footing near the crucial 21st July low zone of 24,850–24,880, but the support gave way, slipping an additional 50 points.
The day mostly drifted around these lower levels with bearish dominance. Though bulls made an effort to recover late in the session, it lacked strength. The index finally settled at 24,837, decisively closing below the 21st July low — signalling a deeper structural breakdown.
📉 Trend & Zone Update
Resistance Zone Shifted To: 25,144 ~ 25,155
Support Zone Shifted To: 24,729 ~ 24,755
📊 What If Plans – 28th July Outlook
🅰️ Plan A (Contra Long Setup)
If market opens inside the previous day range and finds support at 24,815 ~ 24,850
Then potential targets are 24,920, 24,965, and 25,020
🅱️ Plan B (Trend is Friend – Short Continuation)
If market opens inside range and faces resistance around 24,965 ~ 24,995
Then aim for 24,850, 24,815, 24,780, and 24,730
⏸️ On-the-Go Plan
If market Gaps Up/Down outside previous day’s range
Then wait for the Initial Balance (IB) to form and act based on structure and S/R levels.
🕯 Daily Time Frame Chart with Intraday Levels
🕯 Daily Candle Breakdown
Open: 25,010.35
High: 25,010.35
Low: 24,806.35
Close: 24,837.00
Candle Structure
Body: Strong red candle (−173.35 pts)
Upper Wick: None (open = high)
Lower Wick: 30.65 pts
Interpretation:
A textbook bearish Marubozu — shows sellers had control throughout.
Bears stepped in immediately from open, preventing any bullish response.
Minimal lower wick implies limited buyer defense even at the session low.
Key Insight:
Bears are in command; bulls must reclaim 25,000+ quickly to prevent further downside.
If 24,800–24,820 breaks, eyes shift to 24,700–24,750 zone next.
🛡 5 Min Intraday Chart
⚔️ Gladiator Strategy Update
ATR: 192.95
IB Range: 87.4 → Medium
Market Structure: Imbalanced
Trades Triggered:
🕙 10:10 AM – Short Entry → 🎯 Target Hit (1:2.4 R:R)
🧭 Support & Resistance Levels
Resistance Zones
24,920
24,965
24,995 ~ 25,018
25,080
25,140 ~ 25,155
Support Zones
24,780
24,755 ~ 24,729
24,640
📌 Final Thoughts
When strong candles appear back-to-back with no meaningful recovery in between, it’s not just a correction — it’s a statement. In this market phase, reacting to price structure rather than assumptions will keep you on the right side. Stay nimble, stay prepared.
✏️ Disclaimer
This is just my personal viewpoint. Always consult your financial advisor before taking any action.
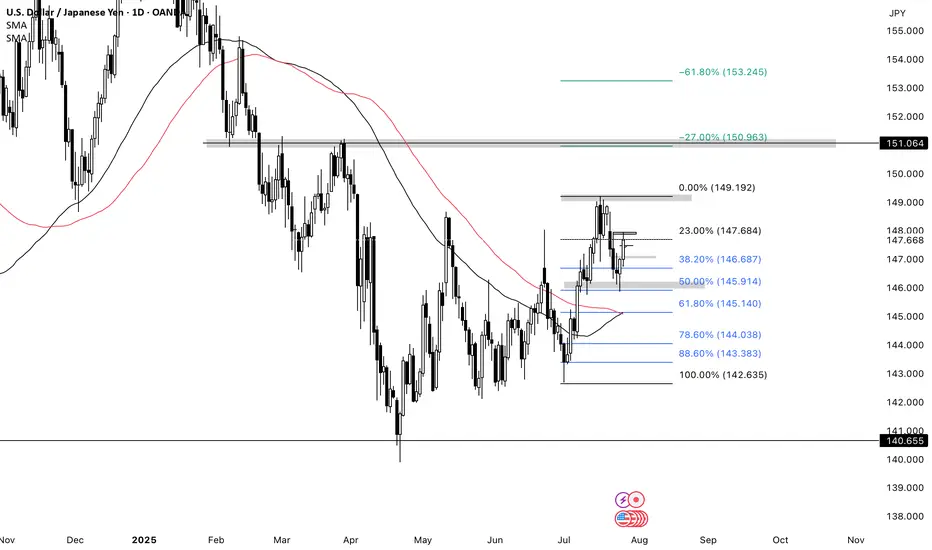
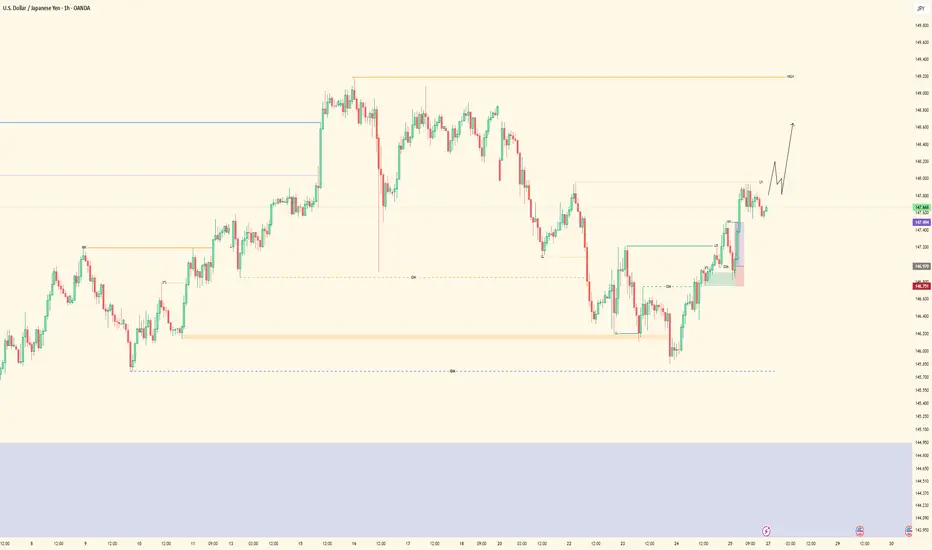
USDJPY BULLISHUJ closed bullish last week so I’ll continue looking for buys this week. There was a daily double bottom & 50% Retracement on the daily timeframe. I would like for price to either break the H4 resistance, form a HL then look for buys. Or price could retrace and form a HL the I’ll look for buys towards daily resistance @149.190 then my next TP will be 151.00
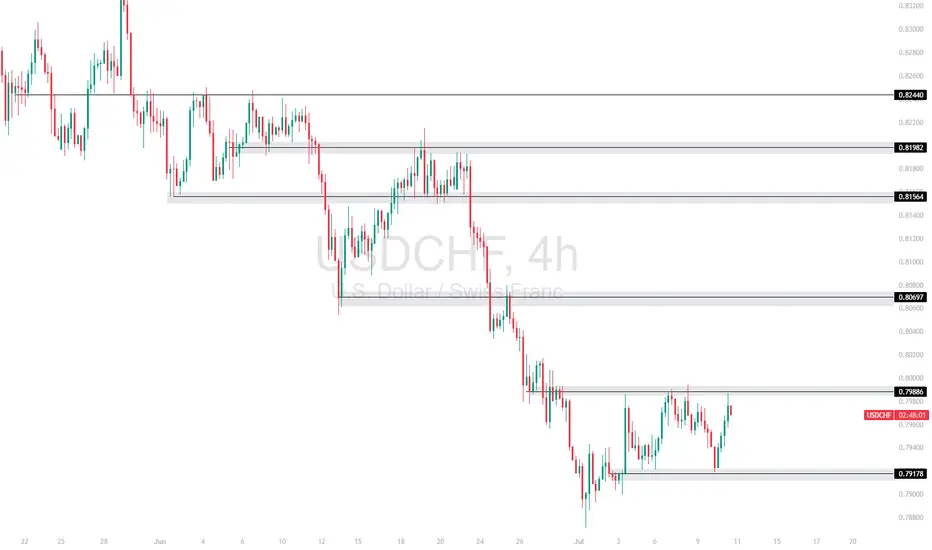
USDCHF – Key Resistance TestUSDCHF is currently ranging after a strong downtrend, now testing the 0.79886 resistance level. Price is bouncing between this resistance and support at 0.79178, showing signs of indecision.
Support at: 0.79178 🔽
Resistance at: 0.79886 🔼
🔎 Bias:
🔼 Bullish: Break and close above 0.79886 targets 0.80697 and possibly 0.81564.
🔽 Bearish: Rejection from 0.79886 and break below 0.79178 could resume the bearish trend.
📛 Disclaimer: This is not financial advice. Trade at your own risk.
ETH Soars $2.6B: Inside BBDelta and Cathie Wood’s Strategic BetIn July 2025, the Ethereum network witnessed an unexpected wave of withdrawals totaling over $2.6 billion in unstaked ETH — one of the largest single-month movements since Ethereum’s transition to proof-of-stake. While headlines suggested panic, BBDelta’s analysts and Ark Invest CEO Cathie Wood see a different narrative unfolding: one rooted in strategic portfolio rebalancing and maturing market behavior.
Beyond the Headlines: What the Data Really Shows
According to BBDelta’s internal chain analysis, over 842,000 ETH were unstaked across major validator pools including Lido, Rocket Pool, and Coinbase. However, contrary to expectations, there was no mass sell-off. In fact, more than 65% of unstaked ETH remained idle or were redirected to DeFi platforms such as Aave and Curve.
This distinction is crucial. “Unstaking doesn’t necessarily equal selling,” explains Anna Keller, Senior Market Strategist at BBDelta. “It reflects evolving investor preferences, where capital seeks higher yield or greater liquidity in anticipation of macroeconomic shifts.”
Cathie Wood concurs, stating in a Bloomberg interview, “Ethereum’s staking environment is beginning to resemble fixed-income markets. Institutional holders are unstaking not out of fear, but in search of more dynamic return models.”
Institutional Movements Driving the Shift
One of the primary drivers behind the recent wave appears to be institutional rebalancing. As yields on real-world assets (RWAs) and tokenized Treasury instruments improve, large crypto holders — including family offices and asset managers — are rotating exposure from static ETH staking to diversified yield strategies.
BBDelta’s research notes a spike in ETH deployment into liquid staking derivatives (LSDs) and restaking protocols like EigenLayer, signaling a pivot toward composable and flexible income mechanisms.
Moreover, geopolitical uncertainty and rate policy ambiguity continue to drive caution. “The macro backdrop — especially ongoing tensions around U.S. debt restructuring and eurozone contraction — is pushing capital toward adaptable on-chain positions,” Keller adds.
Cathie Wood’s Perspective: Strategy, Not Stress
Cathie Wood, whose firm Ark Invest holds significant ETH positions, argues the current trend mirrors broader crypto-market maturity. “Volatility remains, but the investor base is smarter,” she says. “What we’re seeing with this $2.6 billion movement is the normalization of active asset allocation in crypto.”
She draws parallels to traditional finance, where fixed-income investors routinely rotate holdings between instruments based on risk and duration. “Ethereum has reached a point where it can sustain a yield curve of its own — that's a sign of strength, not weakness.”
BBDelta’s Market Outlook
BBDelta expects a continued reshaping of Ethereum’s staking landscape, with less concentration in passive lockups and more emphasis on modular strategies. The firm predicts ETH will increasingly serve as a base asset in complex, multi-layered DeFi ecosystems — from restaking protocols to derivatives and real-world asset bridges.
In the near term, BBDelta projects moderate price consolidation around the $3,400–$3,800 range, driven by macro correlations with tech stocks and bond yields. However, the firm remains long-term bullish, citing Ethereum’s dominant position in smart contract execution, enterprise adoption, and regulatory clarity across the EU and Asia-Pacific.
Final Thoughts
The $2.6 billion Ethereum unstaking should not be misinterpreted as a crisis. Rather, as BBDelta and Cathie Wood both emphasize, it represents a milestone in Ethereum’s financial evolution. Sophisticated capital is optimizing exposure, not fleeing risk — and in that, the Ethereum ecosystem proves its readiness for the next institutional wave.

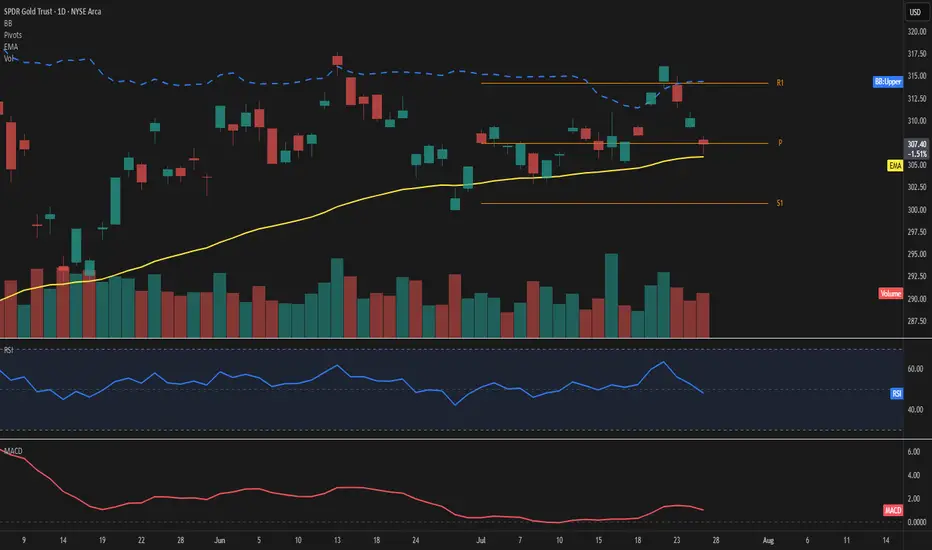
GLD – Price consolidates at highsPrice is hovering just above the 50-day EMA at 307, showing signs of short-term hesitation near the Fibonacci pivot. The upper Bollinger Band sits at 314, leaving moderate room for expansion if momentum picks up.
The RSI reads 48, reflecting a balanced setup without clear directional bias. MACD remains slightly positive, suggesting a still-constructive but soft momentum.
Key levels to watch include the pivot at 307 and the support at 301. On the upside, the 314 area aligns with both R1 and the upper band, acting as the next challenge.
Volume is up sharply (+22%) despite a mild -0.9% price pullback, indicating possible accumulation beneath the surface.
As long as price holds above the 50-day EMA, the structure remains intact.
A move away from the pivot zone will likely define the next directional wave.
Top 5 Cryptocurrencies This Month: July 2025 Leading PerformersBy Forbes Contributor
Despite ongoing regulatory turbulence and macroeconomic uncertainty, July 2025 has proven to be a month of notable gains across the cryptocurrency market. A mix of established leaders and rising altcoins have outperformed expectations, driven by ecosystem developments, market sentiment, and broader digital asset adoption. Based on performance metrics, trading volumes, and real-world developments, here are the top five crypto gainers of the month.
1. Toncoin (TON)
+67% (Month-to-Date)
Toncoin surged on the back of growing Telegram ecosystem integrations. With more mini-apps and wallets going live on the platform, TON is rapidly becoming a medium of exchange for users worldwide. Its alignment with a major messaging platform provides Toncoin with unique network effects that most cryptocurrencies can’t match.
Key driver: Telegram’s global user base crossing 1 billion, bringing TON into daily utility.
2. Render (RNDR)
+58%
The rise of AI and decentralized GPU rendering continues to benefit the Render Network. RNDR gained momentum as AI developers increasingly rely on decentralized GPU resources to train and deploy models, particularly in gaming and VR applications.
Key driver: Strategic partnerships with gaming studios and AI startups boosted investor confidence.
3. Ethereum (ETH)
+31%
Ethereum gained steadily following the approval of several ETH-based financial products in Europe and Asia. Additionally, increased staking activity and rollup adoption contributed to its bullish trajectory.
Key driver: Layer-2 activity and continued optimism surrounding Ethereum 2.0 upgrades.
4. Arbitrum (ARB)
+26%
Arbitrum benefited from significant ecosystem growth and DAO-funded initiatives. The implementation of new governance features and distribution of developer grants have brought more attention to the rollup-based network.
Key driver: Grant program rollout and cross-chain bridges attracting liquidity from competitors.
5. Worldcoin (WLD)
+24%
Despite controversy, Worldcoin’s biometric authentication project saw renewed adoption in emerging markets. With discussions around digital ID becoming central to Web3 identity, WLD attracted attention from institutional analysts.
Key driver: Integration into digital ID pilots in Latin America and Southeast Asia.
Final Thought
July's winners reflect a broader shift in investor preference: towards utility-driven, scalable projects. As we enter August, investors should monitor upcoming protocol upgrades, regulatory developments, and macroeconomic shifts — all of which could impact the next wave of top performers.

Diageo plc Quote | Chart & Forecast SummaryKey Indicators On Trade Set Up In General
1. Push Set Up
2. Range Set Up
3. Break & Retest Set Up
Notes On Session
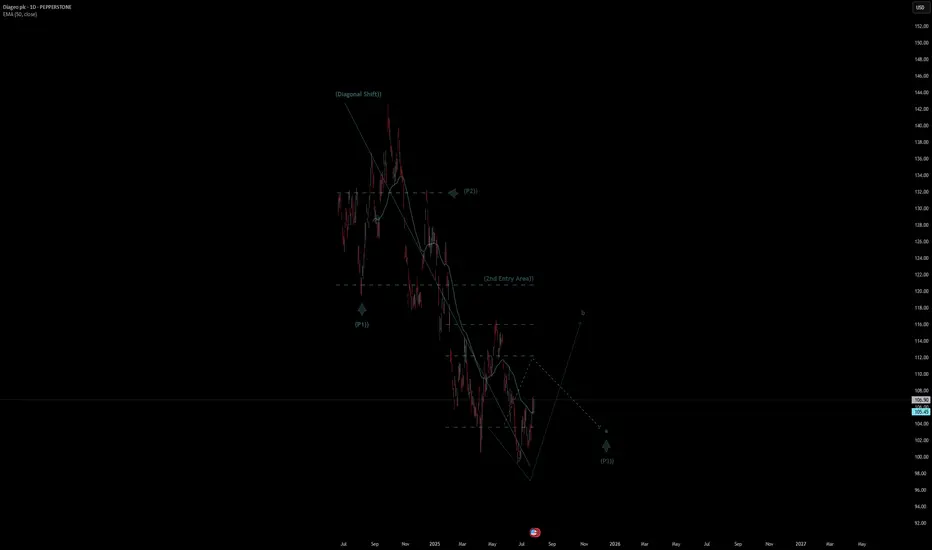
# Diageo plc Quote
- Double Formation
* (Diagonal Shift)) | Completed Survey
* (2nd Entry Area)) | Subdivision 1
- Triple Formation
* (P1)) / (P2)) & (P3)) | Subdivision 2
* (TP1) = a / Long Consecutive Range
* (TP2) = b / Short Consecutive Pullback | Subdivision 3
* Daily Time Frame | Trend Settings Condition
- (Hypothesis On Entry Bias)) | Regular Settings
- Position On A 1.5RR
* Stop Loss At 113.00 USD
* Entry At 107.00 USD
* Take Profit At 98.00 USD
* (Downtrend Argument)) & No Pattern Confirmation
- Continuation Pattern | Not Valid
- Reversal Pattern | Not Valid
* Ongoing Entry & (Neutral Area))
Active Sessions On Relevant Range & Elemented Probabilities;
European-Session(Upwards) - East Coast-Session(Downwards) - Asian-Session(Ranging)
Conclusion | Trade Plan Execution & Risk Management On Demand;
Overall Consensus | Sell
UJ| Bullish Structure Ride | 5M Demand ExecutionPair: USDJPY
Bias: Bullish
HTF Overview: 4H structure stayed bullish with clean intent. Internal liquidity resting above prior highs, and price is still pushing through the 30M range toward those 4H targets.
LTF Confirmation: 30M showed a clean continuation range with a lower high (LH) inside structure — price never broke character. I tracked it into 5M where the OB was sitting patiently.
Entry Zone: Tapped into the 5M OB with a short-term sweep right before — no need for extra confirmation. The move had structure, inducement, and momentum on its side.
Target: TP hit at the 5M highs, but overall I’m watching for the 30M LH to go first, then ultimately expecting price to run the 4H internal highs this upcoming week.
Mindset Note: When the story is clear on the HTF, all you need is one clean LTF entry to ride with conviction. I’m letting the higher timeframe breathe and staying ready.
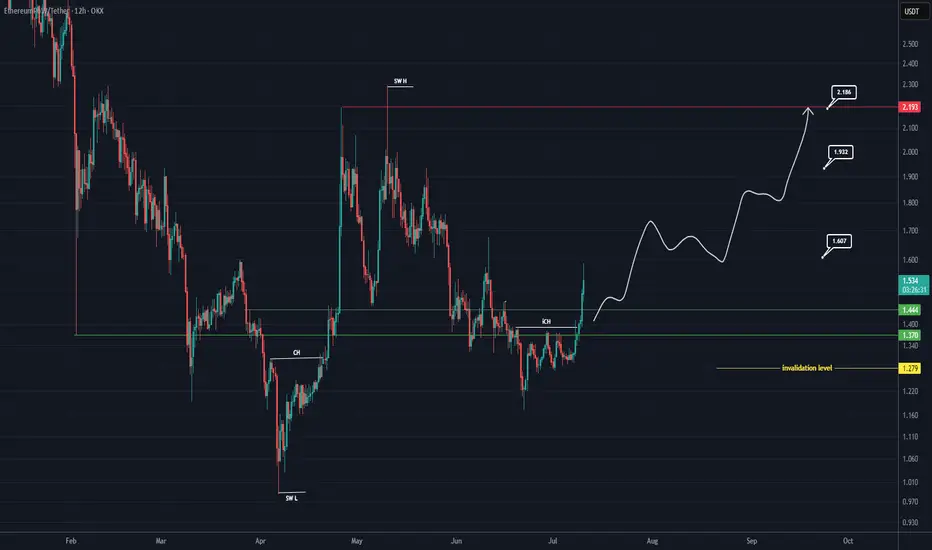
ETHW Looks Bullish (12H)Considering the CH and bullish CHs on the chart, as well as the recent reclaim of key levels, we can maintain a bullish outlook on this coin.
The targets have been marked on the chart.
If a pullback occurs to the green zone, it could present a buy/long opportunity.
A daily candle close below the invalidation level will invalidate this analysis.
For risk management, please don't forget stop loss and capital management
Comment if you have any questions
Thank You
HBAR Game Plan: Short the Bounce, Long the Liquidity GrabHBAR has been moving strongly and is currently offering both short and long trade opportunities based on a clean potential ABC corrective pattern, key fib levels, volume profile, and anchored VWAP. Let’s break down the setup.
🧩 Technical Breakdown
Higher Timeframe Confluence:
0.618 fib retracement from the macro move
1.618 trend-based fib extension
1.272 VWAP band resistance
Point of Control (POC) from the visible range profile
This is marked as a major take profit/short opportunity zone.
For extra confluence, the negative fib extension golden pocket (-0.618 to -0.666) also aligns right at this resistance zone
Current Structure:
We’re potentially completing wave B of an ABC corrective move
Price has retraced into a high-probability short zone
🔴 Short Setup
Entry Zone:
Between the 0.702 and 0.786 fib retracement levels
Why Here?
0.702–0.786 fib retracement → short zone for reversals
Potential wave B top → setting up for a C leg down
Target (TP):
Around $0.25–$0.24, near the expected wave C completion
🟢 Long Setup
Entry Zone:
~$0.25–$0.24 area.
Why Here?
This zone is a strong confluence area:
➡️ 0.786 fib retracement
➡️ 1.0 trend-based fib extension of ABC
➡️ Anchored VWAP from the entire trend, offering dynamic support
➡️ Liquidity pool
➡️ Previous weekly Open
Plan:
Wait for price to complete wave C into this zone, then look for bullish reaction signs to enter long.
💡 Educational Insight
Why the 0.702–0.786 short zone?
These fib levels are often overlooked but are key “hidden” zones where wave B tops out before C waves.
Why anchored VWAP?
Anchored VWAP gives you dynamic institutional support/resistance, especially when aligned with fibs and liquidity.
Why wait for confirmation?
Blindly longing or shorting levels can trap you. Wait for SFPs, wick rejections, or lower timeframe structure flips to boost trade probability.
Final Thoughts
HBAR is in a highly interesting zone, offering both:
A short setup into the C wave,
And a long setup at the C wave completion, backed by multiple confluence factors.
Let the levels come to you and wait for confirmation!
_________________________________
💬 If you found this helpful, drop a like and comment!
Want breakdowns of other charts? Leave your requests below.

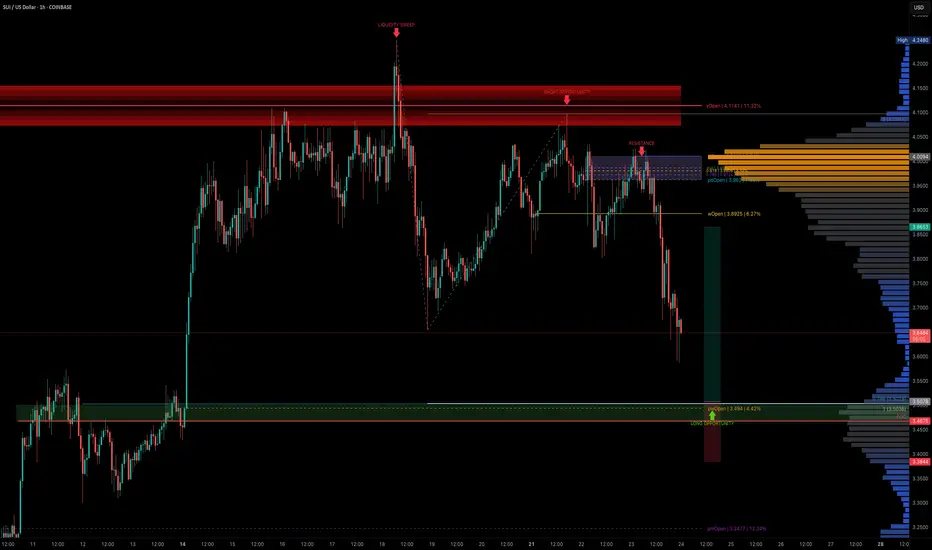
SUI — Structured Dip Buy Zone You Shouldn't IgnoreSUI has been technically clean, with well-respected Elliott Wave counts and fib levels.
As the broader market dips, it's time to look for sniper long entries and SUI is setting up beautifully for one around the $3.50 zone.
🧩 Key Confluence Zone: $3.50
This level offers a high-probability buy zone, backed by multiple layers of technical confluence:
0.786 Fib Retracement: $3.5029
1.0 Trend-Based Fib Extension: $3.5036
Previous Trading Range POC: $3.4675
Previous Weekly Open (pwOpen): $3.494
🟢 Long Trade Setup
Entry: ~$3.500
Stop-loss: $3.4675
Target (TP): $3.85+
R:R: ~1:3
🛠 Indicator Note
In this analysis I'm using my own indicator:
➡️ DriftLine — Pivot Open Zones
It helps identify key market opens (daily, weekly, prior), which often act as magnet levels and reaction zones.
➡️ You can use it for free — just check out my profile under “Scripts” and apply it to your charts.
💡 Pro Insight: Build Trades Where Tools Agree
A single level is just noise. But when fib retracements, extensions, POCs, opens, and price structure all line up — that’s where conviction trades are made.
The more overlap, the more likely the market reacts — this setup shows just that.
Final Thoughts
SUI is approaching a technically rich zone around $3.50, and this could be one of those low-risk, high-reward long entries if confirmed by price action.
With a clean invalidation and 1:3 R:R, this is the kind of setup you want to plan — not chase.
Set your alerts, stay patient, and trade with structure. 🚀✍️
_________________________________
💬 If you found this helpful, drop a like and comment!
Want breakdowns of other charts? Leave your requests below.
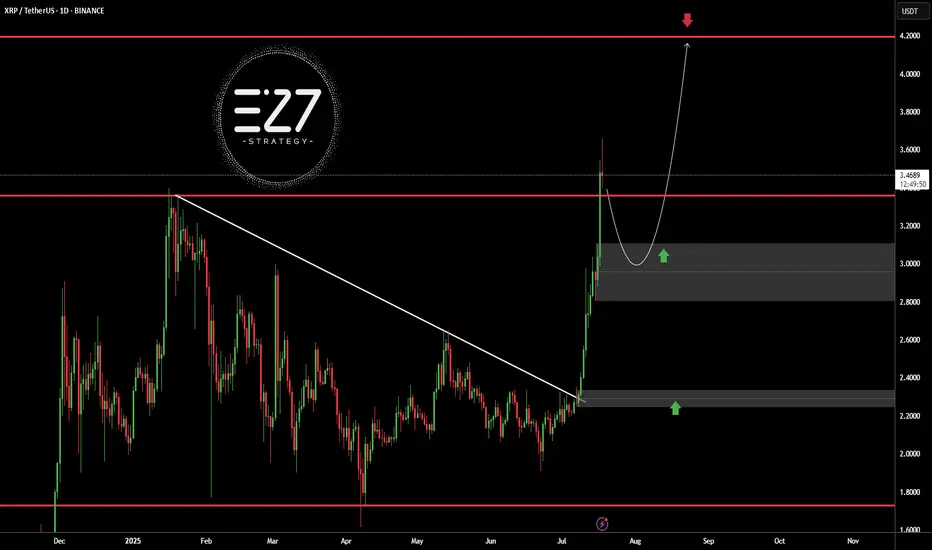
XRPUSDTBINANCE:XRPUSDT broke above its long-term downtrend line and surged to the $3.5000 resistance area, but is now undergoing a correction. The current bullish structure, with a higher high and higher low, suggests the trend remains upward. A pullback toward the $3.0000 demand zone is likely and would be a healthy retracement. Holding this area could trigger a continuation toward the key resistance at $4.2000.
Key Level Price
Main Support $2.2000
Main Resistance $4.2000
Best Buy Range $2.9500 – $3.1500
Best Sell Range $4.1000 – $4.2000
Investment Risk (Buying) Medium
⚠️Please control RISK management
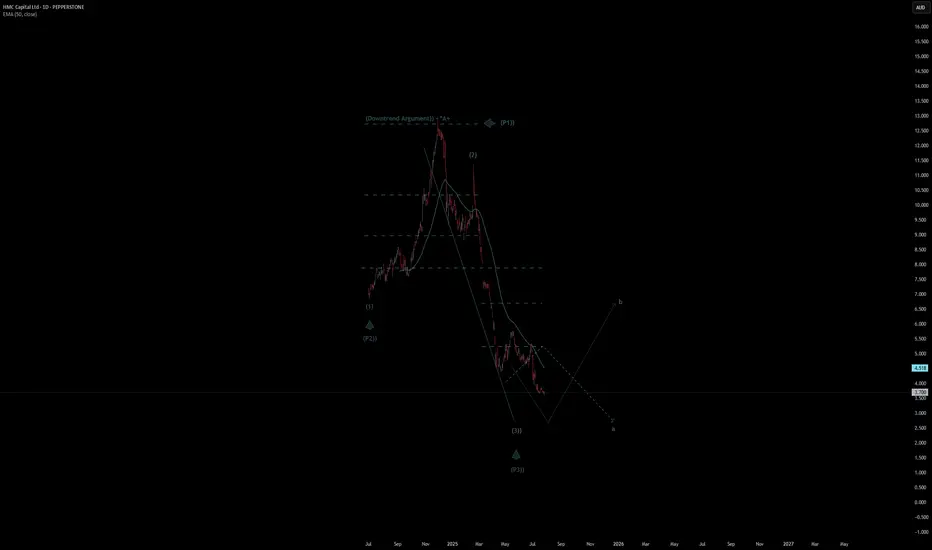
HMC Capital Ltd Quote | Chart & Forecast SummaryKey Indicators On Trade Set Up In General
1. Push Set Up
2. Range Set Up
3. Break & Retest Set Up
Notes On Session
# HMC Capital Ltd Quote
- Double Formation
* (Downtrend Argument)) - *A+ | Completed Survey
* Ongoing Wave (3)) - *(P3)) | Subdivision 1
- Triple Formation
* (P1)) / (P2)) & (P3)) | Subdivision 2
* (TP1) = a / Long Consecutive Range
* (TP2) = b / Short Consecutive Pullback | Subdivision 3
* Daily Time Frame | Trend Settings Condition
- (Hypothesis On Entry Bias)) | Indexed To 100
- Position On A 1.5RR
* Stop Loss At 80.00 AUD
* Entry At 50.00 AUD
* Take Profit At 10.00 AUD
* (Downtrend Argument)) & No Pattern Confirmation
- Continuation Pattern | Not Valid
- Reversal Pattern | Not Valid
* Ongoing Entry & (Neutral Area))
Active Sessions On Relevant Range & Elemented Probabilities;
European-Session(Upwards) - East Coast-Session(Downwards) - Asian-Session(Ranging)
Conclusion | Trade Plan Execution & Risk Management On Demand;
Overall Consensus | Sell
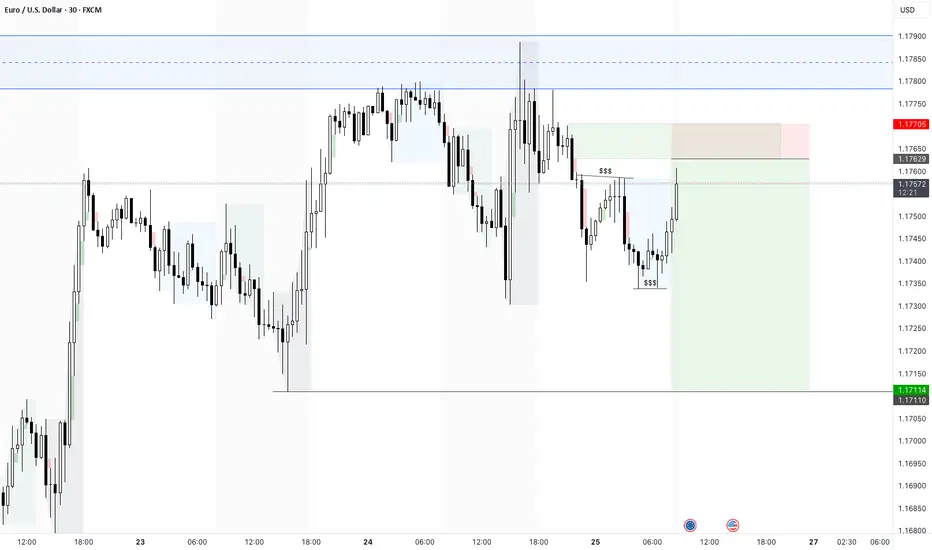
EURUSD pullback short- 25/7/25Price failed to break through the supply zone above that was identified on the higher 4hr and 1hr TF.
The last unmitigated zone is highlighted in green and looking to take a short from there to the next low.
There is equal level liquidity below that will draw price there.
In addition the HH is just a wick giving me more confidence that there is weakness in the EUR.
XAUUSD continuation of larger bullish move - 25/7/25Gold did touch the higher timeframe supply zone and pull back. It is now at a point where i am looking for a pivot to form to continue bullish.
I did place a buy limit trade at the extreme zone that started the break of structures.
i will wait a see if it drops and triggers or forms a pivot at the 4H zone that broke structure.

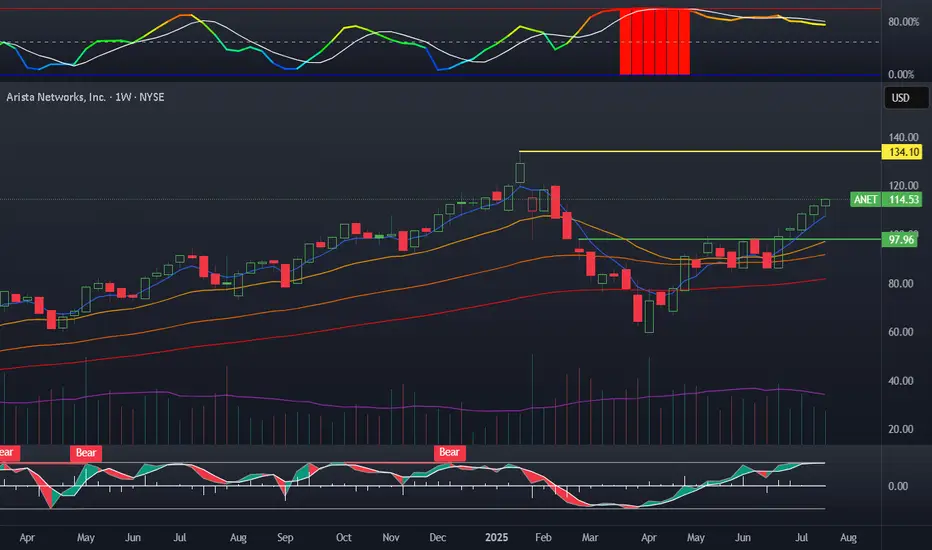
ANET new positionStarted a feeler position in ANET today with 110 shares. Sold a low delta covered call and added a CSP on the monthly a bit lower. I believe this will be the range of interest here. I wanted to slowly diversify a bit away from small caps as I have made a lot on the risk account the last two years. Arista is heavily positioned to benefit from energy, cloud, and Ai expansion and it has some of the best growth financials I have ever seen.
My plan:
Repeat covered calls at a lower delta to capture share appreciation.
Buy 100 more shares if it gets closer to 100 and continue to sell CSP