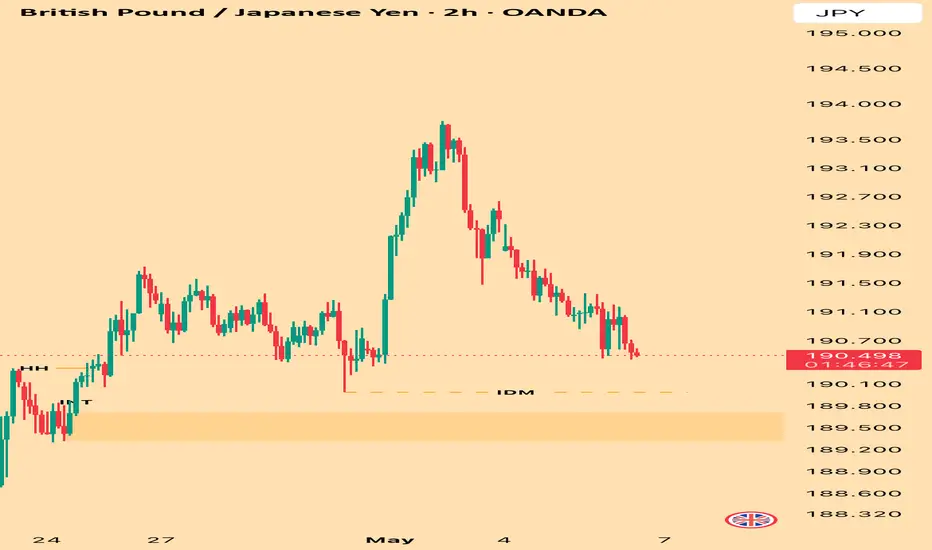
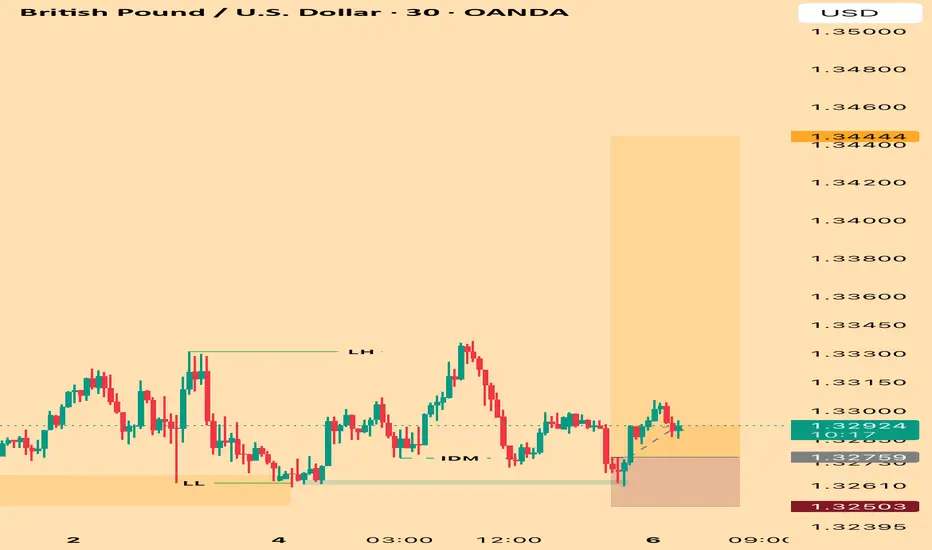
“GJ | Bullish Playbook in Motion — Waiting for the Draw“30M broke to the upside — same bullish intent showing as UJ. Now it’s all about the setup. Waiting for that IDM/liquidity sweep to the downside before taking action. 5M CHoCH will confirm the move. Let price do the hard work — I’m just the trigger.”
Bless Trading!
Pivot Points
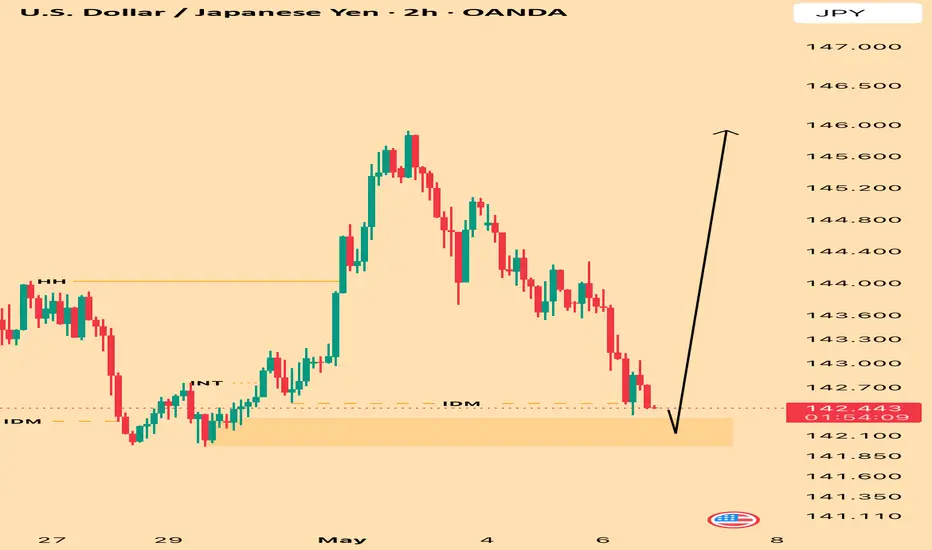
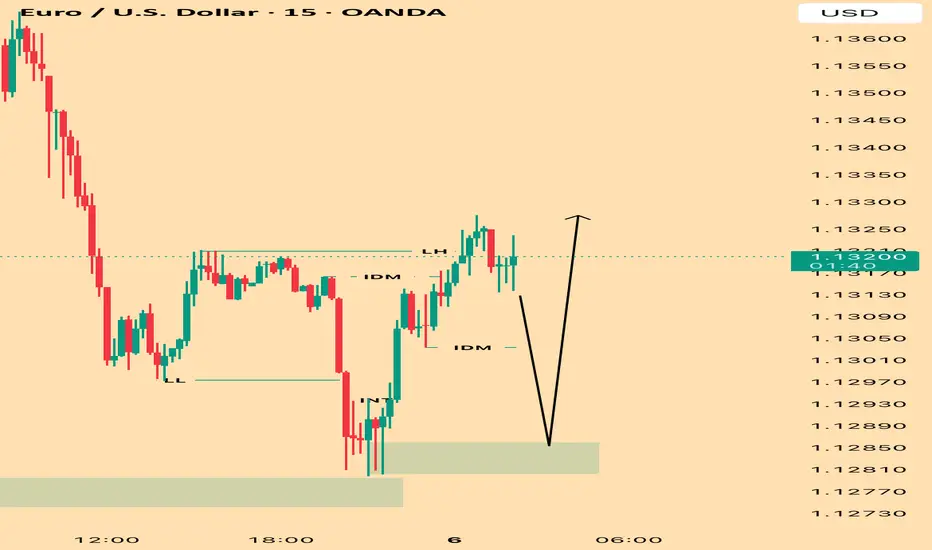
“UJ | Bullish Intent Locked — Patience Before Precision”“30M just broke structure to the upside — clear bullish intent after sweeping previous highs. Now I’m waiting patiently for price to take out liquidity/IDM to the downside. Once that clears, I’m striking on the 5M CHoCH for the entry. No rush — just precision.”
Bless Trading!
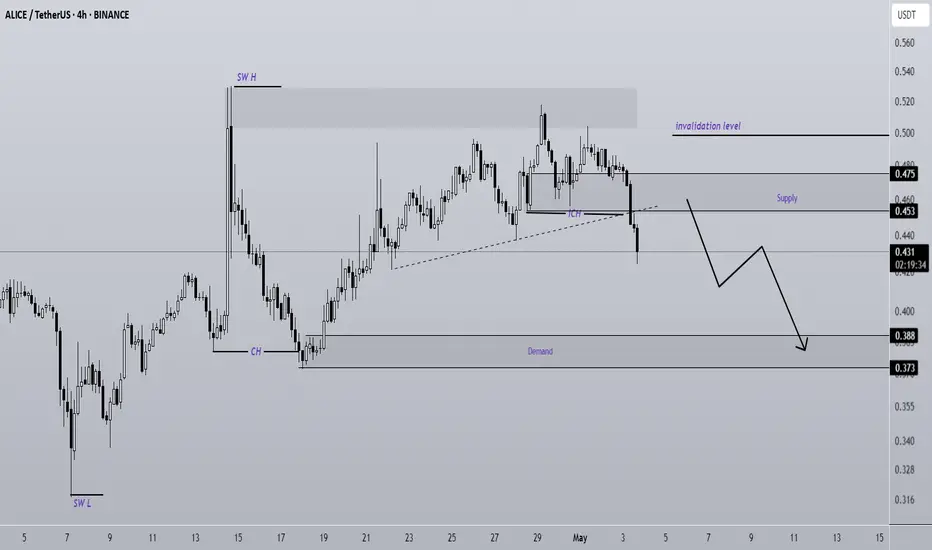
ALICE Looks Bearish (4H)The ALICE structure is bearish. It has been rejected from premium zones and a bearish internal CHoCH has also formed.
A move from the identified supply zone toward the demand zone is expected.
A daily candle close above the invalidation level would invalidate this analysis.
Do not enter the position without capital management and stop setting
Comment if you have any questions
thank you
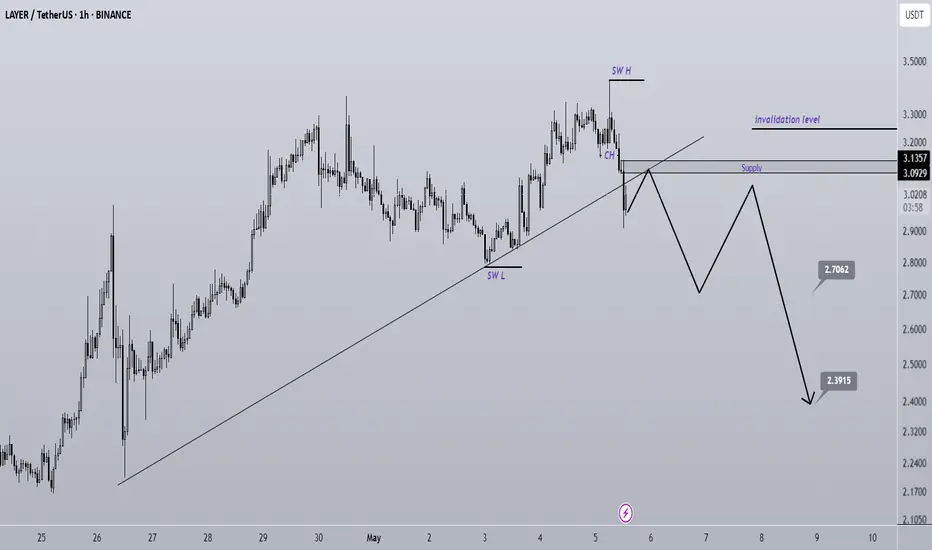
Be careful with LAYER (8H)A key trendline on the LAYER chart has been lost.
Due to this break in structure, the price may gradually move toward the identified targets.
Additionally, there is a bearish CH (Change of Character) on the chart.
The targets are clearly marked.
A daily candle closing above the invalidation level will invalidate this analysis.
Do not enter the position without capital management and stop setting
Comment if you have any questions
thank you
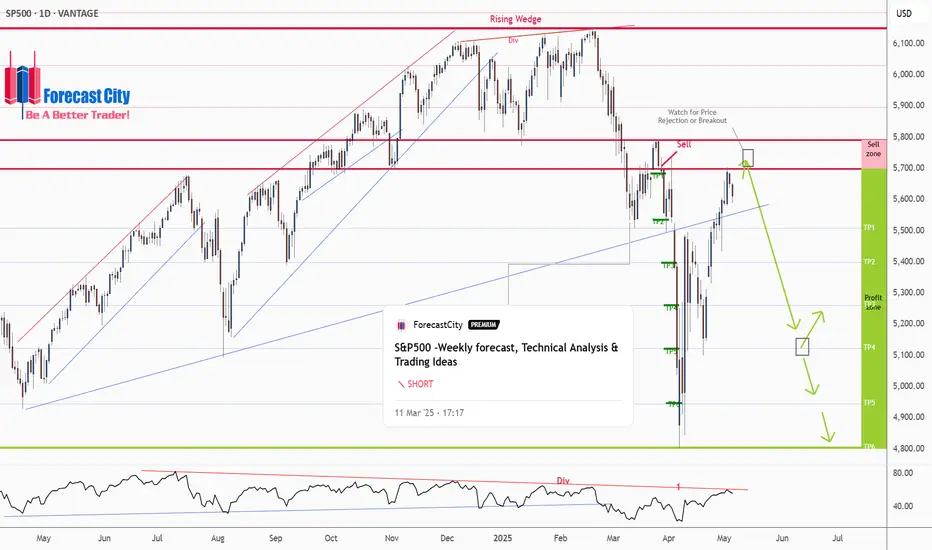
S&P500 -Weekly forecast, Technical Analysis & Trading IdeasPrevious forecast result:
As you can see in the 4CastMachine forecast on 12/03/2025, the price, after rejecting the sell zone, began its sharp decline and touched all TPs.
Midterm forecast:
While the price is below the resistance 6149.57, resumption of downtrend is expected.
We make sure when the support at 4804.01 breaks.
If the resistance at 6149.57 is broken, the short-term forecast -resumption of downtrend- will be invalid. CSEMA:S&P
Technical analysis:
While the RSI downtrend #1 is not broken, bearish wave in price would continue.
A trough is formed in daily chart at 4807.10 on 04/07/2025, so more gains to resistance(s) 5698.65, 5791.00, 5896.50 and maximum to Major Resistance (6149.57) is expected.
Price is above WEMA21, if price drops more, this line can act as dynamic support against more losses.
Relative strength index (RSI) is 55.
Take Profits:
5509.32
5363.90
5261.00
5122.47
4944.41
4804.01
__________________________________________________________________
❤️ If you find this helpful and want more FREE forecasts in TradingView,
. . . . . . . . Hit the 'BOOST' button 👍
. . . . . . . . . . . Drop some feedback in the comments below! (e.g., What did you find most useful? How can we improve?)
🙏 Your support is appreciated!
Now, it's your turn!
Be sure to leave a comment; let us know how you see this opportunity and forecast.
Have a successful week,
ForecastCity Support Team
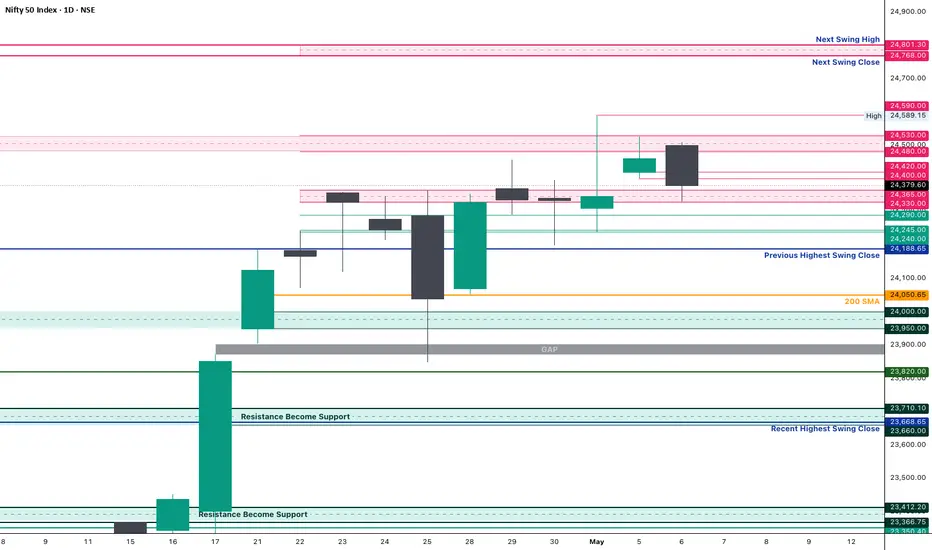
Nifty Analysis EOD - May 6, 2025 - Tuesday🟢Nifty Analysis EOD - May 6, 2025 - Tuesday 🔴
📌 Opening Mood:
A deceptive start near resistance—buyers had a moment, but bears owned the day.
📊 Nifty Summary:
Nifty opened at 24,509, precisely at the psychological and structural resistance zone. The first candle itself (O=H) reflected immediate selling pressure, and the index slid quickly, dropping 140+ points in the first hour. It tested the support zone around 24,330 ~ 24,365, which had earlier acted as resistance—a polarity zone now holding as support.
Despite multiple attempts, Nifty couldn’t break back above the upper consolidation band (around 24,400–24,410). For most of the day, it traded in a tight 40–50 point range and eventually settled near the lower end of that range at 24,379.60, while intraday close came in at 24,331.80.
⏱ Intraday Walk (5-min Time Frame Highlights):
🔻 First hour: Quick 140-point drop straight into support
🔄 10:30 AM–2:50 PM: Multiple bounce-back attempts failed at 24,400 and 24350
🧊 3:00 PM–3:30 PM: High volatility zone, test both sides of the range and the day ends with a new low.
🔒 Close: Near day’s low—weak handoff for next session
🧭 Daily Candle Breakdown
📌 Today’s Candle Type: Strong Bearish Candle
📖 Know How of Candle Type:
This candle type signals strong seller dominance. The real body is wide with almost no upper wick, implying bears controlled the day from start to end. Appears frequently after a failed attempt to break resistance.
📌 Today’s OHLC:
Open: 24,500.75
High: 24,509.65
Low: 24,331.80
Close: 24,379.60
Change: –81.55 (–0.33%)
📐 Candle Structure:
🔹 Real Body: 121.15 points → Strong Red Body (Bearish Control)
🔹 Upper Wick: 8.90 points → No meaningful buying (Daily TF, Intraday No Wick)
🔹 Lower Wick: 47.80 points → Slight pullback, but bears still dominate(Daily TF)
📌 Interpretation:
Bears were in control from the opening tick
The candle sits near the bottom of the day’s range
Comes after a bullish candle at resistance → Potential short-term reversal signal
Watch for confirmation below 24,330 to trigger an extended downside
⚔️ Gladiator Strategy Update
📌 Strategy Parameters:
ATR: 290.90
IB Range: 129.85
IB Category: Medium IB
Market Structure: Balanced
📌 Trade Highlights:
🔹 Trade Count: 1
✅ Long Trigger @ 11:25 AM → Minor profit as Trade Time Exit Trigger
🔮 What’s Next?
🟥 Short bias: Only below 24,330 with conviction
🟩 Long bias: Only if the price crosses and sustains above 24,460 ~ 24,490
⚠️ Between these levels: Avoid directional bets. Look for scalping setups only.
🔍 Support & Resistance Levels
📌 Resistance Zones:
24,400 ~ 24,420 (Immediate hurdle)
24,480 ~ 24,530 (Key zone with 24,500 psychological level)
24,590
24760~24,800
📌 Support Zones:
24,365 ~ 24,330 (Immediate support)
24,290
24,245 ~ 24,240
24,188
24,050
24,000 ~ 23,950
23,820
23,710 ~ 23,660
🧠 Final Thoughts
"In tight ranges, patience is not just a virtue—it’s a strategy. Let the levels do the talking."
✏️ Disclaimer
This is just my personal viewpoint. Always consult your financial advisor before taking any action.
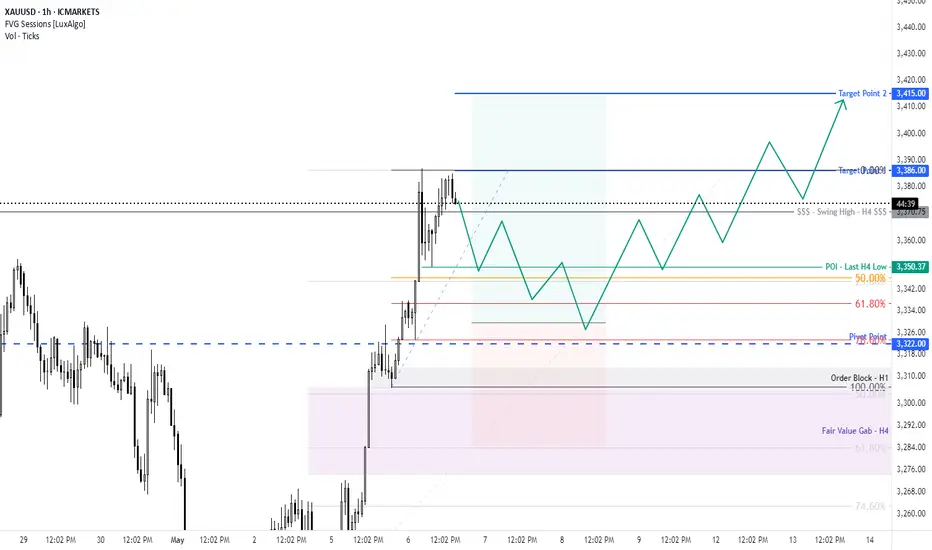
XAU/USD For Bullishyou can take small short position now to entry point
or
wait for pull-back near by entry point to go long
general trend is up trend
have fun :)
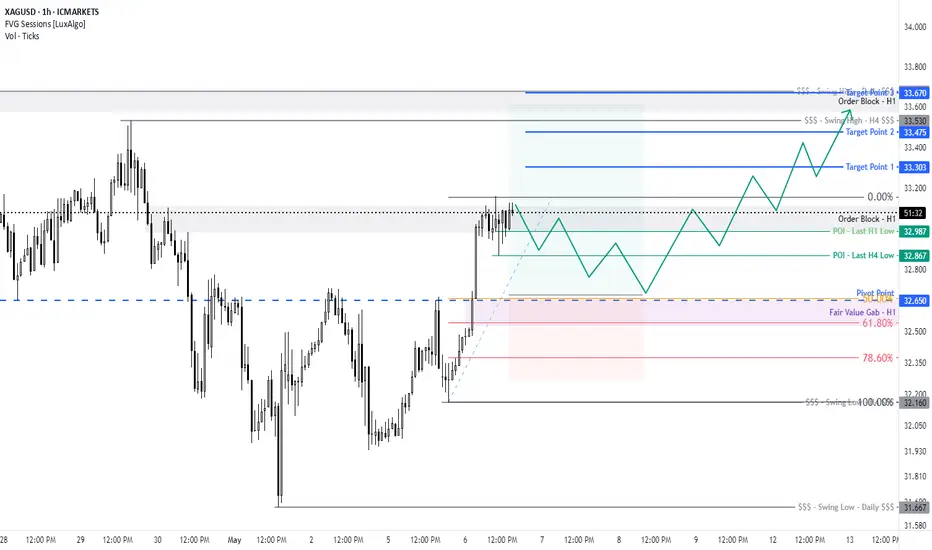
XAG/USD For Bullishwait for pull-back near by entry point and then go long
general trend is up trend
General rule: buy at the bottom
have fun :)
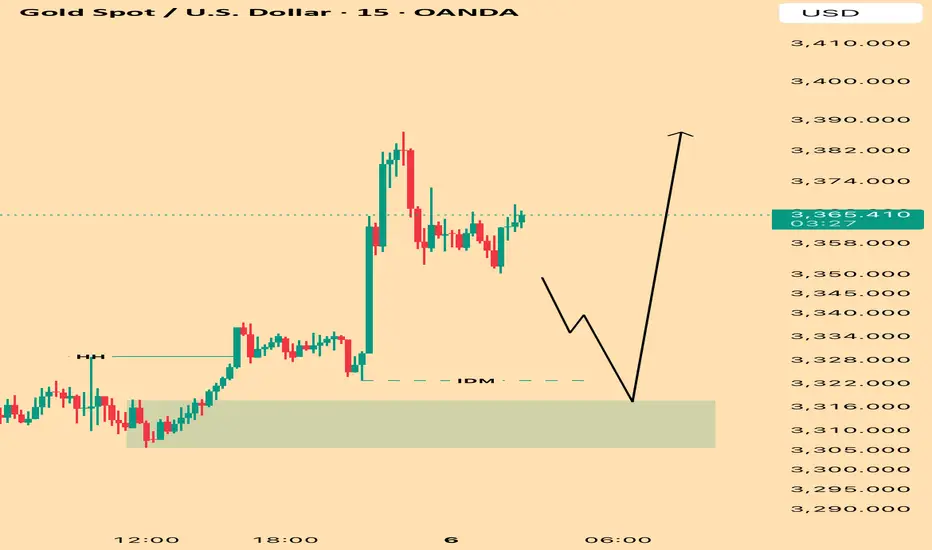
XAUUSD – The Setup’s Already BreathingFlipped to the 15M so they don’t see the precision… but this is 5M business.
IDM below that HH is baiting price back in—liquidity needs to get swept.
Once the zone’s kissed, I’m hunting the micro LH to get smoked.
The move’s already loaded… just waiting on the trigger.
They watching. I’m waiting. That’s the difference.
Bless Trading!
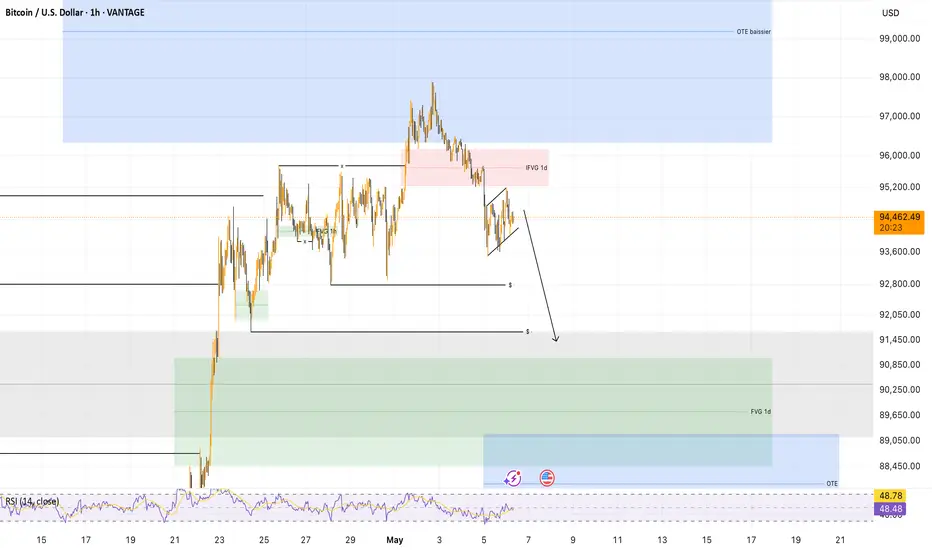
Bitcoin (BTC/USD) Analysis – 1H
🏛 1. Current Market Structure
📉 Price is currently moving within a small ascending channel after rejecting the red zone (IFVG 1D), but this move might be a bear trap.
⚠️ A downside breakout is likely, aiming to sweep liquidity lower.
🌍 2. Bigger Picture Outlook
🔍 The market could drop toward the grey support zone (below $91,500) before a potential bullish recovery.
📅 Overall structure remains dependent on a key macro catalyst, particularly Jerome Powell's upcoming speech.
🔍 3. Key Technical Observations
🟥 IFVG 1D: Clean rejection from this zone, increasing selling pressure.
📉 Suspicious ascending channel: Often a corrective pattern before continuation downward.
🟩 FVG 1D below: A potential liquidity zone, likely to trigger a reaction if tested.
🎯 4. Short-Term Expectations
📉 Favored bearish scenario:
Channel breakdown
Liquidity sweep
Retest of the grey support area (~$91,000)
📈 Bullish reaction possible afterwards, depending on how price behaves at support and macro conditions.
🔥 5. Upcoming Catalysts
🕰 Powell’s speech on Wednesday: Highly anticipated by the market.
💸 A rate cut could support BTC, but short-term uncertainty keeps pressure on price.
🔎 Until then, expect high volatility as the market seeks clarity.
✅ Conclusion
👉 Current price action suggests a bear trap with a likely liquidity grab to the downside.
📍 Key levels to watch:
Grey support zone (~$91,000)
Green FVG 1D (~$89,000)
Market reaction post-FOMC
⏳ Until the FED decision, the market remains fragile and liquidity-driven.
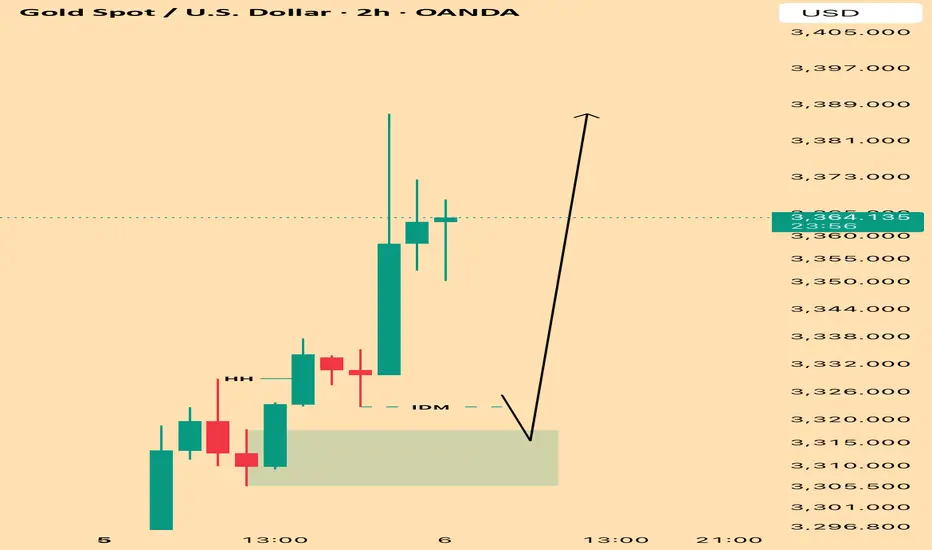
XAUUSD – Calm Before the LaunchMarked this IDM sitting under the HH with clean structure flowing bullish on 4H and 30M.
Flipped to the 2H for a smooth Bird’s Eye view—just watching now, waiting for that sweep and micro shift to load up.
The market’s breathing, building up energy. Once it taps in and confirms, it’s game time.
Let the liquidity do the work. I’ll handle the entry.
Bless Trading!
GU Long – Clean CHoCH Flip Off 30M OBCaught the buy after price tapped into a clean 30M order block—sat back and waited for that CHoCH flip to confirm the bulls were stepping in.
Didn’t force the entry. Let the structure shift, watched the reaction, then locked in.
Now holding toward the highs with full control—trade’s in motion and I’m just managing the play.
Patience > impulse. Let the market tell you when it’s ready.
Bless Trading!
EU – Sniper Precision Off the 5M OBMarked my 5M order block off the last sell candle before the internal break of structure. Price showed bullish reaction early, but I didn’t flinch—no need to chase or expand the zone.
Skipped the 10M OB, stayed patient, and let price build the narrative:
• CHoCH forming
• Liquidity sweep in motion
• IDM cooking
Now I’m posted, waiting for price to tap into my 5M OB and flip with a micro LH for the entry.
No guessing. No rushing. Just letting the market come to me.
Bless Trading!
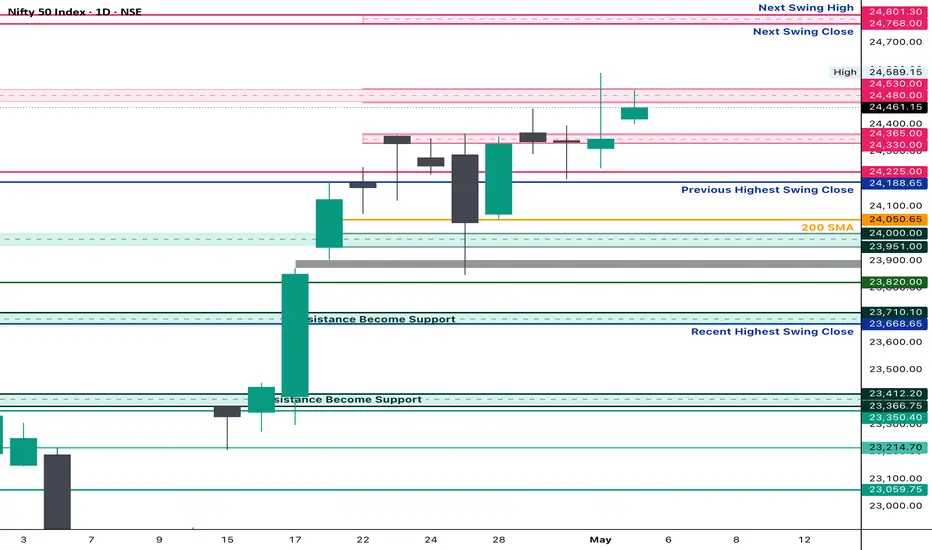
Nifty EOD Analysis – May 3, 2025 Monday🟢 Nifty EOD Analysis – May 3, 2025 Monday🔴
A positive open... but no follow-through. Still stuck in consolidation.
📊 Nifty Summary
Nifty opened with a gap up of 72 points at 24,420, marking the first open above 24,365 in the last 7 sessions — a positive sign. However, the enthusiasm lacked momentum. Price struggled to cross the resistance at 24,526, and the index drifted back toward the mean, trading the entire day between the initial balance (IB) range and hovering around VWAP.
🔹 Intraday Movement: Just 125 points, the smallest in the last 12 sessions — a clear sign of contraction.
🔹 Closing: 24461 closing is the first closing above 24365 in the last 7 sessions.
🔹 Structure: Daily candle formed an Inside Bar, signaling potential energy buildup.
📌 Strategy Forward: Stay alert for an expansion move from this coil — contraction often precedes sharp action.
📌 5 Min Time FrameChart
📌 Daily Time FrameChart
🕯️ Daily Time Frame Chart & Candle Breakdown
🔍 Today’s Candle Type: Spinning Top with a long upper wick
Candle Definition:
A Spinning Top reflects market indecision — both bulls and bears attempted moves, but neither gained dominance. A long upper wick with a narrow body often signals failed bullish momentum or fading enthusiasm.
📌 Today’s OHLC:
Open: 24,419.50
High: 24,526.40
Low: 24,400.65
Close: 24,461.15
Change: +114.45 (+0.47%)
🧱 Candle Structure:
🔹 Real Body:
🟢 Green candle with a modest body →
24,461.15 – 24,419.50 = 41.65 pts
🔹 Upper Wick:
24,526.40 – 24,461.15 = 65.25 pts
🔹 Lower Wick:
24,419.50 – 24,400.65 = 18.85 pts
📖 Candle’s Interpretation:
Despite a strong open and attempt to push higher, the resistance at 24,526 capped the move. The long upper wick shows that buyers lacked follow-through strength, and the close back near the middle of the range indicates a market still stuck in balance.
📉 The Inside Bar + Narrow Range combo is a potential signal for volatility ahead — traders should watch closely for a breakout from this range.
⚔️ Gladiator Strategy Update
📊 Strategy Parameters:
ATR: 303.46
IB Range: 110.65 pts
IB Category: Medium IB
Market Structure: Balanced
📌 Trade Highlights:
Trade Count: 0
❌ No Trigger generated by the system — a no-trade day.
🧠 Note: In contraction phases, it’s common to get fewer setups. Patience is key.
🔮 What’s Next?
Markets are coiling tightly, and an expansion move is likely around the corner. As long as price holds above the 24,330–24,360 band, bulls have hope — but conviction is needed above 24,540.
🧱 Support & Resistance Levels
🔺 Resistance Zones:
24,480 ~ 24,540 (Includes psychological level: 24,500)
24,590 (PDH – Immediate hurdle)
24,800
🔻 Support Zones:
24,400 (CDL)
24,330 ~ 24,360
24,190 ~ 24,225 (Immediate Support)
24,120
24,050
24,000 ~ 23,950
23,820
23,710 ~ 23,660
23,500
23,410 ~ 23,370
23,215
✏️ Disclaimer
This is just my personal viewpoint. Always consult your financial advisor before taking any action.
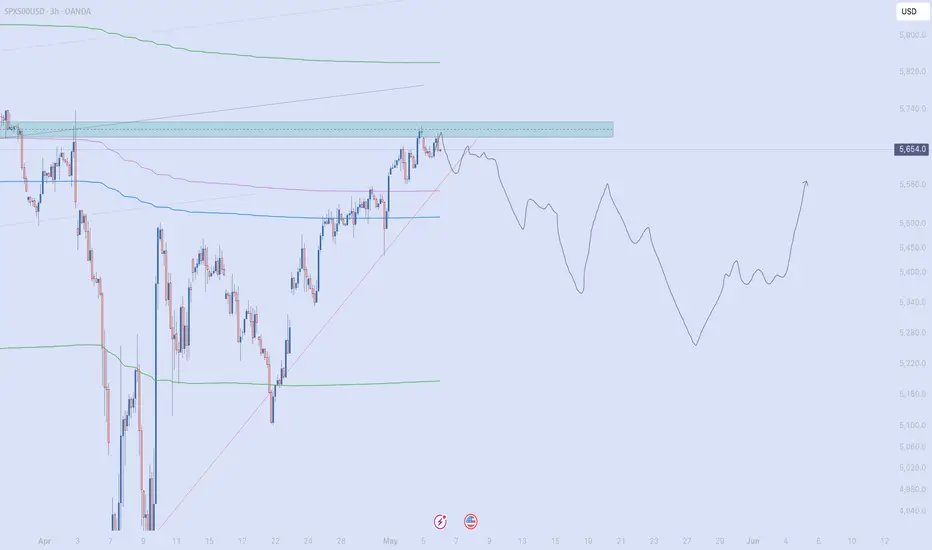
Little Rest For SPXI think the SPX structure is more prone to bearishness. There is a structure that will probably move quickly in one direction. I don't think a good structure has been formed for a bottom. And the rise does not seem very strong. For this reason, I expect an increase after the first fall.
Since this situation will probably reflect on crypto, my bearish contracts are still in place. But I am thinking of buying a bullish contract until the FOMC time.
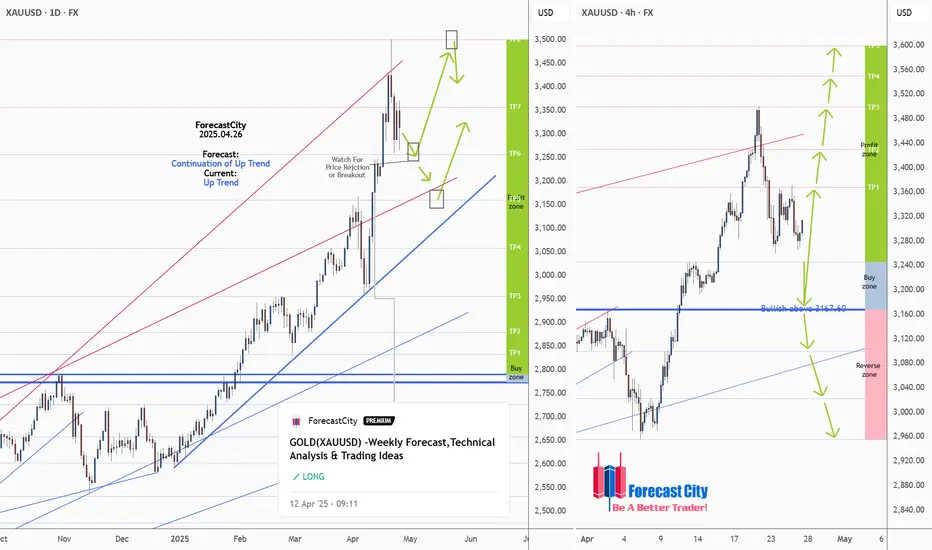
GOLD(XAUUSD) -Weekly Forecast,Technical Analysis & Trading IdeasMidterm forecast:
2772.38 is a major support, while this level is not broken, the Midterm wave will be uptrend.
TVC:GOLD OANDA:XAUUSD
Technical analysis:
A trough is formed in daily chart at 2956.50 on 04/07/2025, so more gains to resistance(s) 3357.00, 3500.00 and more heights is expected.
Take Profits:
2833.00
2879.11
2955.00
3057.40
3160.00
3257.03
3357.00
3500.00
__________________________________________________________________
❤️ If you find this helpful and want more FREE forecasts in TradingView,
. . . . . . . . Hit the 'BOOST' button 👍
. . . . . . . . . . . Drop some feedback in the comments below! (e.g., What did you find most useful? How can we improve?)
🙏 Your support is appreciated!
Now, it's your turn!
Be sure to leave a comment; let us know how you see this opportunity and forecast.
Have a successful week,
ForecastCity Support Team