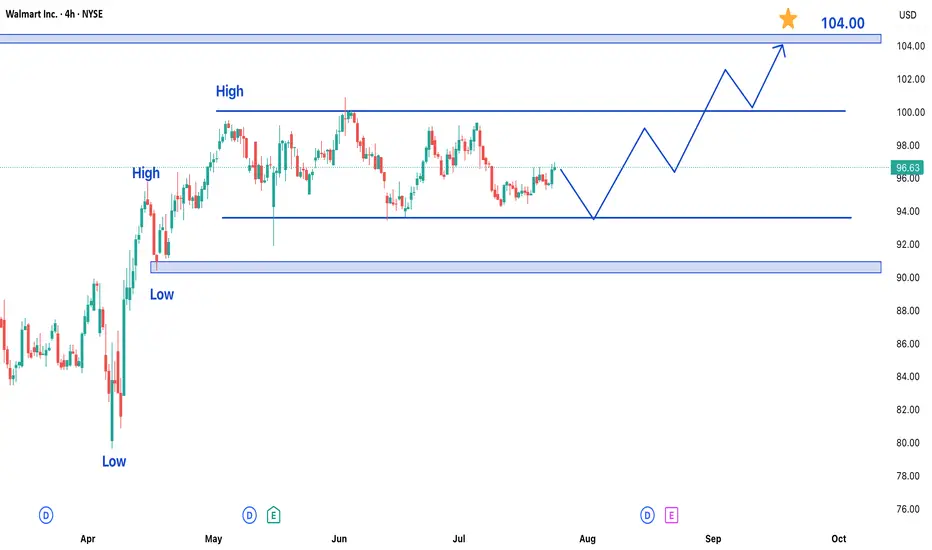
Walmart Stock Trading in Bullish Trend – Upside Potential AheadWalmart Inc. (WMT) shares are currently exhibiting a bullish trend, maintaining upward momentum over recent trading sessions. While the stock has been consolidating in a range over the past few days, the broader outlook remains positive, suggesting potential for further gains in upcoming sessions.
Key Observations:
- Established Uptrend: Walmart's price action reflects sustained buying interest, keeping the stock in a bullish phase.
- Range-Bound Consolidation: Recent sideways movement indicates a temporary pause, often a precursor to the next directional move.
- Strong Support & Resistance Levels: The stock has formed clear reference points for traders to watch.
Price Projections:
- Upside Target at $105: A breakout above the current range could propel WMT toward the $105 resistance level, representing a significant upside opportunity.
- Key Support at $90: On the downside, the $90 level has emerged as a strong support zone. Any pullback is likely to find buying interest near this area.
Market Implications:
1. Bullish Continuation Likely: The consolidation within an uptrend typically resolves in the direction of the prevailing trend—in this case, upward.
2. Breakout Potential: A decisive move above the recent range high could accelerate buying momentum toward $105.
3. Risk Management Consideration: While the bias is bullish, a drop below $90 would signal weakening momentum and potentially invalidate the near-term upside scenario.
Trading Strategy:
- Entry: Consider long positions on a confirmed breakout above the range, or on dips near $90 support.
- Stop Loss: A close below $90 would suggest a trend reversal, warranting exit from bullish positions.
- Target: $105 serves as the primary upside objective, with interim resistance levels to monitor along the way.
Final Thoughts:
Walmart’s stock appears poised for further gains, with $105 as the next key target. Traders should watch for a breakout from the current range while keeping an eye on the $90 support level for risk management. As always, confirmation through price action and volume will be crucial for validating the bullish thesis.
Pivot Points
Quick short on the pull back of EURUSDPrice touched a supply zone and formed a break of structure on the 1 hour. I may have missed the entry, but i placed a sell limit with a TP to the imbalance below.

XAUUSD Locked In| Waiting for 5M OB SparkPair: XAUUSD (Gold)
Bias: Bullish
Timeframes: 30M / 5M
Gold has followed structure beautifully — top-down alignment from 30M into 5M is clear. Price respected the 30M OB and showed intent, but now we’re approaching the moment of truth.
I’m watching the 5M OB for entry — this is where execution mode activates. No rush. I’m in analysis mode right now, but the shift is coming.
Entry zone is mapped, structure’s in place, order flow is aligned — all I need now is price to do what it always does: respect the blueprint.
Entry Zone: 5M OB
Target: 5M highs
Mindset Note: Patience before the spark. I don’t force entries — I wait for the market to hand me the move it already hinted at. ⚡️
Nasdaq Bullish Flow | 5M OB Execution PendingPair: NAS100
Bias: Bullish
Timeframes: 30M / 5M
Price remains heavy bullish — structure aligning perfectly across the board. Ever since the 30M OB was mitigated, I’ve been following Nasdaq’s order flow step-by-step.
I was watching for full-bodied confirmations inside the 30M zone, but instead, price gave clarity through the lower timeframes. That 5M flip gave away smart money’s intent — showing me exactly where accumulation is happening.
Now waiting for price to tap into the 5M OB to shift into execution mode. This setup has been mapped with precision — no guessing. Once entry presents itself, I’ll follow through.
Entry Zone: 5M OB
Target: 5M highs
Mindset Note: Still in analysis mode — patience until price hits my zone. Smart money doesn’t rush, it accumulates. So do I. 💼
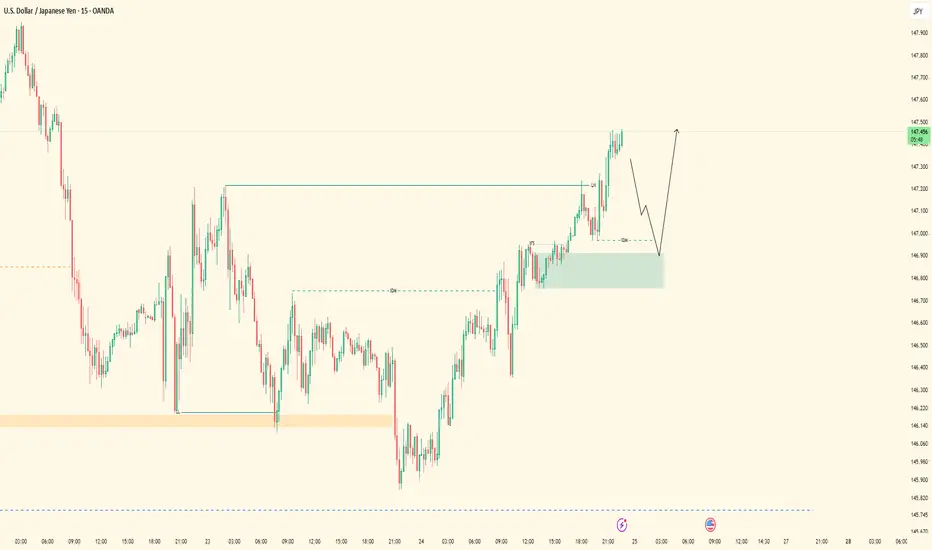
UJ Exexcution Flow| 5M OB Setup in MotionPair: USDJPY
Bias: Bullish
Timeframes: 30M / 5M
Top-down structure respected cleanly across the board — from HTF to LTF, price has been flowing exactly as forecasted. After confirming the bearish LH break and structure flip, we’re now in a bullish leg with intent clearly shown on the lower timeframes.
Currently waiting for price to mitigate the marked 5M order block for precise execution. Entry is valid and backed by structural logic — no guessing, just following what price has already confirmed.
Entry Zone: 5M OB (confirmed after LH break + LTF intent) Target: Clean 5M highs
Mindset Note: Analysis mode done. Execution mode engaged. I let price lead — I just follow structure.
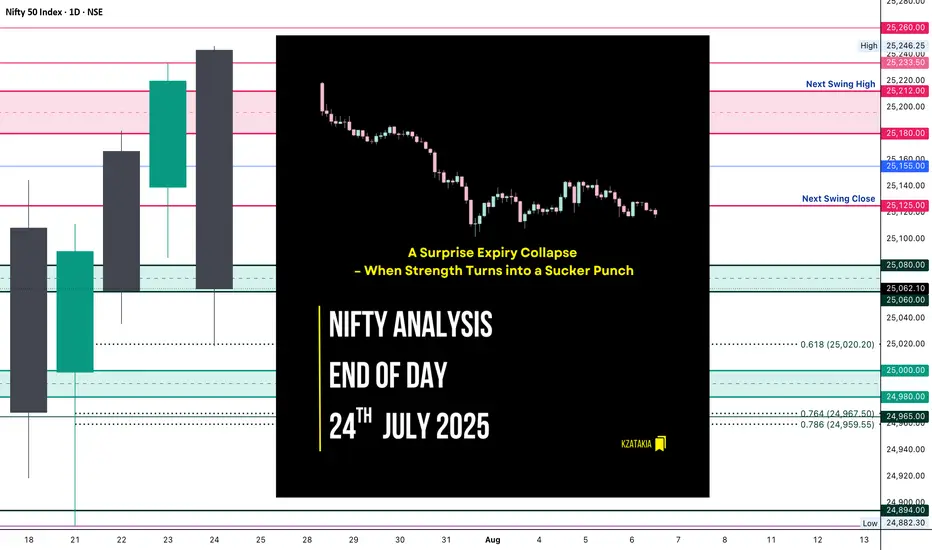
Nifty Analysis EOD – July 24, 2025 – Thursday 🟢 Nifty Analysis EOD – July 24, 2025 – Thursday 🔴
📉 A Surprise Expiry Collapse – When Strength Turns into a Sucker Punch
Today’s session was an unexpected twist.
Nifty opened above the previous day’s high, giving early hope to the bulls—but within the first hour, it slipped to 25,155 and formed its IB. What followed was a sharp 136-point fall, breaking not just yesterday’s low, but also the July 22nd low. This sudden bearish momentum was completely news-driven, and expiry-day long unwinding only added fuel to the fire.
Despite a strong close yesterday, today’s fall erased all of July 23rd’s gains and brought us right back to July 22nd’s close—neutralizing the recent upward effort.
The day closed at 25,062, marginally above key support. Technically, today’s low respected the 0.618 Fib retracement level drawn from July 21st’s low to July 23rd’s high—so a dead cat bounce is possible if no further bad news hits. But if we open below 25,050 tomorrow, expect more downside pressure toward 24,960–24,890 zones.
🕯 5 Min Time Frame Chart with Intraday Levels
🕯 Daily Time Frame Chart with Intraday Levels
🕯 Daily Candle Breakdown
Open: 25,243.30
High: 25,246.25
Low: 25,018.70
Close: 25,062.10
Change: −157.80 (−0.63%)
Candle Structure Analysis:
🔴 Body: Large red body (181.2 pts) shows strong intraday selling.
☁️ Upper Wick: Tiny (2.95 pts) → sellers dominated from the start.
🌊 Lower Wick: Moderate (43.4 pts) → small recovery near close.
Candle Type:
Almost a bearish Marubozu — clear domination by sellers with barely any upper shadow, signaling intense sell pressure.
Key Insight:
Bulls lost control after open.
Bears took charge below 25,155.
Close near support, but bias cautious.
Bulls must reclaim 25,150+ for recovery, else 25,000 may give way.
🛡 5 Min Intraday Chart
⚔️ Gladiator Strategy Update
ATR: 185.97
IB Range: 83.55 → Medium
Market Structure: Balanced
Trades Triggered:
⏰ 10:05 AM – Short Entry → SL Hit
⏰ 11:10 AM – Short Entry → Target Hit (1:3.6 Risk:Reward)
📊 Support & Resistance Levels
Resistance Zones:
25,125
25,155
25,180 ~ 25,212
25,233
Support Zones:
25,080 ~ 25,060
25,020
25,000 ~ 24,980
24,967 ~ 24,959
24,882
🔮 What’s Next?
A gap-up or stable open may trigger a dead cat bounce toward 25,150–25,180.
A gap-down below 25,050 confirms bearish continuation → next targets: 24,960 / 24,890.
Watch price action around the 25,020–25,060 zone closely.
🧠 Final Thoughts
“Markets are never wrong – opinions often are.”
— Jesse Livermore
Today was a reminder of how expiry day surprises and news flows can flip the narrative. Stay flexible, and keep a bias—but not a blind one.
✏️ Disclaimer
This is just my personal viewpoint. Always consult your financial advisor before taking any action.
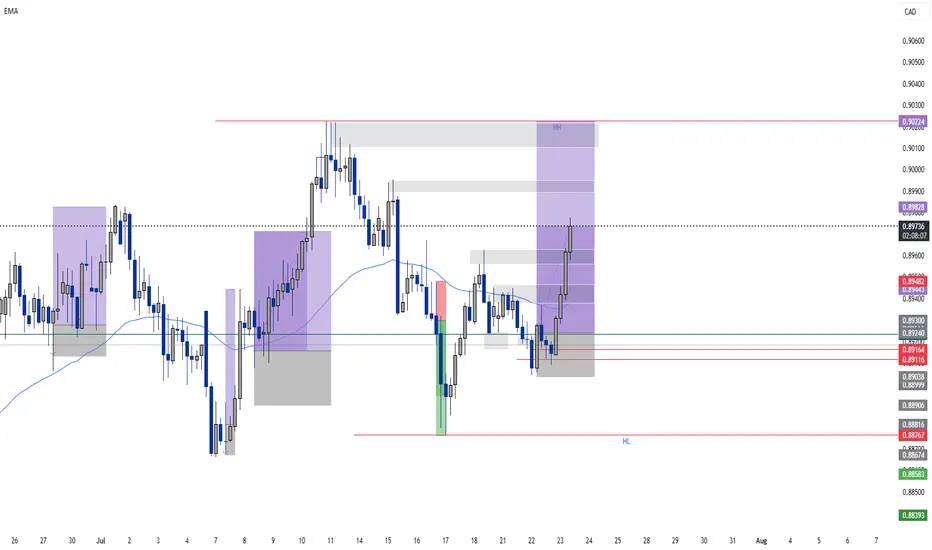
AUDCAD Bullish Setup – 15min Structure Shift1. Price was trading at a discount in the context of a higher time frame bullish trend (HHs and HLs).
2. On the 15-minute chart, price attempted to break a previous lower low but failed — signaling potential exhaustion in bearish pressure.
3. This failure to break structure on the 15 min suggested sell-side liquidity was absorbed, and smart money shifted direction.
4. Price then broke short-term 15-minute structure to the upside, indicating a bullish order flow shift.
5. A bullish retracement followed into an OB, offering a high-probability entry point before continuing higher.
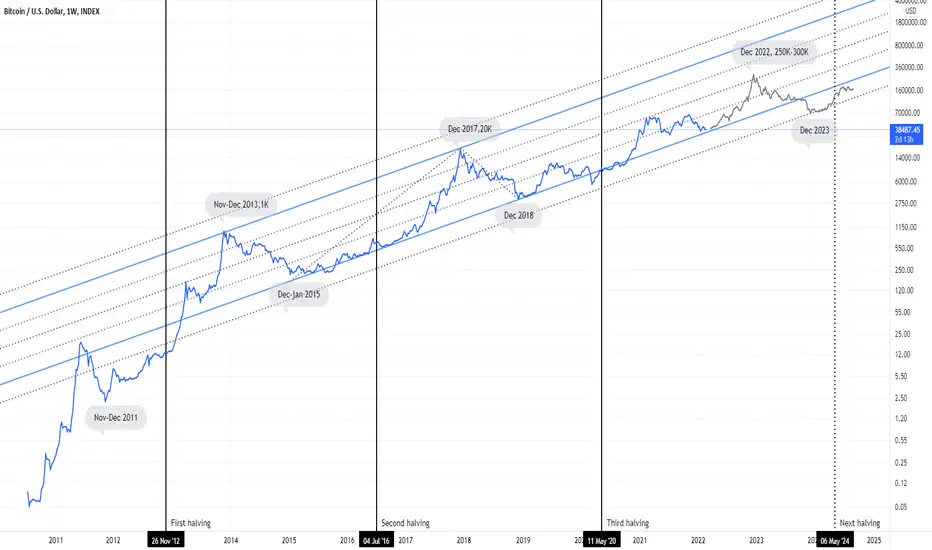
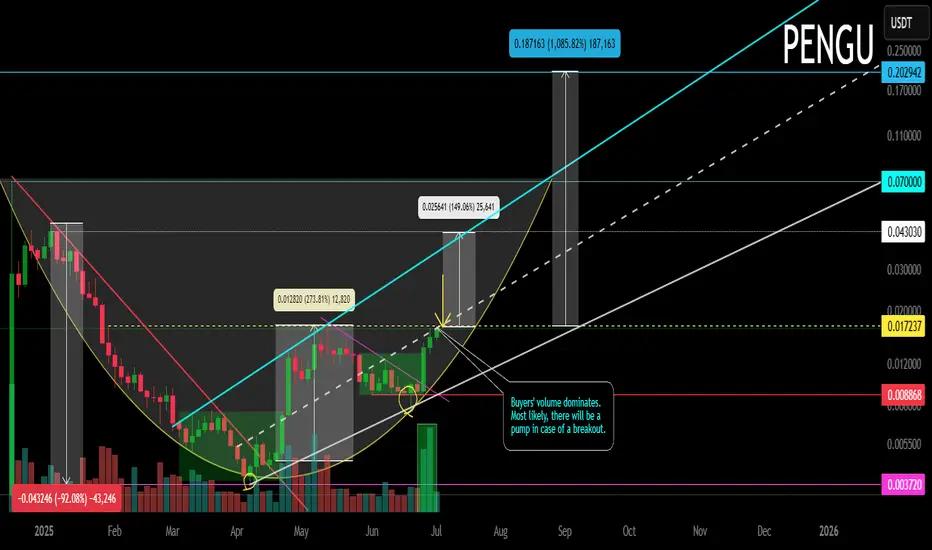
PENGU. Main trend. Trend reversal zone. 04 07 2025Logarithm. Main trend. Fresh cryptocurrency, which is being driven into hype.
Locally now. Price at the median of the bowl.
Buyer volume dominates. Most likely, there will be a large pump in case of a breakout.
The chart is somewhat reminiscent of the Bitcoin chart, the reversal zones of this secondary trend, after the first local wave of growth. The first local, significant target is shown.
There is a possibility of a helicopter, that is, to collect stops in both directions, and thereby dump passengers before a potential pump.
Such cryptocurrencies (low liquidity, monopoly over the price due to the concentration of cryptocurrency in “one hand”) at a good time "the hamster is not scared", will be pumped up conditionally, like Shiba Inu (SHIB), driving the hype (raising the price over and over again, and coming up with positive news) and 0.5 million Twitter subscribers (X). Medium-term — long-term level zones are shown on the chart.
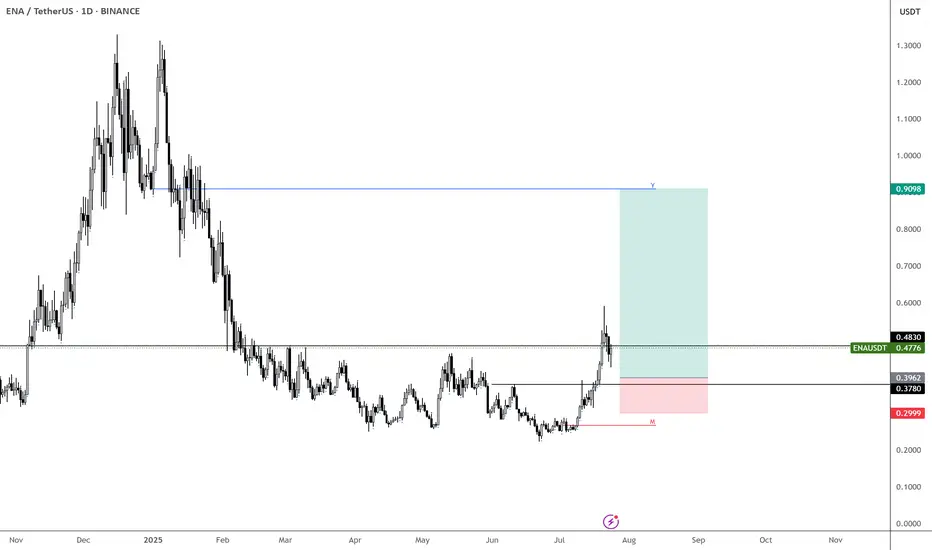
ENA – Sub-40c Would Be a Gift
If we get BINANCE:ENAUSDT below 40c, that would be an incredible opportunity.
Maybe I’m being too greedy—or maybe not. I’ll let the market decide.
Right now, ENA looks like a solid play for the coming weeks, so I’m focused on finding the best possible entry.
MARKETSCOM:ETHEREUM still looks strong overall. Even with a minor retrace, I’m expecting higher—potentially up to $7k.
So it makes sense to position in names like BINANCE:ENAUSDT , BINANCE:EIGENUSDT , BINANCE:AAVEUSDT , and others to ride the wave.
Awaiting entry, $TOSHIUSDT looks prime for a double top!Hard to gauge if we get a drop from here — but if we do, I’d love to see a ~20% flush into key support.
Not counting on it just yet, but the chart is coiled and primed for either direction. A potential 2x setup is on deck, so this one needs to be closely monitored given where it currently sits.
Two clear paths:
Flush into demand (my preferred entry)
Or a reclaim of the purple block to confirm continuation
⚠️ MEXC:TOSHIUSDT has strong technicals — keep it firmly on your watchlist.

Hyperliquid AI Trading Launches to Revolutionize Crypto in 2025The launch of Hyperliquid AI Trading marks a major milestone in the evolution of digital markets. Positioned as an AI-native, fully on-chain trading platform, Hyperliquid is designed to offer high-speed, adaptive, and transparent execution — directly competing with centralized exchanges in efficiency and intelligence.
Within its first week, Hyperliquid processed over $3.7 billion in trading volume, highlighting early market interest. It leverages a proprietary AI engine that integrates real-time sentiment analysis, macroeconomic signals, and on-chain data to continuously optimize trading decisions.
“Hyperliquid arrives at the intersection of AI maturity and DeFi demand,”
says Lina Torres, Senior Analyst at Valtrix Group.
Key Features
AI-Driven Order Execution: Predicts slippage and market impact to route trades efficiently.
Sentiment-Aware Strategy Engine: Adjusts trading logic based on financial news and social signals.
Fully On-Chain Infrastructure: Offers transparency and verifiability for institutional-grade trust.
Self-Learning Models: Improves performance through continuous feedback.
Strategic Context
2025 has seen accelerating DEX adoption and a surge in institutional interest in DeFi. With the rise of spot crypto ETFs and maturing regulations, the market is ready for intelligent, decentralized infrastructure.
Valtrix Group forecasts that platforms like Hyperliquid could capture 8–12% of total DEX volume by Q4 2025, driven by algorithmic and high-frequency trading firms seeking smarter execution layers.
“This is not just faster DeFi — it’s smarter DeFi,”
notes Mark Evans, Chief Strategist, Valtrix Group.
Conclusion
Hyperliquid AI Trading signals a new era in crypto: one where artificial intelligence is fully embedded into decentralized finance. Its launch may set a precedent for the next generation of algorithmic trading infrastructure — agile, data-driven, and fully transparent.

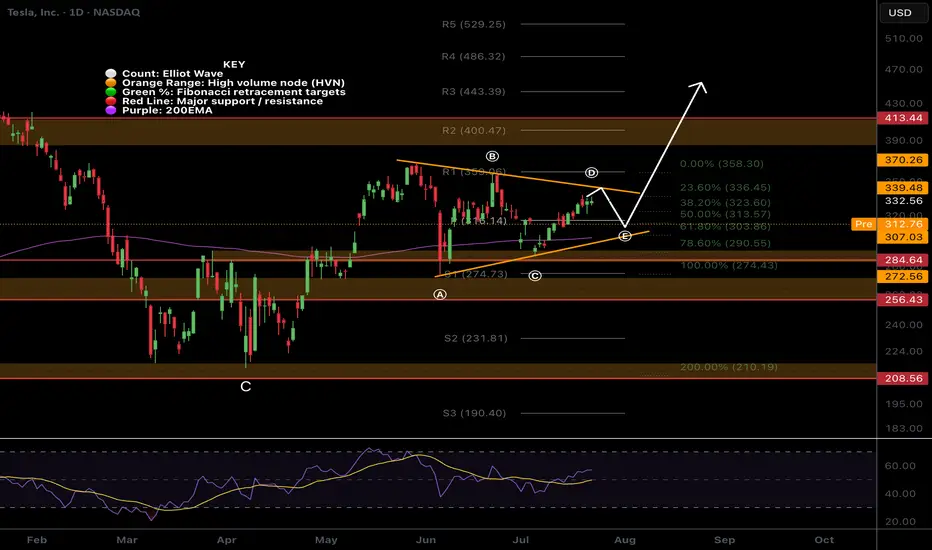
$TSLA Triangle?NASDAQ:TSLA triangle has presented itself with the recent price action. Triangle pattern target is $443 at the R3 daily pivot.
Wave e is expected to end at the daily pivot and wave d break is the signal to go long.
Analysis is invalidated below wave c.
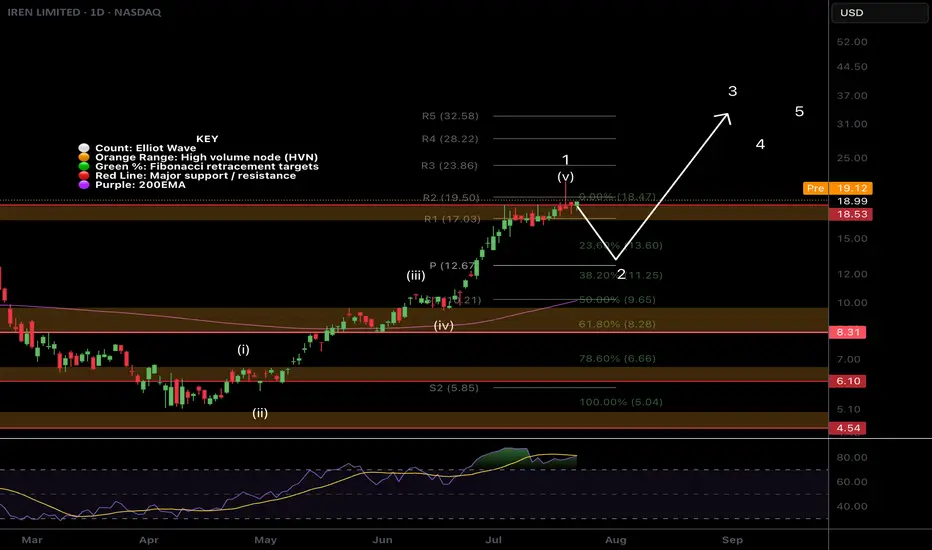
$IREN More downside after huge rally!NASDAQ:IREN is printing bearish divergence on the daily RSI at all tie high resistance.
An Elliot wave motif wave appears complete and wave looks underway with a shallow target of the daily pivot, 0.382 Fibonacci retracement and ascending daily 200EMA.
The daily red wick after printing a 20% start to the day is reminiscent of a blow off top in this asset trapping newbs with FOMO price discovery pump. Market behaviour in action!
Analysis is invalidated if price returns to all time high.
Safe trading
$FET local ending Diagonal and wave 2 near completion?NYSE:FET was rejected for the 4th time at the daily 200EMA! Each time the probability of a breakout increases.
I have adjusted the High Volume Nodes for accuracy.
Locally Fetch appears to have completed a motif wave up with an ending diagonal for wave 5. Wave 2 is expected to find support at the daily pivot and .618 Fibonacci retracement before attempting a breakout of the daily 200EMA once more.
A move below wave II will invalidate this analysis.
Safe trading
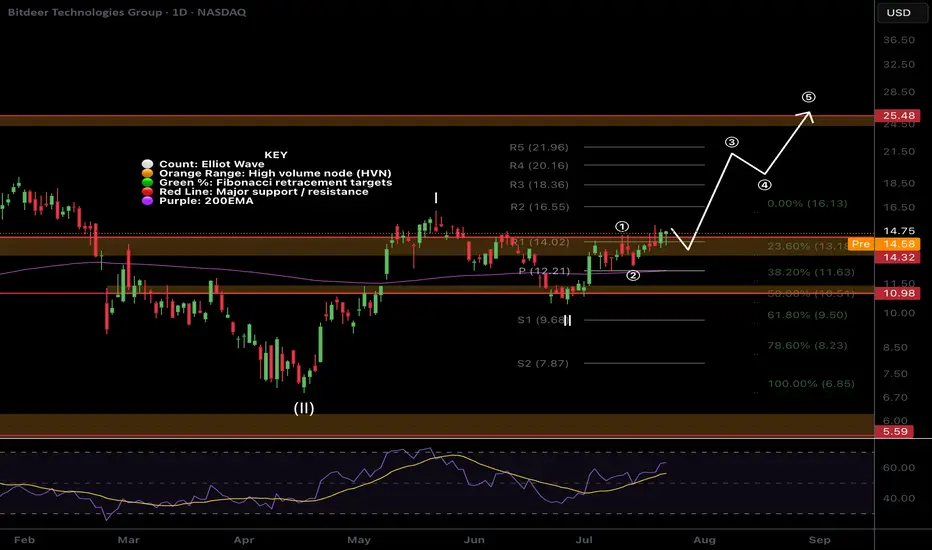
$BTDR Closed above resistance!NASDAQ:BTDR Bitdeer closed above major resistance yesterday, despite BTC and alt coins having a bearish day, triggering our long signal in the Weekly Trade signals substack.
I am looking for price to start to accelerate in wave 3 and resistance now support to hold. If BTC reverses it will add additional tailwinds with a target of the major resistance above the R5 daily pivot $24
Safe trading
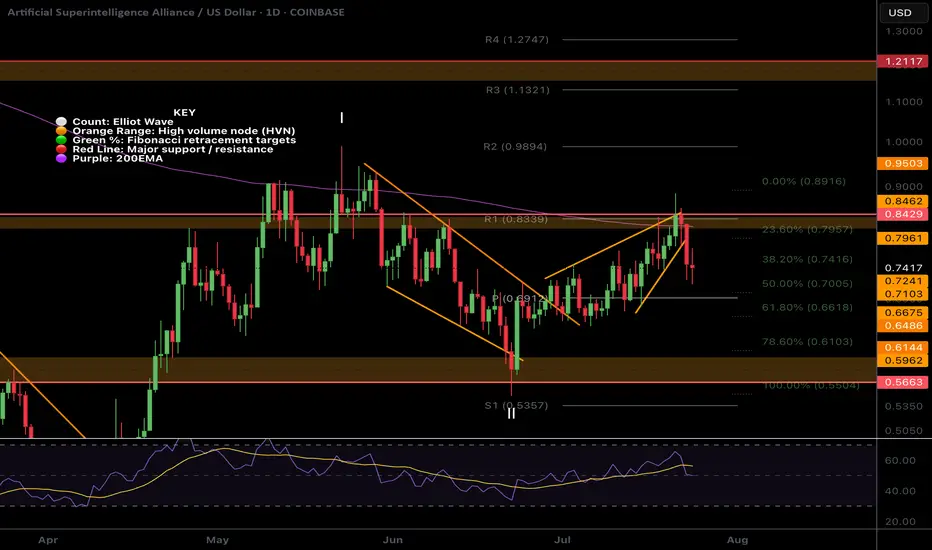
$AAVE Daily Hidden Bullish divergence?CRYPTOCAP:AAVE and alts begin their retracement Wednesday but is this a long term top or just local? Im betting we have a higher to go this summer..
Hidden daily bullish divergence is printing on RSI at the daily pivot and 0.5 Fibonacci retracement which should all act as strong support provided BTC doesn't dump.
The 'alt-coin golden pocket' Fibonacci retracement 0.786 sits at the descending daily 200EMA and High Volume Node support offering a secondary target for reversal and continued upside.
Losing this and closing below would flip me bearish until a new bullish signal emerges.
Safe trading.
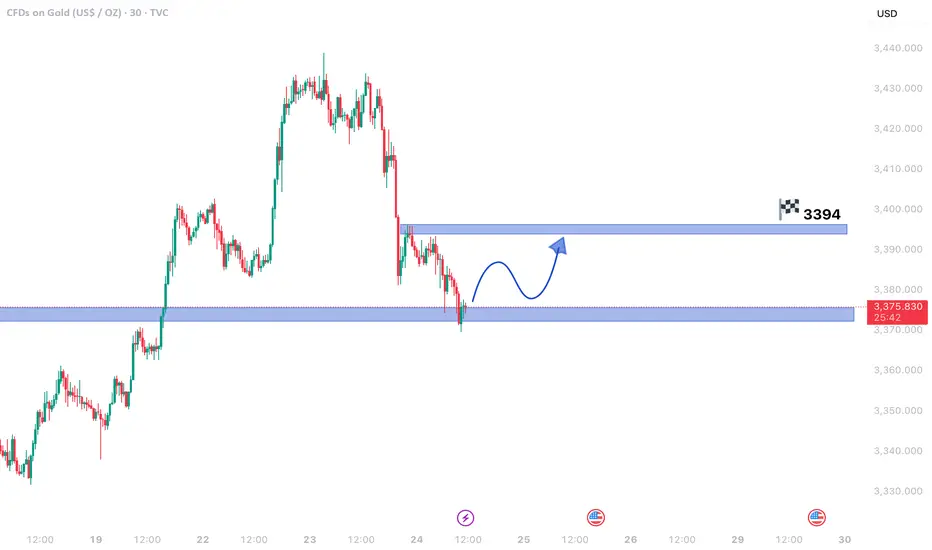
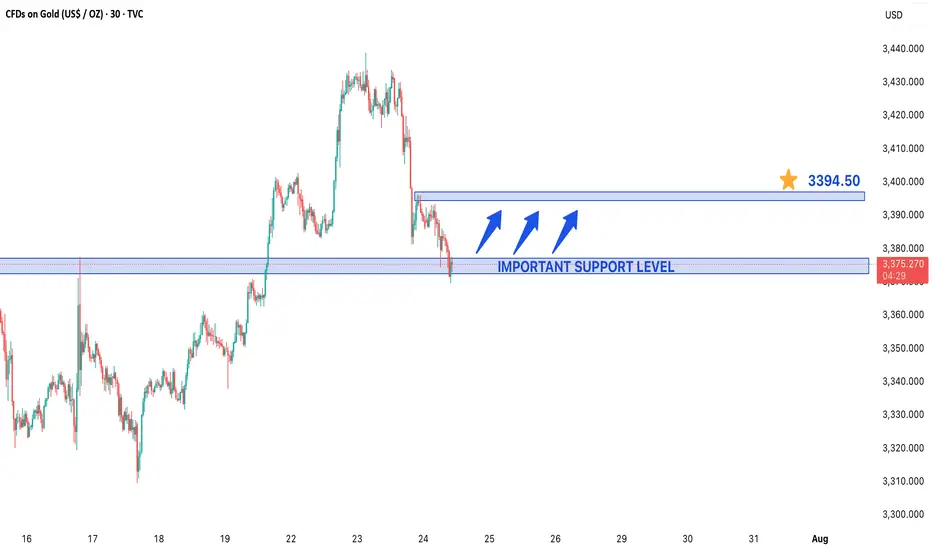
Gold Exhibiting Weak Bearish Momentum – Is a Rebound Imminent?Gold Exhibiting Weak Bearish Momentum – Is a Rebound Imminent?
The 30-minute chart reveals gold prices in a mild downtrend, but the sluggish decline hints at weakening bearish pressure. This could set the stage for a temporary price recovery before any further downward movement.
Critical Insights:
- Fading Bearish Strength: The downtrend persists, but its slowing pace suggests seller exhaustion.
- Key Support Zone: With prices hovering near a major support area, a bullish reversal becomes plausible.
- Upside Potential: A resurgence in buying momentum may propel gold toward 3,394.60, a significant resistance level.
Market Dynamics:
1. Possible Short-Term Reversal: Shallow bearish trends near support often precede upward corrections.
2. Bullish Opportunity: A breakout past nearby resistance could fuel a rally toward 3,394.60, creating a swing trade setup.
3. Downside Risk: If support fails, the bearish trend may extend, though weak selling pressure limits immediate declines.
Strategic Approach:
- Entry Consideration: Long positions near current support levels could capitalize on a rebound.
- Risk Management: A drop below support would negate the bullish outlook, warranting a stop loss.
- Confirmation Signals: Bullish candlestick formations or increasing volume would strengthen reversal prospects.
Concluding Thoughts:
Gold’s tepid bearish momentum near a crucial support level raises the likelihood of a short-term bounce. Traders should watch for confirmation—if the recovery gains traction, 3,394.60 may come into play. Conversely, a support breakdown could renew downward pressure.
GOLD IN A WEAK BEARISH MOVE IN 30M TIME FRAME CHARTGold in a Weak Bearish Move – Temporary Rebound Ahead?
Gold prices are currently displaying a weak bearish momentum on the 30-minute chart, suggesting that the downtrend may be losing steam. Despite the downward movement, the sluggish pace indicates that sellers lack strong conviction, which could lead to a short-term price recovery before any further decline.
Key Observations:
- Weak Bearish Trend: The price is falling, but with decreasing momentum, often a sign of exhaustion among sellers.
- Critical Support Level: Gold is trading near a major support zone, where buying interest could emerge, triggering a bounce.
- Potential Rebound Target: If buyers step in, the price could rise toward 3,394.60, a key resistance level.
Market Implications:
1. Short-Term Reversal Likely: Weak bearish moves often precede temporary rallies, especially near strong support levels.
2. Bullish Scenario: A breakout above immediate resistance could push gold toward 3,394.60, offering a swing trading opportunity.
3. Bearish Continuation Risk: If support breaks, the downtrend may resume, but the current lack of strong selling pressure reduces immediate downside risks.
Trading Strategy:
- Buying Opportunity: Traders might consider long positions near support, targeting 3,394.60.
- Stop Loss: A break below the current support level would invalidate the rebound setup.
- Confirmation Needed: Watch for bullish candlestick patterns or rising volume to confirm the reversal.
Final Thoughts:
While gold remains in a short-term bearish phase, the weak downside momentum and proximity to support suggest a possible pullback. Traders should monitor price action closely—if the rebound holds, 3,394.60 could be the next target. However, a failure to hold support may extend the decline.
*Disclaimer: This analysis is for informational purposes only. Trade with proper risk management.*
NASDAQ100| - Bullish Bias RemainsPrice didn’t give me the deep candle retrace into my 30M OB — just a wick tap — but that was enough. That wick shows me smart money touched in.
Dropped to the LTF and got my shift in structure confirming bullish intent.
Now I’m locked in, watching for price to sweep a 5M sell-side liquidity pocket into a clean LTF order block for the next entry.
🎯 Target: Short-term 5M highs
🚀 Bias: Still bullish unless structure breaks
This is a patience game now — execution only after confirmation.
USDJPY| - Bullish Setup Loading30M price action remains heavy to the upside. Structure is intact — no lows invalidated. Currently sitting on a refined 30M order block, I’m patiently watching for price to dip back into the zone and sweep short-term liquidity (SSL).
Once that sweep happens and we pull back into the OB, I’ll be looking to ride the bullish momentum:
🎯 First target: 5M highs
🚀 Final target: 30M highs
Feeling confident — just waiting on smart money to confirm it’s time.
XAUUSD| Smart Money Confirmations LoadingBias: Bullish
HTF Overview: Price has just tapped into the 30-minute order flow zone after clearing out sell-side liquidity. This area aligns cleanly with bullish intent and prior structure.
LTF Focus: Currently waiting for lower timeframe confirmation — ideally a clear CHoCH or internal flip. Once smart money confirms this zone with a shift, I’ll look to enter and ride the momentum.
Target: Initial focus is on the 5-minute highs as a short-term objective. While price could continue toward 30-minute highs, structure suggests the recent 5M high is a more immediate and realistic target, making it a smarter move to secure profit around that level.
Mindset Note: Not in a rush — letting price speak first. The confirmation is what separates a guess from a smart move.
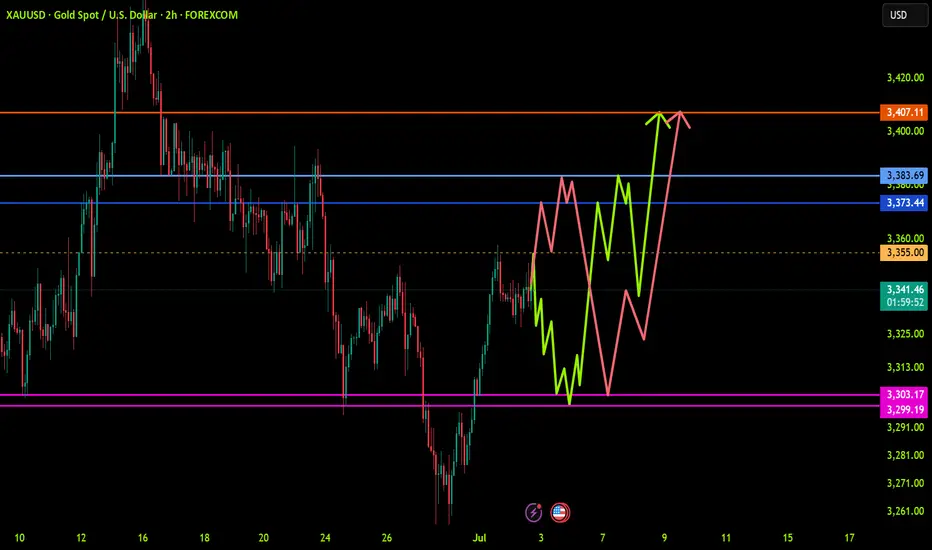
XAUUSD: Trend in 2H timeframevery important levels for GOLD, we have two trends,
Please pay special attention to the colored levels.
Trends are very accurate,
>>>>>>>>>>>>>>>>>>> The setup is very sensitive <<<<<<<<<<<<<<<<<<<<<<<<
Be careful
BEST
MT