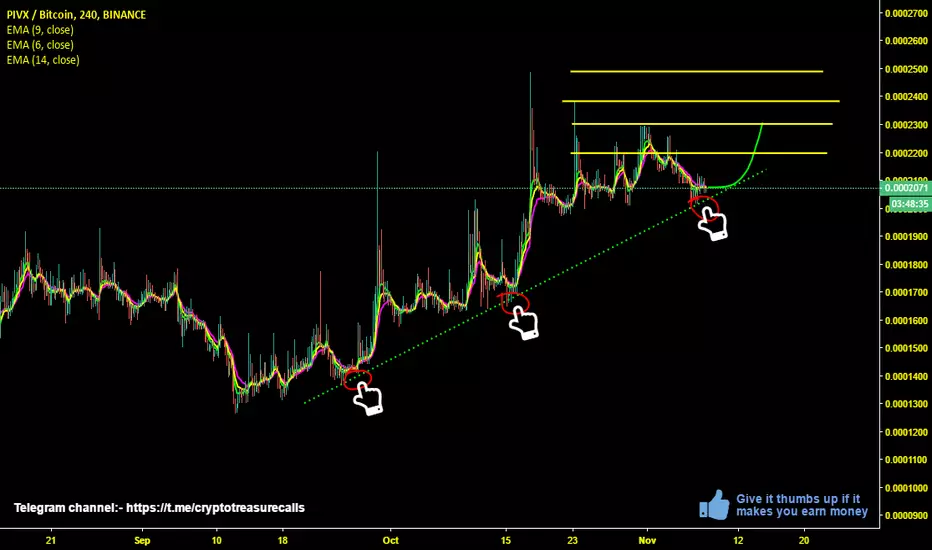
PIVX Trading AdviceBuy Price: Yellow Line
TP: Green Lines
Moon: White Line
Support: Blue Line
SL: Red Line (I don't recommend you to sell in loss.)
Invest Suggestion: 5-10 Percent
Profit Expectations: 5, 10 or >20 Percent
Just hold and watch. Sell when you get some profit. Good Luck!
Looks Good? Leave a like, share and tell me in comments if my trading advices are working for you.
Thanks for visiting.
Pivx

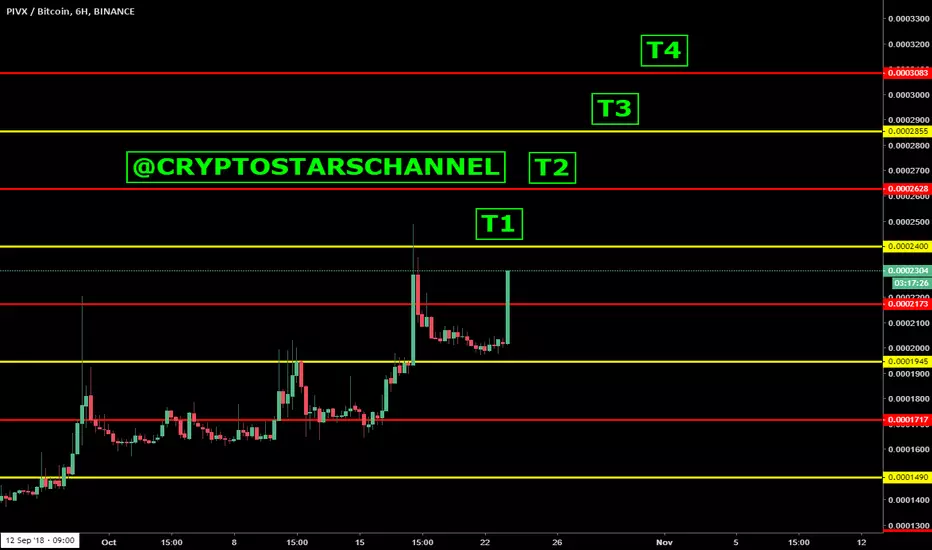
PIVX approaching support... will the uptrend be compromised?
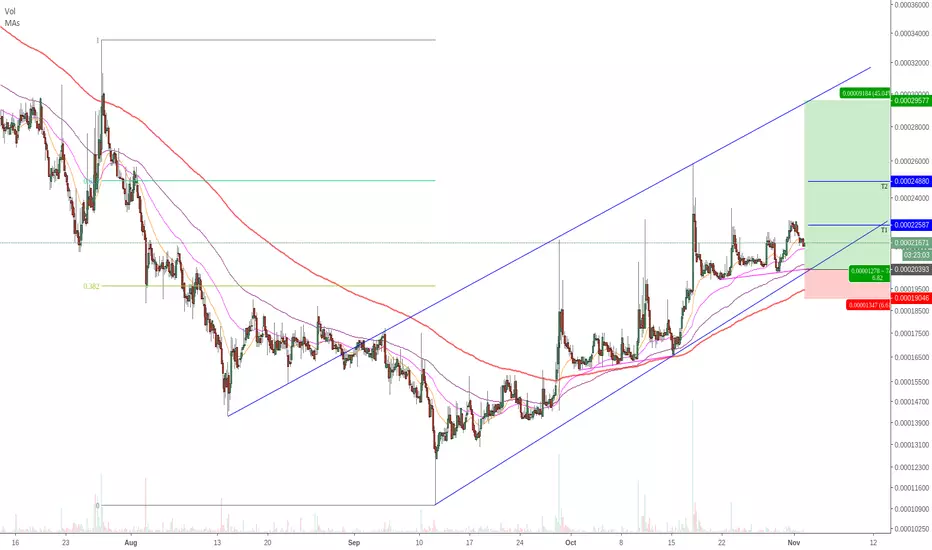
Following the previous idea, which you can find below, the reaction to the zPIV announcement indeed was positive and yesterday price has made another surge by 30% over the Bitcoin, reaching btc 0.0002488 high. PIVIX has been trending up as expected, although now the correctional phase has started.
Currently it is trading near 20k satoshis psychological support. It is also a strong technical support where two Fibonacci retracement levels are located. First is 23.2% retracement from the all-time low, and second is 78.6% Fibs from the 17 October low.
While it could be the starting point of the uptrend continuation, PIVX yet to confirm it, by rejecting current support area, that is located between 0.0002020 and 0.0001960. But, price might break below, that will suggest more downside pressure being put on the PIVX.
Next support is seen at 61.8% Fibs, that is 0.0001730. The key support is located at 78.6% Fibs that is btc 0.0001520. If price breaks below key support, the upside potential will be compromised while the long-term downtrend domination is likely to continue.
In short, current support (around 20k satoshis) will be the decision-making area. It is important to watch current price action as rejection of the support should have a very positive outcome on the price. On the other hand, daily break and close below the 0.0001964 level will imply the downside pressure on the PIVX/BTC.
Support:
1. 0.0002020
2. 0.0001965
3. 0.0001730
4. 0.0001530
Resistance:
1. 0.0002490

There is a trading opportunity to buy in PIVXBNBTechnical analysis:
. PIVX/BINANCECOIN is in a range bound and the beginning of uptrend is expected.
. The price is below the 21-Day WEMA which acts as a dynamic resistance.
. The RSI is at 46.
Trading suggestion:
. There is a possibility of temporary retracement to suggested support zone (0.10200 to 0.08800). if so, traders can set orders based on Price Action and expect to reach short-term targets.
Beginning of entry zone (0.10200)
Ending of entry zone (0.08800)
Entry signal:
Signal to enter the market occurs when the price comes to " Buy zone " then forms one of the reversal patterns, whether " Bullish Engulfing ", " Hammer " or " Valley " in other words,
NO entry signal when the price comes to the zone BUT after any of the reversal patterns is formed in the zone.
To learn more about " Entry signal " and the special version of our " Price Action " strategy FOLLOW our lessons:
Take Profits:
TP1= @ 0.13370
TP2= @ 0.15440
TP3= @ 0.17700
TP4= @ 0.20800
TP5= @ 0.29700
TP6= @ 0.36900
TP7= @ 0.44200
TP8= @ 0.54500
TP9= @ 0.67500
TP10= Free

PIVX comingvolume seems pretty good and price is touching bottom line at the moment so it means buy opportunity. I am expecting a breakout
PIVXBTC BINANCE MRMEGPIVXBTC in binance exchange - look good!! -in 1 day chart - you can see support and opposition line in the chart - please follow and like us and give us some comments about ideas - thanks for your following and liking us
PIVX time to collapse some more? Buy Green
Sell Red
//
it's mainly for swing trading, i use the 3 day / 15 day / monthly charts with it and it works perfectly,
//
it works good for stocks and cryptocurrency.
//
you will use heiken ashi chart style and turn on the EMA DOTS indicator.
once the indicator is on you will hide the heiken ashi so you only see the dots.
//
when a green dot 2.18% 3.00% 3.00% -0.78% -0.78% -6.68% -7.44% -7.44% appears you buy, if a green dot 2.18% 3.00% 3.00% -0.78% -0.78% -6.68% -7.44% -7.44% appears after that green dot 2.18% 3.00% 3.00% -0.78% -0.78% -6.68% -7.44% -7.44% you hold your investment.
if a red dot appears you sell your position. easy as that.
//
the standard dots setting will be set to 10 - use this for any chart above 3 days
change the dots setting to 6 for 3day charts and below
//
shorter time frames will be choppy.
//
larger time frames will be smooth.
//
*Daytrading smaller timeframes is possible but not recommended.

PIVX seems good to buy hereAs you can see pivx is holding trend line support.
As of now it is on support where we wanted buy.
Get some here.
Buy between 2000-2100
Current price 2064
Targets:- 2195,2300,2385,2490
Hold for 0-4 weeks.
Its price can go down even more if market gets crash.
Don't buy 100% of your portfolio for this coin. Buy 40-50% here and rest keep for if market gets crash.
Invest at your own risk. profit is yours and loss is also yours.
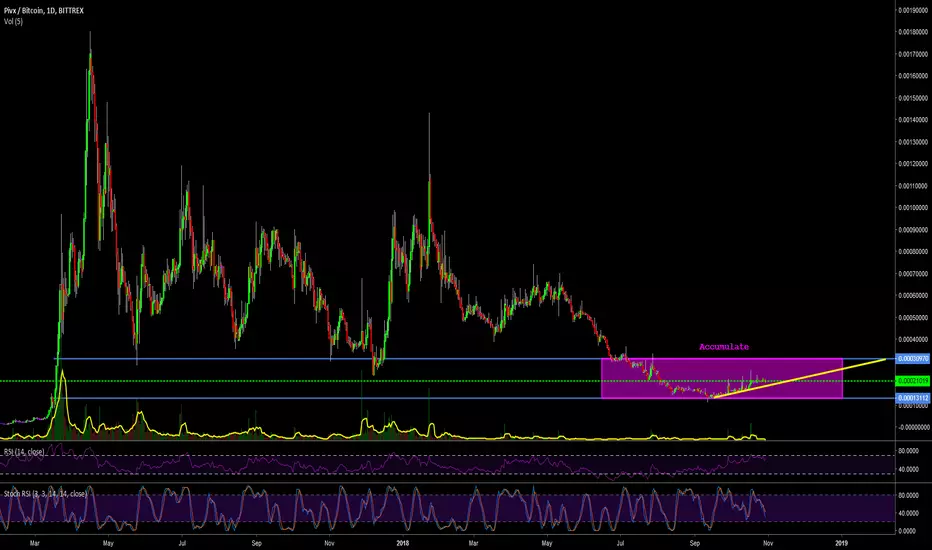
Accumulate PIVXThis is a no brainer. Accumulate in the zone and hodl. PIVX has hit rock bottom recently and has established a slight up trend with intermittent spikes in price. RSI is strong. Stoch allows for growth. Price is above the kumo for the first time in 6 months. All positive signs. Just need to be patient.
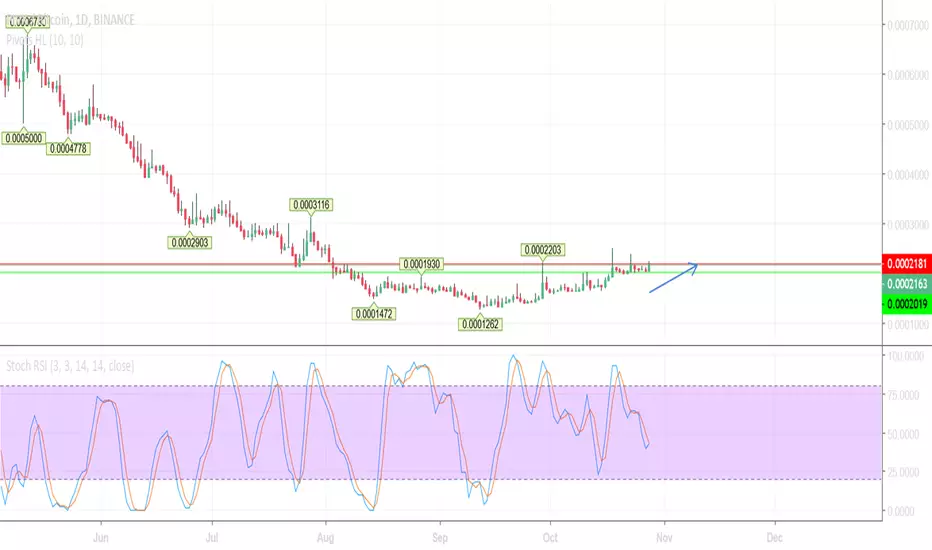
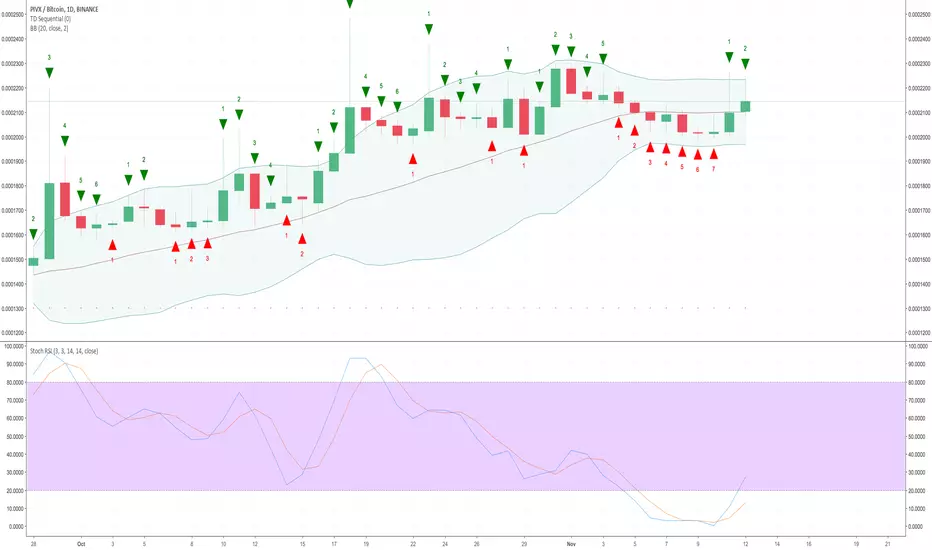
PIVX Bull Trend Has Started According to Tom Demark CountPivx gave a green 2 on the daily chart which is a clear buy signal according to Tom Demark count. It also broke daily MA20 which is a also a very bullish signal. Stoch RSI is oversold and has a lot of room to go up.
I expect the price continue to increase.
Here is my trading idea:
Buy: 2150 - 2185
Sell targets: 2234 - 2290 - 2328 - 2480
Stop loss: 1975
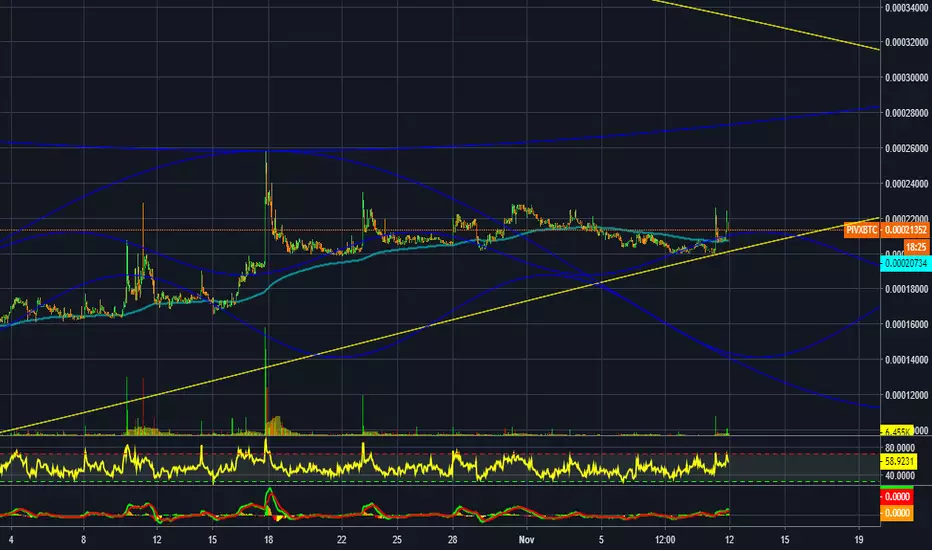
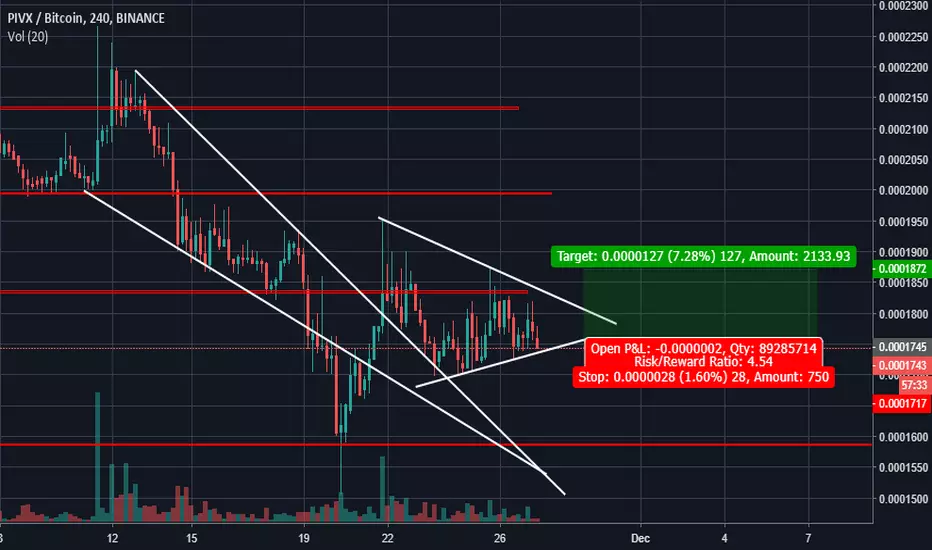
PIVXBTCLast time I set up too tight stop loss, let's try another time.
Idea is to enter at the bottom of uptrend channel, which is also level of several last bottoms and 100 MA level. Stop loss bellow 200 MA, targets at previous high, 0.618 of last drop from way back (I'm not too confident on this one) and channel top.
Disclaimer: this idea is solely for my own purposes, to satisfy the ego, if it will work out ;)
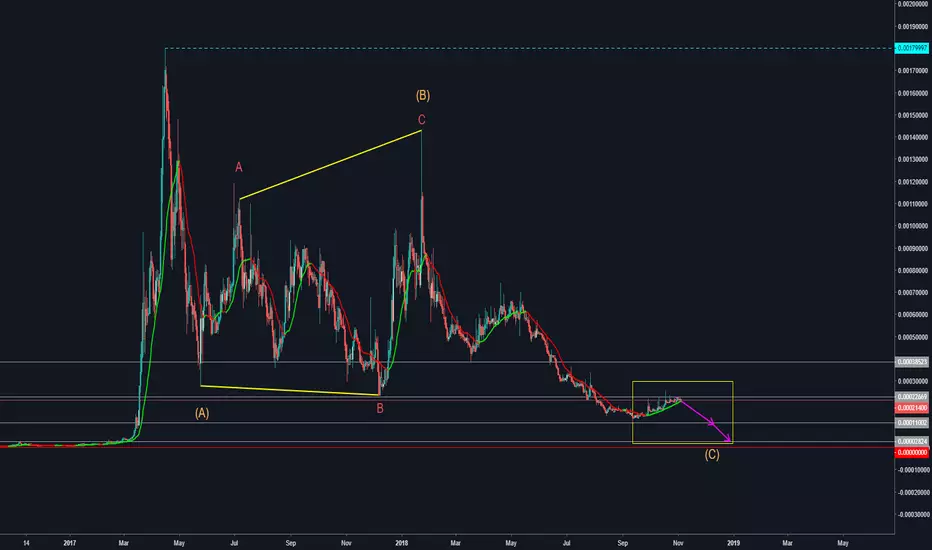
PIVX POSSIBLE BEAR FLAG TO PUSH LOWERHello guys!!!
Nice trading weekend we are having with some volatility in some of the coins! I think the best is yet to come!
Pivx is going up very slow and correctively, which makes me think it is making a "Bear Flag" to give us on more leg down to finish the Corrective structure ABC. This leg down can take Pivx to retest the previous low @ 0.00011002 or push even lower @ around 0.00002824.
This Forecast would be invalidated if Pivx moves up impulsively taken down the previous high @ 0.00025845.
I would update the charts as soon as the market makes a decision.
More deep analysis coming your way of all major and popular Cryptos!
Thanks for viewing! Please share, comment and like!

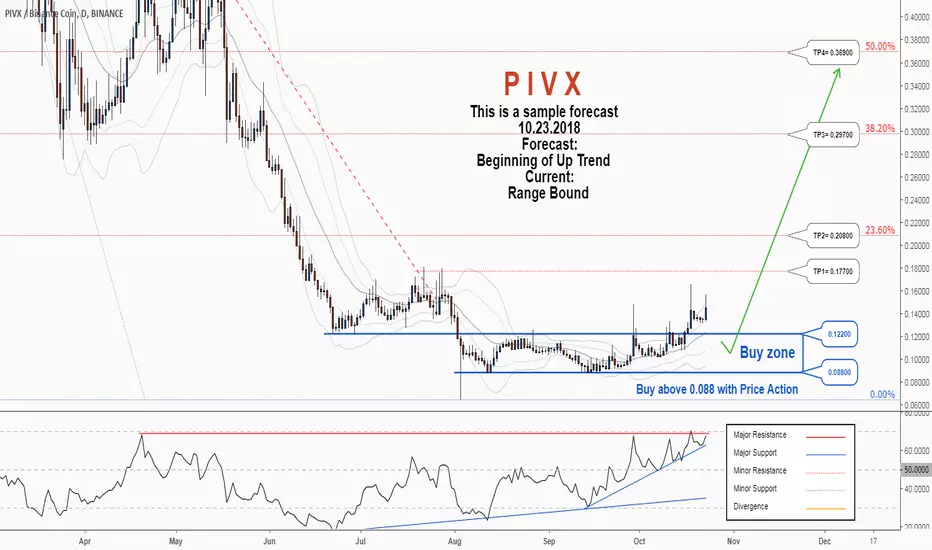
A trading opportunity to buy in PIVXBNBTechnical analysis:
. PIVX/BINANCE is in a range bound and the beginning of uptrend is expected.
. The price is above the 21-Day WEMA which acts as a dynamic support.
. The RSI is at 67.
. The price downtrend in the daily chart is broken, so the probability of the resumption of an uptrend is increased.
Trading suggestion:
. There is a possibility of temporary retracement to suggested support zone (0.12200 to 0.08800). if so, traders can set orders based on Price Action and expect to reach short-term targets.
Beginning of entry zone (0.12200)
Ending of entry zone (0.08800)
Entry signal:
Signal to enter the market occurs when the price comes to " Buy zone " then forms one of the reversal patterns, whether " Bullish Engulfing ", " Hammer " or " Valley " in other words,
NO entry signal when the price comes to the zone BUT after any of the reversal patterns is formed in the zone.
To learn more about " Entry signal " and the special version of our " Price Action " strategy FOLLOW our lessons:
Take Profits:
TP1= @ 0.17700
TP2= @ 0.20800
TP3= @ 0.29700
TP4= @ 0.36900
TP5= @ 0.44200
TP6= @ 0.54500
TP7= @ 0.67500
TP8= Free
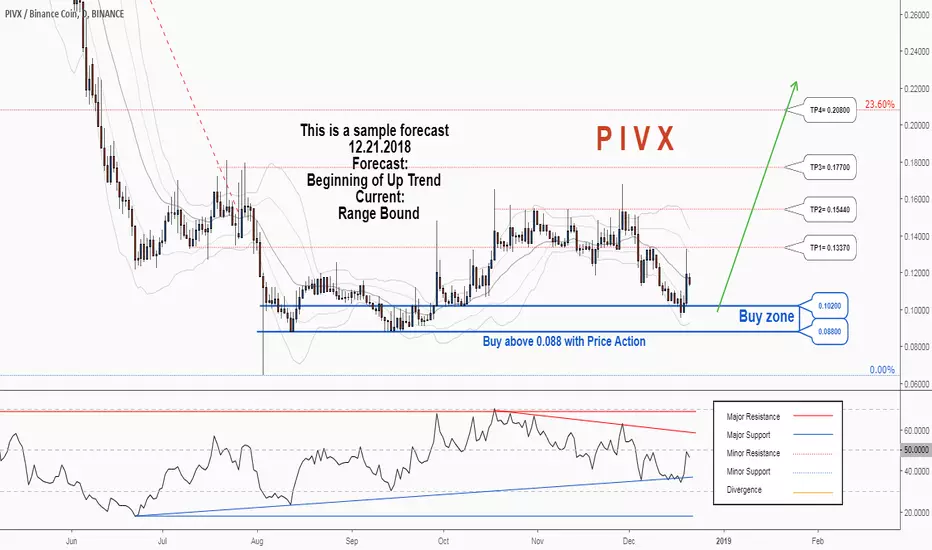
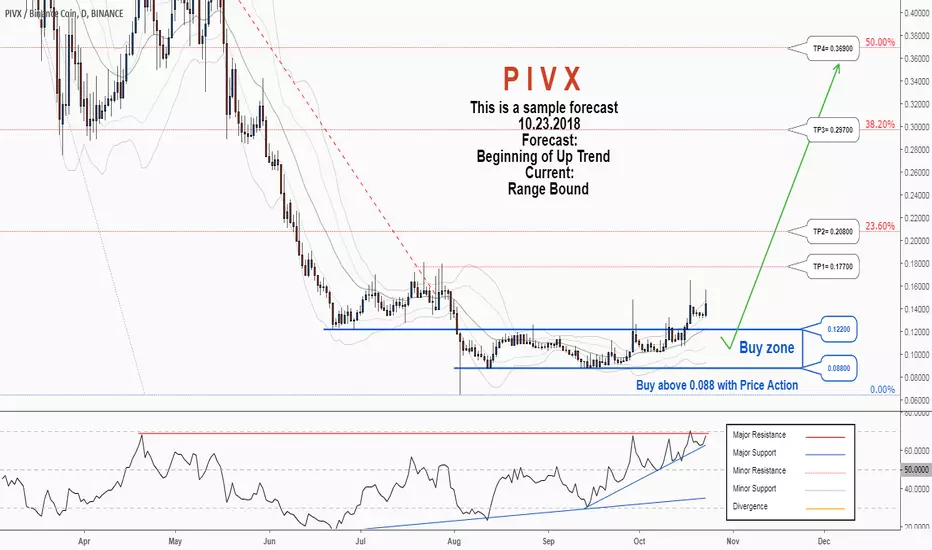


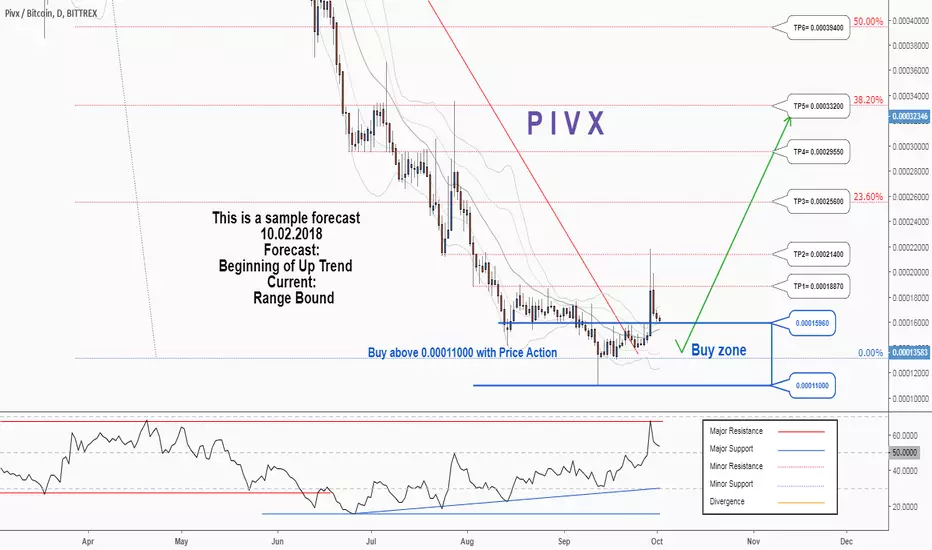
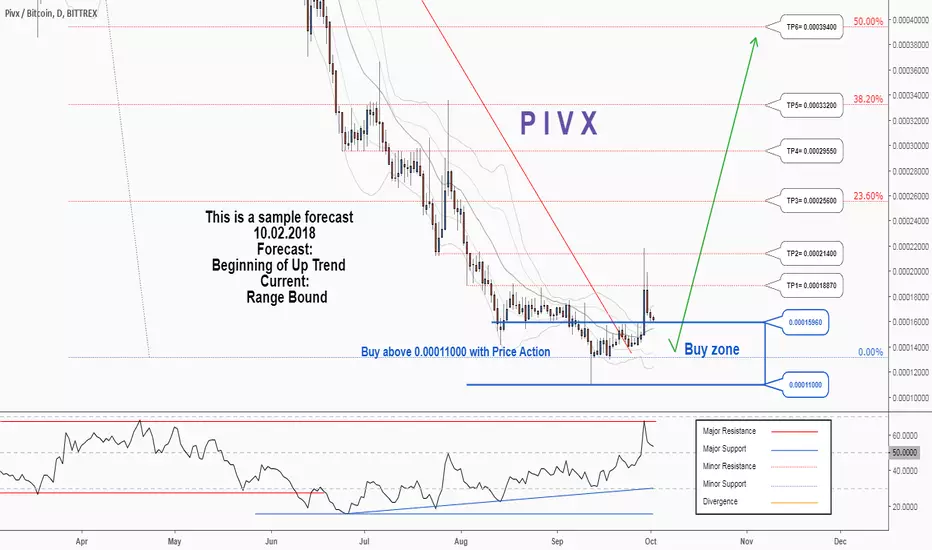
A trading opportunity to buy in PIVXBTCTechnical analysis:
. PIVX/BITCOIN is in a range bound and the beginning of uptrend is expected.
. The price is above the 21-Day WEMA which acts as a dynamic support.
. The RSI is at 52.
. The price downtrend in the daily chart is broken, so the probability of the resumption of an uptrend is increased.
Trading suggestion:
. There is a possibility of temporary retracement to suggested support zone (0.00015960 to 0.00011000). if so, traders can set orders based on Price Action and expect to reach short-term targets.
Beginning of entry zone (0.00015960)
Ending of entry zone (0.00011000)
Entry signal:
Signal to enter the market occurs when the price comes to "Buy zone" then forms one of the reversal patterns, whether "Bullish Engulfing" , "Hammer" or "Valley" in other words,
NO entry signal when the price comes to the zone BUT after any of the reversal patterns is formed in the zone.
To learn more about "Entry signal" and the special version of our "Price Action" strategy FOLLOW our lessons:
Take Profits:
TP1= @ 0.00018870
TP2= @ 0.00021400
TP3= @ 0.00025600
TP4= @ 0.00029550
TP5= @ 0.00033200
TP6= @ 0.00039400
TP7= @ 0.00045650
TP8= @ 0.00054480
TP9= @ 0.00065700
TP10= @ 0.00092300
TP11= Free
A trading opportunity to buy in PIVXBTC Technical analysis:
. PIVX/BITCOIN is in a range bound and the beginning of uptrend is expected.
. The price is above the 21-Day WEMA which acts as a dynamic support.
. The RSI is at 52.
. The price downtrend in the daily chart is broken, so the probability of the resumption of an uptrend is increased.
Trading suggestion:
. There is a possibility of temporary retracement to suggested support zone (0.00015960 to 0.00011000). if so, traders can set orders based on Price Action and expect to reach short-term targets.
Beginning of entry zone (0.00015960)
Ending of entry zone (0.00011000)
Entry signal:
Signal to enter the market occurs when the price comes to "Buy zone" then forms one of the reversal patterns, whether "Bullish Engulfing" , "Hammer" or "Valley" in other words,
NO entry signal when the price comes to the zone BUT after any of the reversal patterns is formed in the zone.
To learn more about "Entry signal" and the special version of our "Price Action" strategy FOLLOW our lessons:
Take Profits:
TP1= @ 0.00018870
TP2= @ 0.00021400
TP3= @ 0.00025600
TP4= @ 0.00029550
TP5= @ 0.00033200
TP6= @ 0.00039400
TP7= @ 0.00045650
TP8= @ 0.00054480
TP9= @ 0.00065700
TP10= @ 0.00092300
TP11= Free