Gold Jumps 1%: Trade the Fed Drama & Rate Cut Buzz!Fundamental Analysis: What’s Driving Gold’s Rally? 🌟
Gold’s Big Win: Spot gold jumped 0.9% to $3,447.09/oz on August 29, with a stellar 4.8% gain for the month. Gold futures also rose 1.2% to $3,515.70/oz, signaling strong bullish momentum. 📈
USD Stays Steady but Weakens: The USD held stable but lost 2.2% in August, making gold more affordable for foreign buyers and boosting its appeal. 📉
PCE Data Supports Rate Cuts: US PCE inflation rose 0.2% month-on-month and 2.6% year-on-year in July 2025, aligning with forecasts. Strong consumer spending and tariff-driven price hikes signal persistent inflation, but analysts expect the Fed to cut rates—potentially twice this year—lifting commodities like gold. The market now sees an 89% chance of a 0.25% rate cut in September 2025, up from 85%, per CME FedWatch. 🏦
Fed Drama Intensifies: A federal judge is reviewing whether to block President Trump’s attempt to fire Fed Governor Lisa Cook, who’s suing to protect her position, arguing Trump lacks valid grounds. This uncertainty around the Fed’s independence is a major tailwind for gold’s safe-haven status. 🇺🇸⚖️
Why Gold Shines: As a non-yielding asset, gold thrives in low-interest-rate environments and during economic uncertainty—perfect conditions for its current rally!
Technical Analysis: Bullish Momentum Continues, But Watch Key Levels! 📉
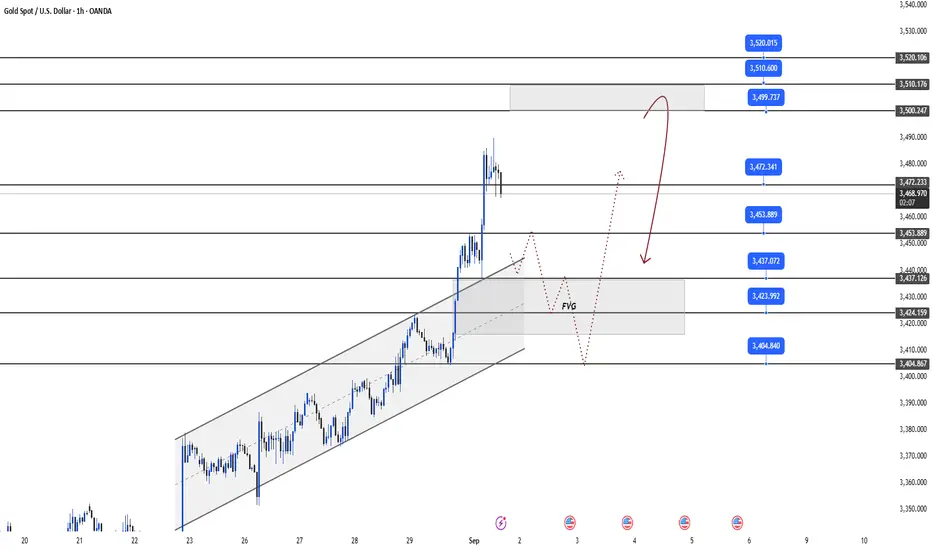
Gold kicked off the Asian session with a bang, breaking through the 3353 resistance and creating a significant FVG (Fair Value Gap) due to its strong upward push. As long as gold stays above the 343x zone, the bulls remain in control. However, with prices nearing multi-month highs, a pullback could be looming. Here’s the game plan:
Key Resistance: 3500 - 3510 - 3520
Key Support: 3472 - 3453 - 3437 - 3423 - 3404
Scalping Opportunities:
Sell Scalp: 3499 - 3501
SL: 3504
TP: 3496 - 3491 - 3486
Buy Scalp: 3453 - 3451
SL: 3448
TP: 3456 - 3461 - 3466
Swing Trading Opportunities:
Sell Zone: 3510 - 3512
SL: 3516
TP: 3506 - 3500 - 3490 - 3480
Buy Zone: 3436 - 3434
SL: 3430
TP: 3440 - 3450 - 3460
Plangold
Gold Surges Amid Fed Drama & Key Data: Buy or Sell Now?Fundamental Analysis: What’s Shaking Up Gold Prices?
USD Index Up 0.2%: A stronger dollar makes gold pricier for foreign buyers, creating short-term pressure. But don’t worry—gold remains the ultimate safe-haven in times of uncertainty! 📉
US Treasury Yields Rise 0.4%: Higher yields make non-yielding gold less attractive. Still, with persistent inflation, gold’s allure as a hedge stays strong! ⚖️
Fed Drama: Trump vs. Lisa Cook: Earlier this week, Trump announced plans to oust Fed Governor Lisa Cook from the Board of Governors. Cook’s legal team fired back, filing a lawsuit to block her removal, setting the stage for a prolonged legal battle. The result? Gold surged to a 2-week high on August 26 following this news. Political uncertainty = Rocket fuel for gold! 🔥🇺🇸
Key Economic Data on the Horizon: Investors are on edge awaiting GDP data today (28/08) and the PCE index—Fed’s favorite inflation gauge—on 29/08. Reuters’ poll forecasts PCE inflation at 2.6% for July 2025, matching June’s level. If the data comes in softer than expected, the Fed might cut rates, sending gold soaring! 📊 What’s your take on the Fed’s next rate move?
Technical Analysis: Bullish Trend Intact, But Watch for a Pullback!
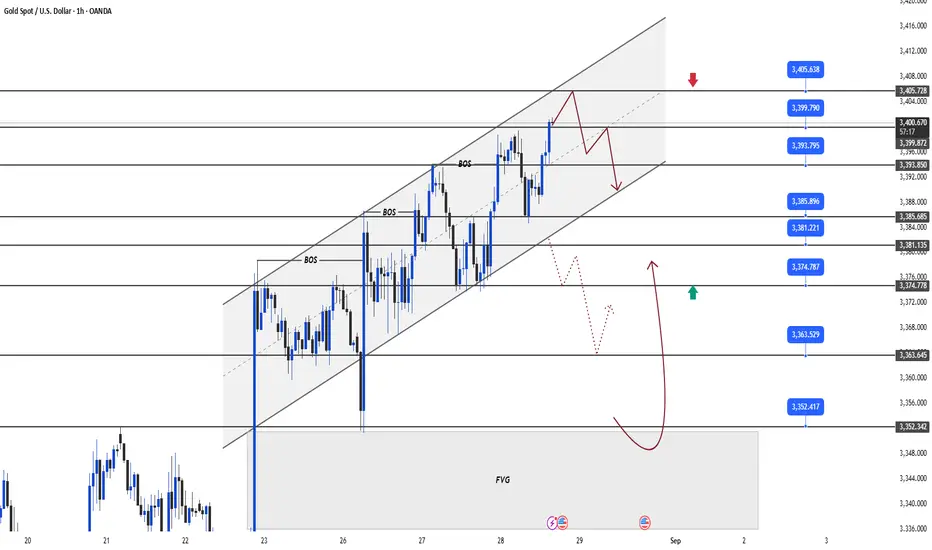
Gold continues its bullish run, breaking through the 3393 level with a clear BOS (Break of Structure), signaling the uptrend is alive and well! However, price is hesitating around the 340x resistance zone, with risks of a sharp pullback at any moment. Strategy: BUY short-term to ride the momentum, but be ready to SELL on signs of a structural reversal. Don’t miss out! 📉📈
Key Resistance: 3399 - 3405
Key Support: 3393 - 3385 - 3381 - 3374 - 3363 - 3352
Sell Zone: 3403 - 3405
SL: 3410
TP: 3399 - 3393 - 3385 - 3381 - 3374
Buy Zone: 3375 - 3373
SL: 3369
TP: 3381 - 3385 - 3393 - 3400
#Gold #XAUUSD #TradingView #Fed #Trump #PCE #GDP #GoldTrading #Finance #Investing #TechnicalAnalysis #MarketUpdate #Crypto #Forex
"Gold 08/27/2025: Will It Correct Deeply or Continue to Surge?"Market Overview
Gold surged on August 26, 2025: Spot gold up 0.5% to $3,382.19/oz (highest since August 11), futures up 0.5% to $3,433/oz.
Driver: President Trump's firing of Fed Governor Lisa Cook over mortgage fraud allegations creates uncertainty, boosting gold as a safe-haven. Bob Haberkorn (RJO Futures): “The Fed is the main driver of gold's price action.”
Fundamental Factors
Fed: Chair Powell signals 0.25% rate cut in September 2025 (87% probability, CME FedWatch).
Economic Data: US durable goods orders down 2.8% (July), better than forecast. Await GDP (Aug 28) & PCE (Aug 29).
Gold Appeal: Attractive in low rates and economic uncertainty.
Technical Analysis
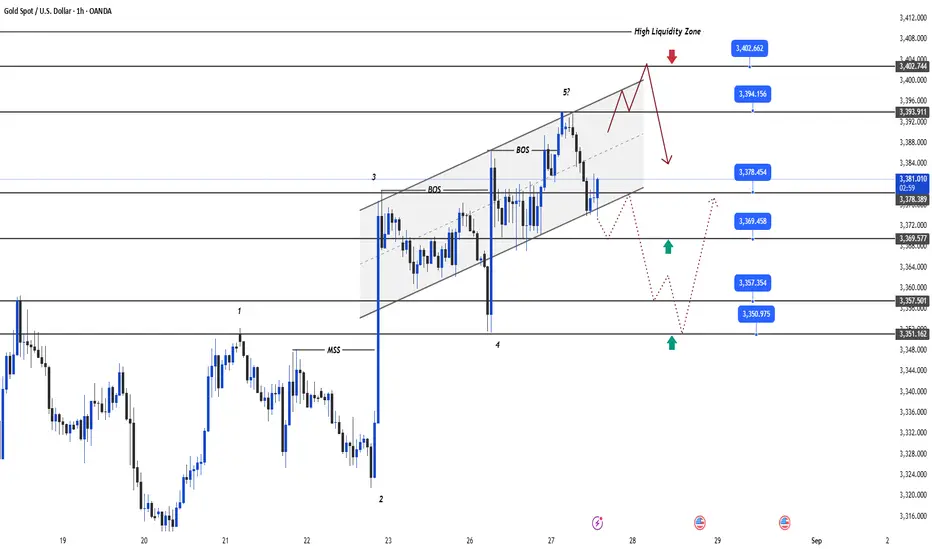
Gold hit Order Block (OB) at 339x, retraced to 337x. Bullish above 337x; break below with bad news triggers Bearish.
Key Levels:
Support: 337x, 3353-3357
Resistance: 339x, 3400-3402
Trading Plan (ICT)
BUY Setups
Scalp Buy:
Entry: 3370-3368
SL: 3365
TP: 3378 / 3388 / 3394
Zone Buy:
Entry: 3357-3353
SL: 3346
TP: 3364 / 3373 / 3381 / 3394 / 3402
SELL Setups
Scalp Sell:
Entry: 3387-3389
SL: 3393
TP: 3379 / 3369
Zone Sell:
Entry: 3400-3402
SL: 3410
TP: 3394 / 3384 / 3371 / 3362 / 3350
GOLD - Continue to correct around 1900 round resistance?The Federal Reserve has decided to keep interest rates the same as predicted. However, during the FOMC meeting, Mr. Powell stated that he believes there will be two more rate hikes in order to reach the 2% inflation target. It's important to note that keeping interest rates unchanged does not signify the end of the rate hike process.
Looking at the short-term outlook, it is leaning towards moderate to bearish. The 4-hour chart reveals that XAU/USD is currently trading below the 34 and 89 EMAs. Additionally, the Momentum indicator is slightly below its midpoint, while the Relative Strength Index (RSI) shows no clear direction, hovering around the 50 line. This indicates a lack of speculative interest in the market.
Gold faces strong resistance at $1966.20, which is the 23.6% retracement level of the recent daily decline.
Yesterday, we opted for a selling strategy within the price range of $1955 to the target of $1930.
Today, I am implementing a short-term buying strategy as previously mentioned. The target for this strategy is between $1945 and $1955.
It's important to note that the selling strategy will continue to be established within these price zones.

GOLD 08/06 - Bulls defend the price zone 1935The value of the dollar index has decreased, resulting in a lower price for gold for those who hold other currencies.
Investors are closely monitoring the upcoming Fed meeting and the US consumer prices report for May through June 13 to gain a better understanding of the state of the economy.
There has been mixed economic data along with dovish comments from Fed officials.
Gold is currently facing resistance at the 1940-1935 level, but the bulls are trying to gain momentum to push it up. However, the bears are determined to keep the price below 1955.

GOLD - Moving sideways in a narrow rangeThis week, the value of gold received a boost due to weak economic data in the US, which caused the dollar to decline.
This led to speculation that the Federal Reserve may not raise interest rates further.
However, this support is limited as the dollar is expected to recover due to uncertainty about the Fed's next move.
Although some areas of the US economy are slowing down, inflation and the job market remain strong, which puts pressure on the central bank to tighten policy.
Currently, the price range for gold is between 1966-1952, with a narrow band. Traders can operate within this range during the Eurasian session. It is important to manage your volume and stop-loss immediately during periods of strong market fluctuations.
And today, I will wait for the SELL to continue in the upper regions around 1970.
And target at 1950 - 1945. Then BUY order will be set

GOLD before NF: Beware of tricksGold prices increased by more than 0.7% on Thursday, resulting in an overall gain of about 1.6% for the week.
This marks the best week for gold since early April. The rise in XAU/USD comes as the US Dollar and Treasury yields weaken, highlighting gold's anti-fiat characteristics.
On the daily chart, the next major technical obstacle for gold prices is approaching. On the 4-hour chart, the pair has rebounded off the rising EMA34 and is attempting to stay above the EMA89.
Technical indicators are still in positive territory, with the RSI remaining bullish at around 64. More upside potential is expected in the near future, especially if the current positive trend continues.

GOLD 31/5 - Do you think this's a short-term bull run?Yesterday, gold prices experienced their largest daily gain in over a week due to a decrease in the US Dollar Index and Treasury yields.
This was partly due to month-end positioning and a general sense of caution among investors.
Mixed US data also contributed to the decrease in the value of the dollar and an increase in the value of XAU/USD.
The Relative Strength Index for XAU/USD at 14 is ascending and has improved from oversold territory, which supports the rally. However, there were also bearish indicators from the Moving Averages Convergence and Divergence indicator, which prompted gold buyers.
Currently, Gold is experiencing a minor bullish correction with a target of $1975 in the short term.
Yesterday, I initiated a Buy order at $1934 and successfully hit the target at $1960. As of today, we are anticipating further growth in the value of Gold.

GOLD - Downtrend is still thereAt the beginning of the week, the price of gold dropped to the lowest it's been in two months. This was due to the easing of concerns around the US debt ceiling and the increase in US yields.
The real yield, which is calculated by subtracting the market rate of inflation from the nominal yield, also contributed to the weakening of gold.
The US Dollar has been steadily rising towards the end of the year and the direction of the DXY Index could determine the next move of the precious metal. Despite this, the volatility of gold has decreased, which suggests that the market is content with current prices.
If the 1930 level is broken, there could be a pullback. However, if these levels are maintained, it could indicate that the overall rally will continue. The price action in the next few sessions will provide clues to the medium-term direction.
Please wait for until Gold returns to the 1955 - 1960 price range , and we will set up a SELL order at this price range.

Gold this week, bearish Dow setup!Additionally, concerns about a potential U.S. debt default further affected the market.
The rise in interest rates negatively impacts non-yielding assets such as gold, as it increases the opportunity cost of holding them.
The Fed's approach to rate hikes is based on data, and with inflation rising, they may consider further hikes.
Economic risks from a possible default are also reduced, giving the central bank more leeway to increase interest rates, indicating a bleak outlook for gold in the short term.
Gold is currently experiencing a minor increase in value and is expected to hover around the price range of 1955-1960 before heading back down.
The projected target for this week is a decrease in value, with Gold returning to the price zones of 1935-1930 and 1925.

XAUUSD - Choose SELL for todayGold price fell below the support of $1936.00 during Asian trading, after slipping beneath the $1952.00 cushion due to the US economy's approaching default.
Technical indicators suggest a downside risk in the daily chart.
The US Dollar found support due to positive macroeconomic data and the gloomy market mood. The currency remains strong, while the stock market ignores concerns about the US debt ceiling limit.
Today, Gold is returning to retest the price zone around 1953$ before continuing its fall.
The nearest target is back to 1935$ -1930$
I still choose the SELL beat for today.
The previous Break Out and BUY strategy for GDP news is about to be completed.

GOLD Forecasting a fall for GDPGold is facing difficulty in finding a clear direction as the market remains indecisive due to conflicting signals regarding US debt extension talks and the US Federal Reserve.
Currently, the market is struggling around the key short-term support line near $1,955, and the XAU/USD daily chart suggests a bearish extension.
The risk is also leaning towards the downside in the short term, as the pair trades below all its moving averages, and technical indicators are declining.
It is crucial to watch out for a potential breakout below the price zone of $1950, as it could trigger a strong downtrend. My goal is 1945$ - 1940$ - 1935$

GOLD - The bulls are gradually regaining their positionGold prices have been trading in a narrow range of $1,950-1,980 for almost a week.
This comes after the prices dropped below $2,000 level due to the uncertainty around the US default.
Copper prices have hit a six-month low due to weakening demand and global manufacturing activity.
The metals market has been under pressure as the US dollar has strengthened, with traders speculating that the Federal Reserve will maintain higher interest rates this year.
BUY GOLD zone 1967 - 1965
Stoploss: 1960
Take Profit 1: 1972
Take Profit 2: 1978
Take Profit 3: 1983
Note : TP, SL full to be safe and win the market !

Gold waits for signs of falling after Elliott wave Gold prices struggled to capitalize on its modest intraday gains and attracted some selling near the $1980 region during the early European session on Wednesday.
Today, I still expect Gold to break out of the 1978$ price zone and move further to the 1985 and 1995 short term targets.
If everything goes as expected, Gold has almost completed wave 4 Elliott and wave 5 falling to the 1940 price zone is about to form.
I am waiting for Gold to return to retest the price zone around 1965$. And a Breakout buy order is waiting for an entry signal.
Short term selling can be established above 1985$ and 1995$.
Traders, what's your opinion?

Gold struggles to return to bullish momentumGold prices remain stable below $2,000 as US lawmakers continue talks on raising the debt ceiling.
The Federal Reserve's mixed signals on monetary policy have caused a lack of safe-haven demand for gold, resulting in a drop in prices.
However, experts predict that Gold will not fluctuate much this week and will try to return to the $2,000 price area. Currently, it is struggling to move past the $1,950 price zone.
SELL GOLD zone 2000 - 1997
Stoploss: 2005
Take profit 1: 1993
Take profit 2: 1988
Take profit 3: 1982
BUY strategy is still being implemented around 1969$. And it is expected that tomorrow, the price zone of $ 1983 hoping for a Breakout is that Gold will move to the SELL entry as expected

Gold will drop at the end of the week!The price of gold is hovering near a seven-week low due to the recent downtrend. The strength of the USD is causing this, as optimism about the United States debt ceiling talks and hawkish Federal Reserve comments are supporting the currency.
Additionally, recent challenges to US debt limit extension and a US-Taiwan trade deal are causing the XAU/USD price to decline. The XAU/USD has been declining for three consecutive days and is currently below its 20 Simple Moving Average.
Technical indicators show a prevailing selling interest and the XAU/USD is oversold in the near term. In the 4-hour chart, technical indicators are at extreme levels but do not anticipate a potential bounce. The bright metal is trading far below all its moving averages, with the 20 SMA heading south below the longer ones.
SELL XAUUSD zone 1970 - 1973
Stoploss 1977
Take profit 1: 1965
Take profit 2: 1960
Take profit 3: 1950
BUY XAUUSD zone 1950 - 1946
Stoploss 1942
Take profit 1: 1955
Take profit 2: 1960
Take profit 3: 1970

GOLD - move sideways in price range, waiting for CPIGold sold off on Friday, but the bulls managed to fend off the attack on the psychological $2,000 level, allowing the price to establish a base and recover on Monday, a sign signal that the path of least resistance remains to the upside, with the precious metal benefiting from the uptrend.
If XAU/USD remains on its bullish trajectory, and breaks out of the 2034 price zone and closes above it, the first hurdle to watch will appear at $2048 , followed by the 2023 highs shortly. under $2,070 . A successful test of this technical hurdle could consolidate upward momentum, paving the way for a move towards the channel's resistance at $2,100.
In the event of a failure, initial support lies at $2,000 , but a breakdown could attract sellers and create suitable conditions for a pullback towards $1,975. On further weakness, the next downside target will move to the 50-day simple moving average hovering around the $1958 level.
SELL Scalp GOLD 2032 - 2029
Stoploss: 2035
Take profit 1: 2027
Take profit 2: 2020
Take profit 3: 2010
BUY GOLD 2000 - 2003
Stoploss: 1995
Take profit 1: 2010
Take profit 2: 2020
Take profit 3: 2030
