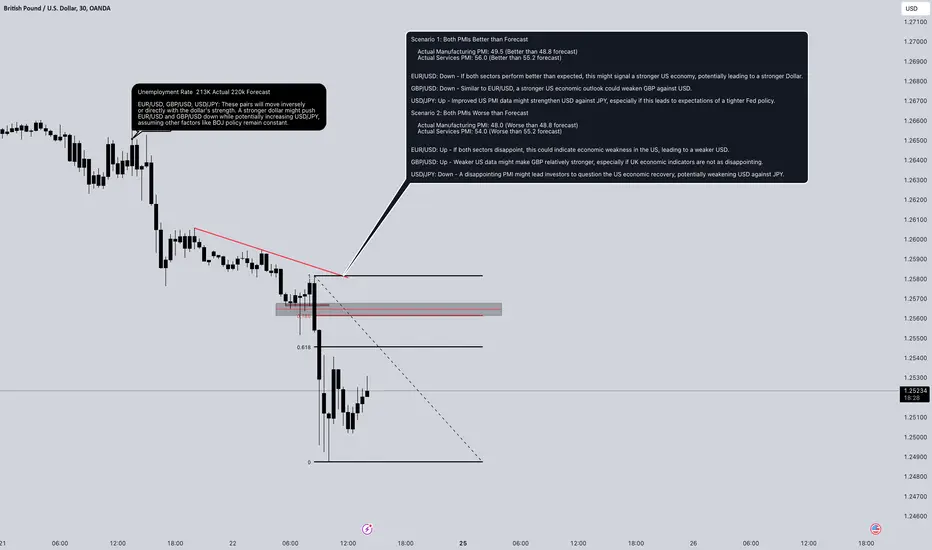
GBPUSD Short and Longs (News) Scenario 1: Both PMIs Better than Forecast
Actual Manufacturing PMI: 49.5 (Better than 48.8 forecast)
Actual Services PMI: 56.0 (Better than 55.2 forecast)
EUR/USD: Down - If both sectors perform better than expected, this might signal a stronger US economy, potentially leading to a stronger Dollar.
GBP/USD: Down - Similar to EUR/USD, a stronger US economic outlook could weaken GBP against USD.
USD/JPY: Up - Improved US PMI data might strengthen USD against JPY, especially if this leads to expectations of a tighter Fed policy.
Scenario 2: Both PMIs Worse than Forecast
Actual Manufacturing PMI: 48.0 (Worse than 48.8 forecast)
Actual Services PMI: 54.0 (Worse than 55.2 forecast)
EUR/USD: Up - If both sectors disappoint, this could indicate economic weakness in the US, leading to a weaker USD.
GBP/USD: Up - Weaker US data might make GBP relatively stronger, especially if UK economic indicators are not as disappointing.
USD/JPY: Down - A disappointing PMI might lead investors to question the US economic recovery, potentially weakening USD against JPY.
The Fib is just an example if we was to see a sell off it may come into play. If we not seeing a sell off the Fib will be non existent.
PMI
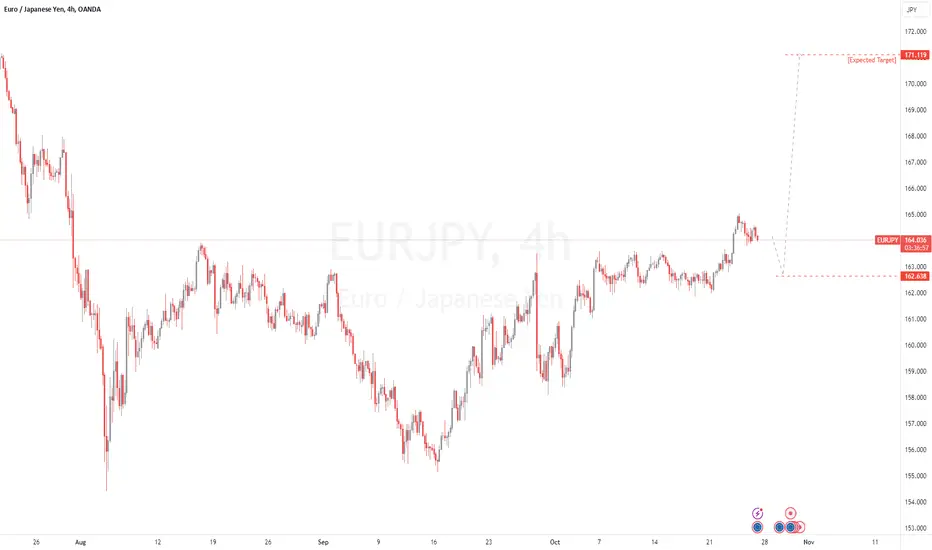
EURJPY SHORT: PMI Data came out lower than expectedEuro slumps to near two-year low as PMI data disappoints.
Eurozone November flash services PMI 49.2 vs 51.6 expected
Trade happened to fast to post beforehand.

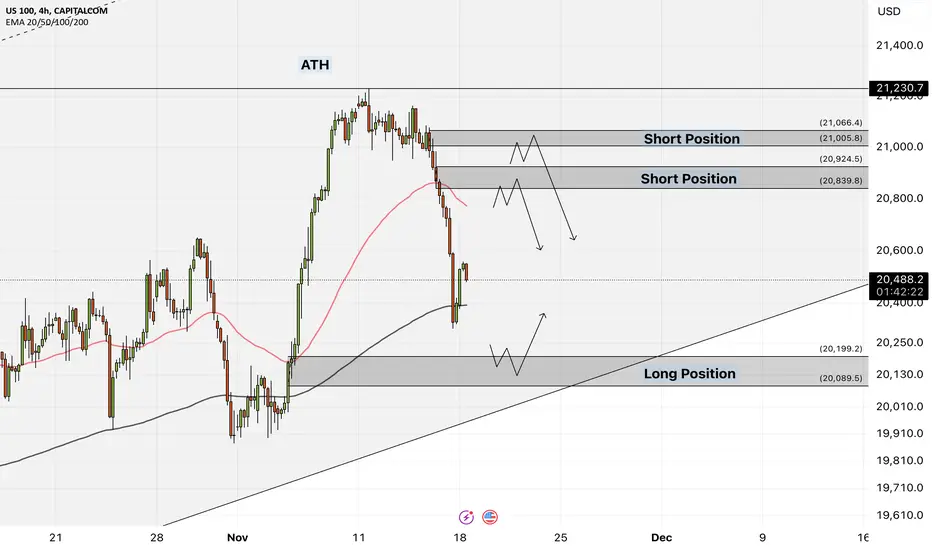
NAS100 - Nasdaq will reach above 21,000?!The index is located between EMA200 and EMA50 in the 4H timeframe and is trading in its ascending channel. If the index rises towards the two specified supply zones, you can look for NASDAQ sell positions with the appropriate risk reward. Nasdaq's buying position is in the demand zone after the continuation of the corrective movement, and considering the downward sentiment at the end of the week, it should be saved quickly.
China’s Export Restrictions and Their Impact on Global Supply Chains
• China Tightens Export Controls:
Starting December 1, China will implement new regulations to tighten export restrictions on critical metals and raw materials, including tungsten, graphite, magnesium, and aluminum alloys, essential for the technology sector.
• China’s Objectives:
These measures are part of a broader strategy to manage sensitive exports and protect national interests.
• Global Market Impact:
The new restrictions are expected to disrupt global technology supply chains and introduce volatility in related markets.
Zelensky’s Perspective on Trump’s Presidency
• Zelensky’s Comments:
Ukrainian President Volodymyr Zelensky stated that the war in Ukraine could end sooner if Donald Trump returns to the White House.
• Constructive Interaction with Trump:
Zelensky emphasized that Ukraine successfully communicated its vision for peace to Trump, and he observed no opposition from Trump regarding Ukraine’s stance.
• Implications of Zelensky’s Remarks:
These comments reflect Ukraine’s hope for continued international support to expedite the resolution of the conflict.
US Economic Forecasts
• Q3 Earnings Reports from Major Companies:
This week, companies such as NVIDIA and TARGET will release their third-quarter (Q3) earnings reports.
• Federal Reserve Rate Cuts:
Rick Rieder, Chief Investment Officer at BlackRock, predicts that the Federal Open Market Committee (FOMC) will cut interest rates by 25 basis points in December.
• The current Federal Funds rate range is 4.5% to 4.75%, which Rieder considers restrictive.
• Following the December cut, the Fed is expected to pause temporarily to reassess future adjustments.
Jerome Powell’s Statements and Market Reactions
• Powell on a Strong US Economy:
Federal Reserve Chair Jerome Powell highlighted the robust performance of the US economy, stating there is no urgency to lower interest rates.
• Cautious Approach to Rate Cuts:
Powell stressed that decisions should be made carefully due to uncertainties surrounding the neutral rate level.
• Market Reaction:
These statements reduced market expectations for a rate cut in December.
EURJPY | MarketoutlookThe policy divergence between the US Fed and SNB supports the pair at lower levels.
Jobless claims dropped to 227,000 for the week ending October 19, down from 242,000 the week before, suggesting some stability in the labor market. The four-week moving average rose by 6,750, reaching 231,000, which indicates that jobless claims are still showing fluctuations despite the recent decline.
The S&P Global Flash U.S. Manufacturing PMI increased slightly to 47.8 in October, up from 47.3 in September. However, this still shows that manufacturing activity is contracting for the fourth month in a row. On the other hand, the Flash Services PMI rose to 51.5, indicating modest growth in the services sector, which is important since it makes up a large part of the U.S. economy.
OIL: Three days breakout long on the marketHi everyone and welcome to my channel, please don’t forget to support all my work subscribing and liking my post, and for any question leave me a comment, I will be more than happy to help you!
“Trade setups, not movements”
1. DAY OF THE WEEK (Failed Breakout, False Break, Range Expansion)
Monday DAY 1 Opening Range
Tuesday DAY 2 Initial Balance
Wednesday DAY 3 (reset DAY 1) Mid Point Week
Thursday DAY 2
Friday DAY 3 Closing Range ✅
2. SIGNAL DAY
First Red Day
First Green Day
3 Days Long Breakout ✅
3 Days Short Breakout
Inside Day
3. WEEKLY TEMPLATE
Pump&Dump
Dump&Pump ✅
Frontside ✅
Backside
4. THESIS:
Long: that's my primary thesis, let's analyse the current market condition.
- Monday opened with a huge gap breaking through the previous low of week, establishing as well the high low of the new week (opening range).
- Tuesday, it almost consolidated the full day, not really interesting in terms of trading activity.
- Wednesday, the market performed the first breakout of the week, breaking the HOW, triggering long traders in the market and closing out of balance (an interesting signal)
- Thursday closed again out of balance, long traders are potentially driving this move.
- Today, Friday, the market has good chances to go reaching and targeting the closing price of last Friday, why ? because traders shorting the beginning of the week are still in profit and stops are placed above that level. After PMI 10am, if the market will setup for a buy low opportunity around the current level (yesterday HOD or London low), I will be willing to take this trade.
Short: at the moment not really into this scenario, but however, the market could retest the current high of day, failing for a reversal, day 3 longs in the market it can reverse for major move, but I repeat, the current setup is potentially long!
Please note that the purpose of my analysis is to help me and you hunting the best trade setup for the day, none of my technical aspects are a way to forecast any directional market movement.
Gianni

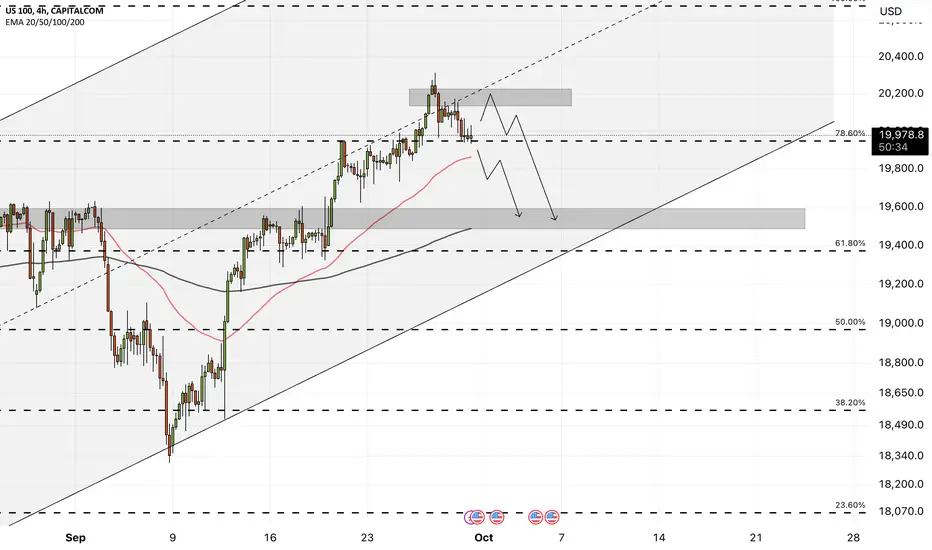
The stock market is waiting for the release of PMI and NFP!The index is above the EMA200 and EMA50 in the 4H timeframe and is trading in its ascending channel
If the index rises towards the supply zone, which is also at the intersection with the weekly pivot and the midline of the channel, you can look for sell positions in the Nasdaq index
A valid breakout of the downward drawn Fibonacci retracement will provide a downward path for the indicator to the specified support area and then the bottom of the ascending channel
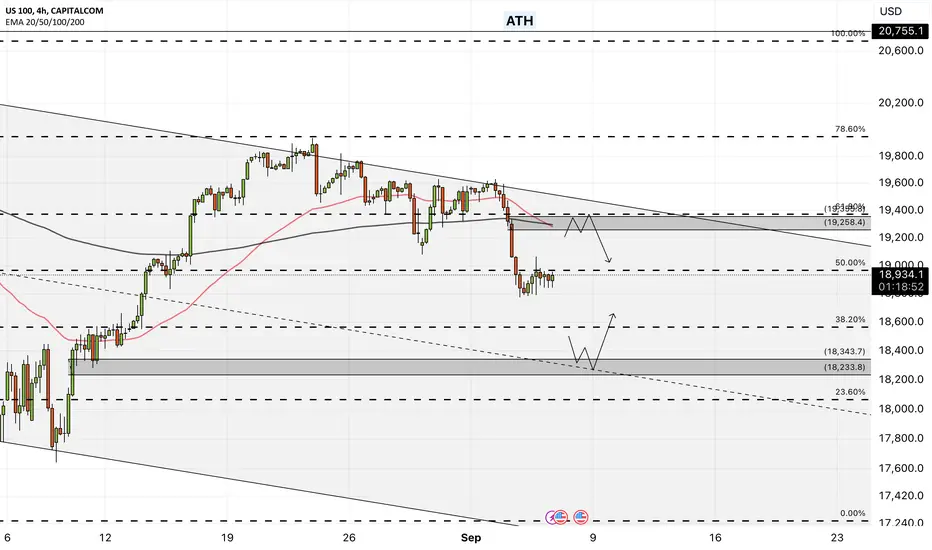
Nasdaq - Very weak start of the stock market in September!The US100 is below the EMA200 and EMA50 in the 4H time frame and is trading in its descending channel
The index has reached the target of the downward movement of its previous analysis, and you can save a part of your sales position and place your SL in profit
If the index continues to decline towards the specified demand zone, which also intersects with the midline of the descending channel, we can look for buying positions for the Nasdaq index
An upward price correction of the index will provide us with new sales position with a suitable risk reward
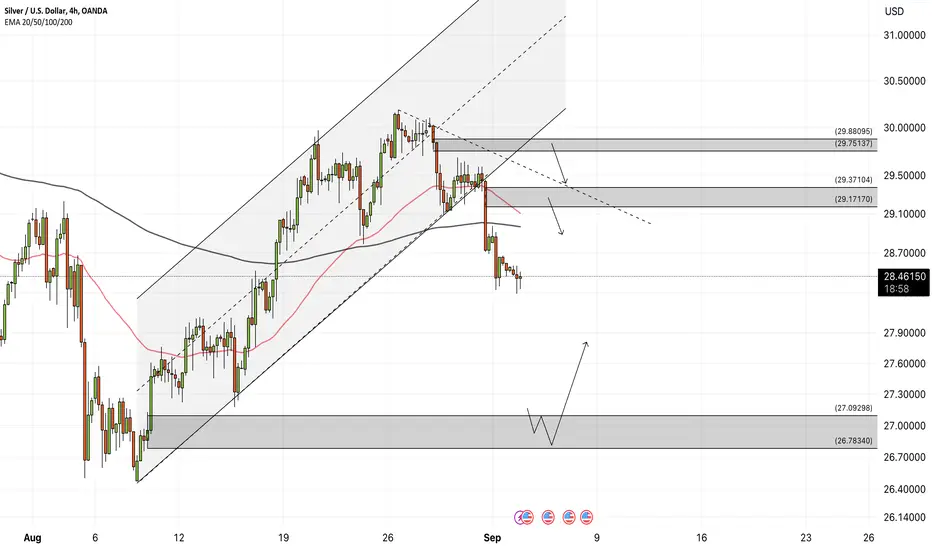
XAGUSD - Silver will go below 28 dollars?!Silver has been below the EMA200 and EMA50 in the 4H timeframe and has exited its ascending channel
If the downward movement continues and silver is placed in the specified demand zone, we can look for silver buying situations
Silver's upward correction will provide us with new sell positions with appropriate risk-reward
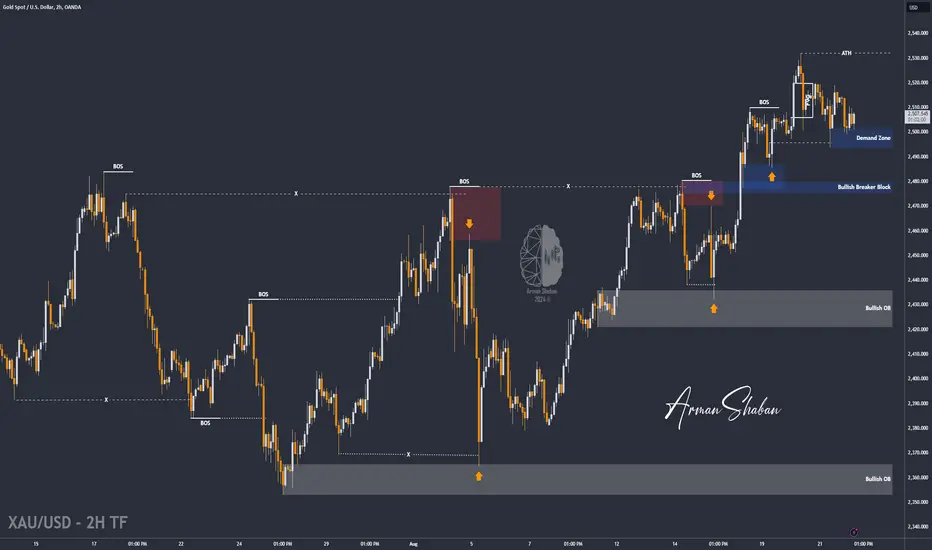
XAU/USD : More Bullish Move Ahead ? (READ THE CAPTION)By reviewing the #gold chart on the 2-hour timeframe, we can see that, as expected, the price sharply corrected to fill the FVG that had formed between $2506 and $2520. After entering the demand zone at $2506, gold experienced a strong upward movement, pushing back up to $2520! This analysis resulted in a gain of over 380 pips. Currently, gold is trading around $2505, and if it can stabilize above $2495, we can anticipate further growth. Otherwise, we may see a decline in gold prices to levels below $2490.
The Main Analysis :
Please support me with your likes and comments to motivate me to share more analysis with you and share your opinion about the possible trend of this chart with me !
Best Regards , Arman Shaban
((2+4+7+13+15+18+26+36+38+69+87+101+183+209+1000+1002+1000000000+1000000001+ 1000000853)^♾️*69) + 1 !
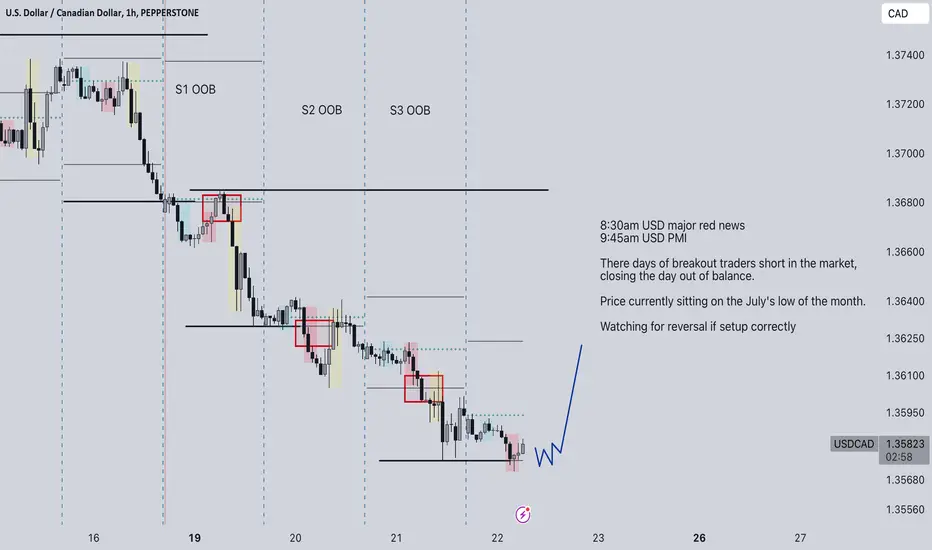
USDCAD: Three days short traders on the market, out of balanceHi everyone and welcome to my channel, please don’t forget to support all my work subscribing and liking my post, and for any question leave me a comment, I will be more than happy to help you!
“Trade setups, not movements”
1. DAY OF THE WEEK (Failed Breakout, False Break, Range Expansion)
Monday DAY 1 Opening Range
Tuesday DAY 2 Initial Balance
Wednesday DAY 3 (reset DAY 1) Mid Point Week
Thursday DAY 2 ✅
Friday DAY 3 Closing Range
2. SIGNAL DAY
First Red Day
First Green Day
3 Days Long Breakout
3 Days Short Breakout ✅
Inside Day
3. WEEKLY TEMPLATE
Pump&Dump
Dump&Pump ✅
Frontside
Backside ✅
4. THESIS:
Long: primary, considering the levels (low of the week, July low of the month, low of day), the signal three days breakout short traders in the market, and three session setup which it looks like setting for a long trade, I would be willing to expose risk in this trade after 9:45am PMI news release. Because of MRN, this market can potentially start a move back to the current HOW.
Short: secondary, this kind of signal not necessary lead to a reversal, I will leave the 3 session setup to drive this move.
Please note that the purpose of my analysis is to help me and you hunting the best trade setup for the day, none of my technical aspects are a way to forecast any directional market movement.
Gianni
GBP/USD Key Points
Tuesday’s UK Construction PMI came in above expectations at 55.3, the highest reading in more than two years
Time will tell whether traders are overly optimistic that the BOE will be able to cut rates relatively slower than its major rivals or whether more rate cuts still need to be discounted
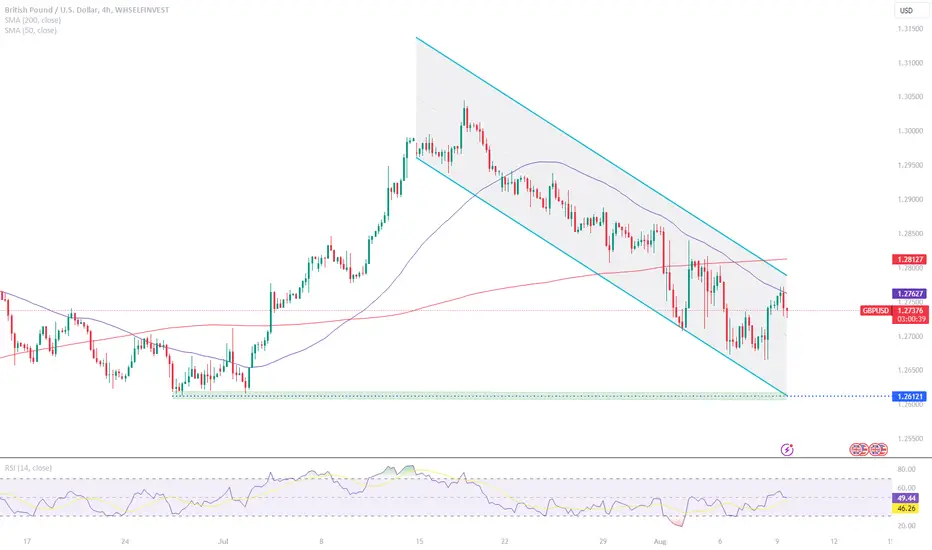
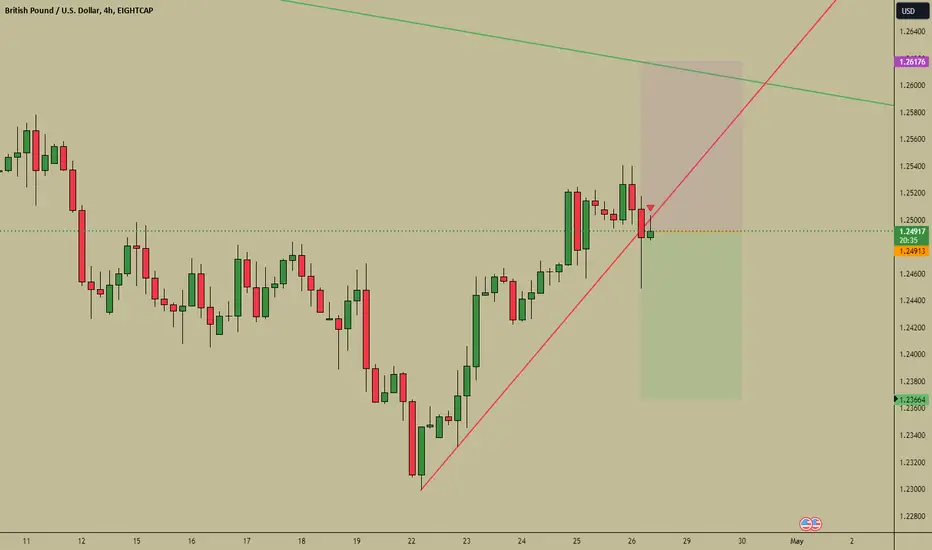
GBP/USD’s bias remains to the downside and traders may look to sell this rally as long as rates remain below 1.2760 and the RSI holds below the 50 level.
In an eerily quiet week for UK economic data, GBP/USD has been taking its signal from developments elsewhere and general risk trends. The only notable data release this week was Tuesday’s Construction PMI, which came in above expectations at 55.3, the highest reading in more than two years.
Despite the strong reading (admittedly on a second- if not third-tier economic indicator), sterling has struggled to get into gear this week. Outside of the Swiss franc, the British pound is the weakest major currency since Sunday’s open.
This weakness has emerged despite the BOE being one of the least dovish major central banks looking forward. According to Bloomberg data, OIS traders are pricing in just 44bps of interest rate cuts from the Bank of England this year, or a bit below two 25bps rate cuts, compared to roughly 100bps (four 25bps rate cuts) and 68bps (almost three 25bps rate cuts) for the Fed and ECB respectively. Time will tell whether traders are overly optimistic that the BOE will be able to cut rates relatively slower than its major rivals or whether more rate cuts still need to be discounted, potentially keeping GBP/USD under pressure.
British Pound Technical Analysis – GBP/USD 4-Hour Chart
Turning our attention to the chart, GBP/USD remains in its 4-week bearish channel, despite the big rally during the first half of today’s US session.
One tool that traders can use to help handicap when a trend may break is the RSI indicator. In this case, the 14-period RSI on GBP/USD’s 4-hour chart has been stuck in a well-defined range between 30-50 since shortly after the bearish channel formed, signaling consistent, but not excessive, bearish momentum. Accordingly, bulls may want to watch to see if the RSI can break above the 50 level to either foreshadow or confirm a breakout in the exchange rate itself.
For now though, the bias remains to the downside and traders may look to sell this rally as long as rates remain below 1.2760 and the RSI holds below the 50 level.
-- Written by Matt Weller
#Bitcoin & The business cycle are intertwined!In the bottom pane is the US Purchasing managers index number
a number below 50 ( and nearly all the time below 47) means a recession/ economic slowdown is looming.
But as you can see on the rebound , as the PMI number moves above 50 and back into a expanding economy
we have seen it coincide with the great bitcoin bull markets.
Let's hope this trend continues.

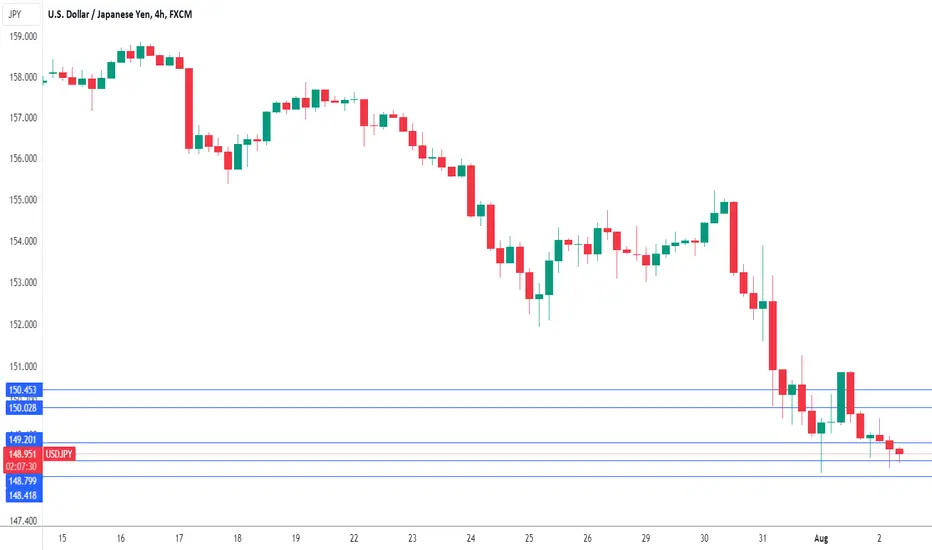
USD/JPY – Surging yen improves to 15-week highThe Japanese yen continues to rally. USD/JPY is trading at 148.86 in the European session, down 0.31% on the day at the time of writing. On Thursday, the yen strengthened as much as 148.50, its best showing since May 11.
Only three weeks ago, the yen looked dead in the water. USD/JPY was trading just shy of 162, its highest level in almost four decades. Since then, the yen has been on an absolute tear, rising a staggering 7.9%, including 3.1% this week.
What is driving the yen’s spectacular turnaround? First, the Bank of Japan raised interest rates this week to 0.25%. Although rates remain at low levels, this rate increase, the second since March, indicates that the BoJ is slowly making the shift to normalization after decades of an ultra-loose accommodative policy.
The BoJ also announced it would taper its bond purchases, which is another tightening step.
Second, investors have become less enthusiastic about the US dollar now that a September cut is looking very likely and are looking to park their assets elsewhere.
The US economy is showing some signs of weakness, such as this week’s ISM manufacturing PMI for July, which posted the sharpest contraction since November 2023. This has driven funds away from the US dollar towards safe-haven assets such as the yen. Today’s nonfarm payrolls are expected to fall from 206 thousand to 175 thousand, which could further boost the yen at the expense of the US dollar.
This week’s BoJ rate hike showed that change is afoot in Japan and the government’s annual white paper on economic and fiscal policy, which was released today, supported that view. The white paper said that Japan was showing signs of breaking out of deflation, noting that businesses were now passing on costs to consumers due to increased costs from the yen’s sharp decline.
.
USD/JPY continues to break below support levels. Earlier, it pushed below support at 149.19 and is testing support at 148.72. Below, there is support at 149.59
150.03 and 150.44 are the next resistance lines
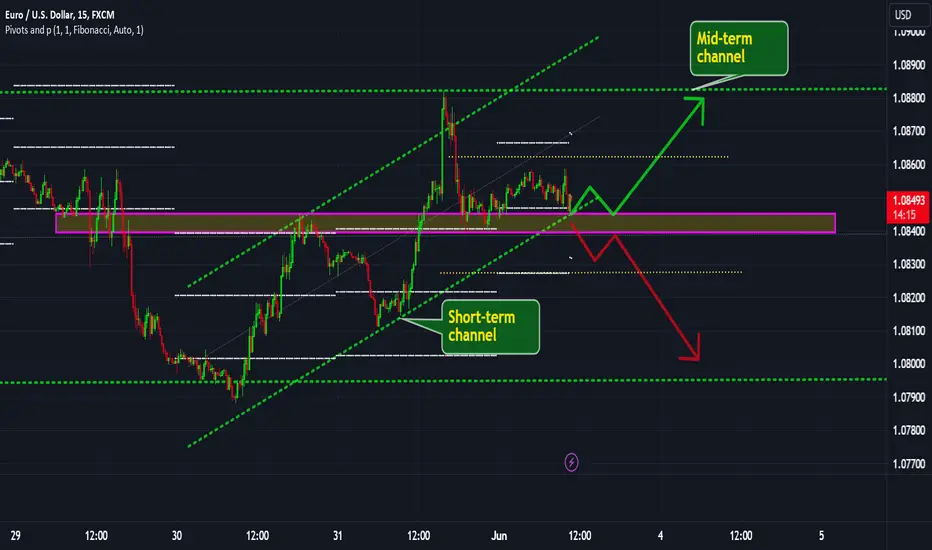
EURUSD: IntradayDear traders!
A mid-term channel is clear in the chart.
A short-term channel is also there! Any breaking below the bottom of short-term channel is hunting liquidity as long as we are perfectly over the zone!
Any breaks below the zone alter the bearish scenario! Remember that Final Manufacturing PMI release if USA could change the market direction.
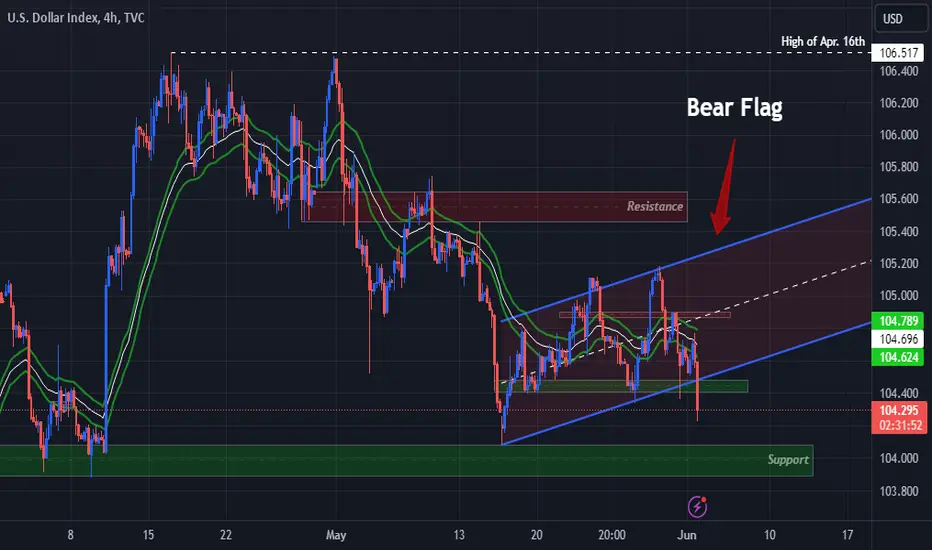
DXY Flagging Down 103 Soon?!Here I have DXY on the 4Hr Chart!
Price has been in quite a Downtrend since the High @ 106.517 and now with the appearance of what seems to be a BEARISH BREAK of an ASCENDING CHANNEL which if we get a VALID BREAK and CLOSE out of this Channel .. This is signs of a Strong Continuation pattern, the BEAR FLAG!
The Big Push behind this weakness comes in with the disappointing ISM Manufacturing PMI's showing quite a bit of Contraction!
Final ISM Manufacturing PMI - 51.3 Actual v 50.9 Forecast
ISM Manufacturing PMI - 48.7 Actual v 49.8 Forecast
ISM Manufacturing Prices - 57 Actual v 60 Forecast
*To Validate this Pattern, we need to see a STRONG CLOSE outside with a SOFT RETEST of the Break!
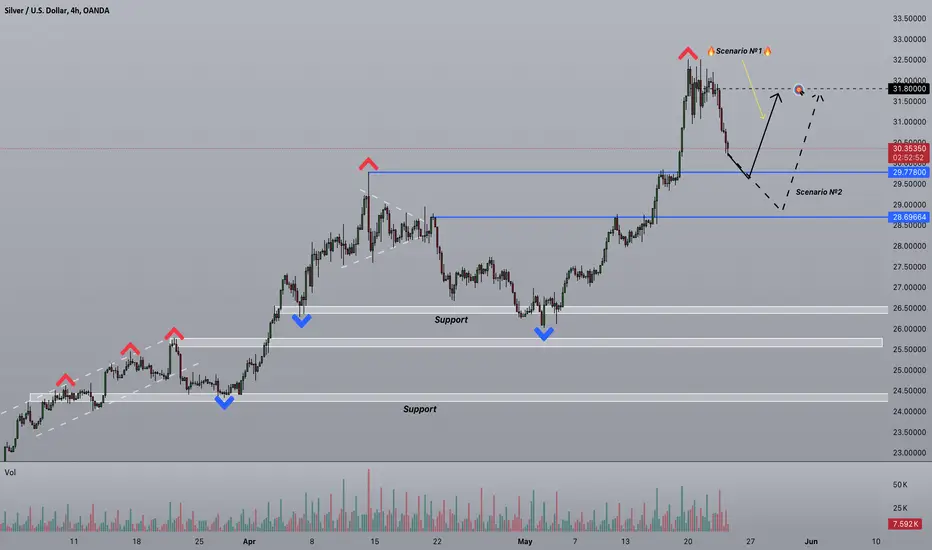
Strifor || SILVER-23/05/2024Preferred direction: BUY
Comment: After yet another historical and local record for metals , this market began to correct faster than currency pairs. In silver , in particular, we have recorded a local maximum and are now confidently moving towards the support level of 29.77800 . Near this level, we consider long according to scenario №1 , taking into account the context. We also do not exclude scenario №2 , which involves buying at the 29.00 level. In both cases, we do not consider the target above the level of 31.80 , where this correction started.
Additional comments on this trade will be provided as situation changes. Follow us!
Thank you for like and share your views!
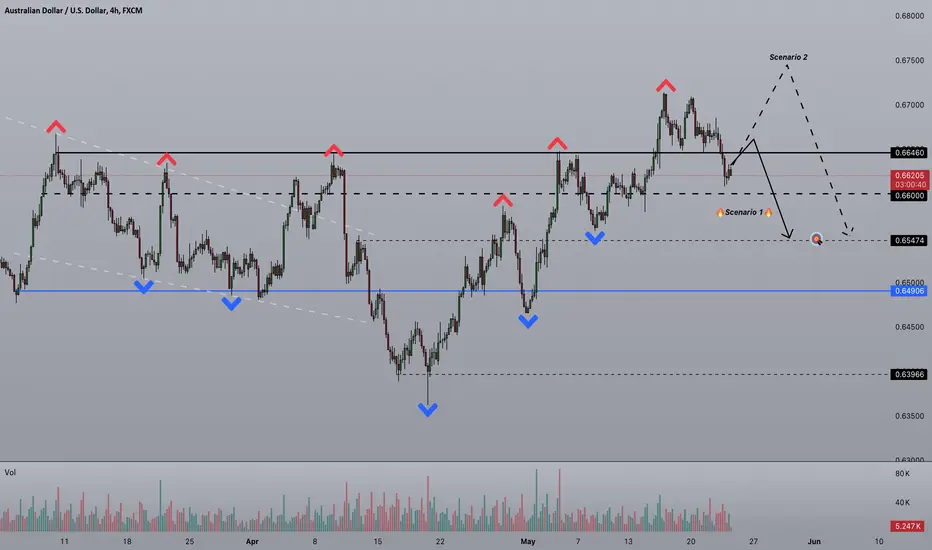
Strifor || AUDUSD-23/05/2024Preferred direction: SELL
Comment: We did not see another short-term growth in the Australian dollar , as a result of which we had to abandon this idea, and today it is most likely better to consider this instrument more from the seller’s point of view. The most likely maneuver in favor of the seller will most likely develop from the level of 0.66460 , which will most likely become resistance again (scenario №1) . However, a close above this level, especially on the daily chart, will immediately restore confidence in buying, and selling will have to wait.
Scenario №2 is more conservative, according to which you should look for a sale near the level of 0.67500 , after updating the local maximum.
Additional comments on this trade will be provided as situation changes. Follow us!
Thank you for like and share your views!
Macro Monday 45~The China Caixin PMI (Manu, Serv & Composite)Macro Monday 45
The China Caixin PMI
(Services and Composite released Today Monday)
Last week week we looked at the China Caixin Manufacturing PMI which will revise today with its updated readings that were released last Tuesday.
We will also look at the China Caixin Services PMI and the Caixin Composite PMI (a combination of the Services and Manufacturing PMI's) as these will both be released later today.
1.Manufacturing PMI – Already released
2. Services PMI – Released Today 6th May 2024
3. Composite PMI Released Today 6th May 2024 (both 1 + 2 combined)
What is the Caixin PMI?
▫️ The is an S&P Global report released monthly.
▫️ The Caixin PMI focuses on small & medium sized enterprises (SME’s) in China.
▫️ Surveys a small sample size of 650 private and state owned manufacturers and service providers.
Why Focus on China PMI's?
China, the 2nd largest economy in the world at approx. $18 trillion is often referred to as the world’s manufacturing superpower. In 2019, the Chinese manufacturing sector contributed nearly $4 trillion towards the country’s total economic output. Manufacturing accounted for almost 30% of China’s GDP during 2019 demonstrating the importance of manufacturing and the surveys completed by the manufacturers through the Purchaser Managers Index (PMI) surveys. Incredibly, in 2023 China’s manufacturing continued to increase and contributed 31.7% to China GDP, furthermore China’s exports reached record highs of $3.36 trillion. For a country that gets a lot of bad economic press, the economic data from manufacturing and exports suggests China is adaptable and is currently in expansionary territory. This will be further evident from the PMI charts we are about to review also.
Like most PMI’s the data will generally be derived from the following sub indicies; New Orders, Output, Employment, Supplier Deliveries and Inventories.
Reading both PMI’s:
>50 indicates expansion in the manufacturing sector compared to the previous month.
< 50 represents contraction
A reading of 50 indicates no change.
The Charts
China Caixin Manufacturing PMI - APR 2024
✅51.4 = Expansionary (>50 is expansionary)
▫️ Increased from 50.9 in Feb 2024 to 51.1 in Mar 2024
▫️ Increased from 51.1 in Mar 2024 to 51.4 in Apr 2024 – Figures for April were released on the 30th April 2024 (last week).
✅The Caixin Manufacturing PMI has remained expansionary for 6 consecutive (Nov 2023 – Apr 2024). It has been on a long term recovery since the Feb 2020 lows of 40.3, since then making a series of higher lows and recently sustaining 6 months of expansionary readings.
China Caixin Services PMI - Mar 2024
✅52.7 = Expansionary (>50 is expansionary)
⏳ April Figures released today (pending)
▫️ Increased from 50.2 in Sept 2023 to 52.7 in Mar 2024
▫️ Increase/decrease from 52.7 in Mar 2024 to ??? in Apr 2024 – Figures for April are released on today Monday 6th April 2024.
✅The Caixin Services PMI has remained expansionary for 15 consecutive months (Jan 2023 – Mar 2024). It has been on a long term recovery since the Feb 2020 lows of 26.5 when services took a huge hit during COVID-19 lockdowns, since then making a series of higher lows and recently sustaining 15 months of expansionary readings.
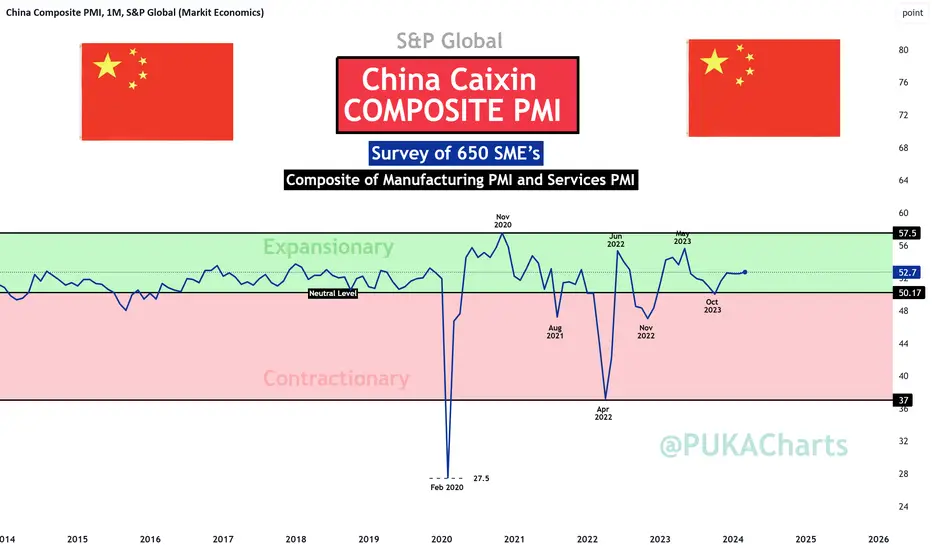
China Caixin COMPOSITE PMI - Mar 2024
✅52.7 = Expansionary (>50 is expansionary)
⏳ April Figures released today (pending)
THIS IS THE SUBJECT CHART AT OUTSET
▫️ Increased from 50 in Oct 2023 to 52.7 in Mar 2024
▫️ Increase/decrease from 52.7 in Mar 2024 to ??? in Apr 2024 – Figures for April are released on today Monday 6th April 2024.
✅The Caixin Composite PMI has remained expansionary for 5 consecutive months (Nov 2023 – Mar 2024). It has been on a long term recovery since the Feb 2020 similar to Manufacturing and Services PMI charts above. Looking at the composite chart, one can see that we moving sideways since Dec 2023 (Dec 52.6, Jan 52.5, Feb 52.5 & Mar 52.7). We are comfortably in the expansionary green zone on the composite.
In Summary
(subject to tomorrow’s readings for the Services and Composite PMI but we assume expansionary)
China Caixin Manufacturing PM I
↗️ Expansionary
The Caixin Manufacturing PMI for April 2024 rose to 51.4, marking the sixth straight month of expansion and the fastest growth since February 2023
China Caixin Services PMI
↗️ Expansionary
As of March 2024, the Caixin Services PMI increased slightly to 52.7, indicating growth in the services sector for the 15th consecutive month
(April 2024 Figures Release Today)
China Caixin COMPOSITE PMI
↗️ Expansionary
The Composite PMI reached 52.7 in March 2023, the highest since May 2023, showing the fifth consecutive month of growth in overall private sector activity.
(April 2024 Figures Release Today)
All the above readings suggest a continued expansion across China’s services and manufacturing sectors, reflecting improvements in demand and business activity across the SME cohort.
All these charts are available on my Tradingview Page and you can go to them at any stage over the next 5 - 10 years press play and you'll get the chart updated with the easy visual guide I provided. I hope its helpful
Lets get after it again this week 💪🏻
PUKA
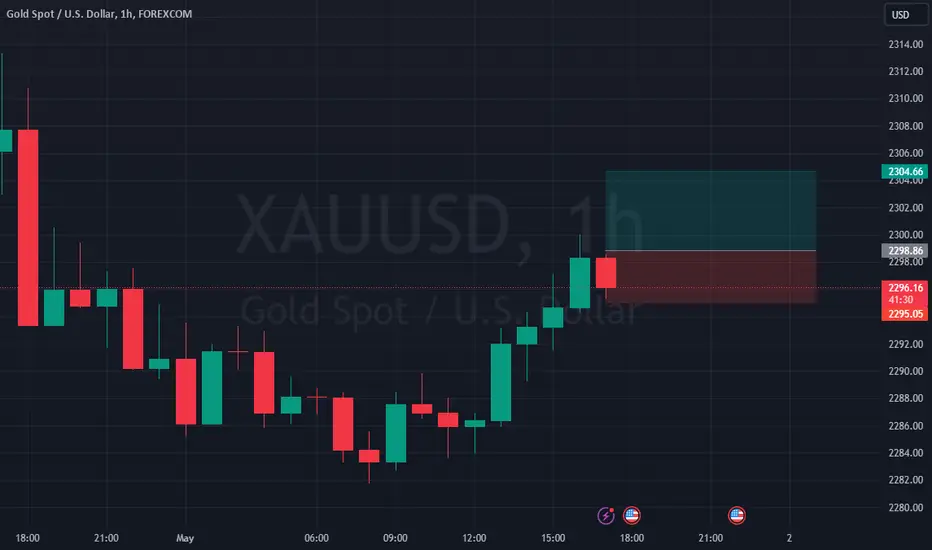
Gold Long PositionI'm going to take this long position as it's closed higher than my key level and I see a nice bottom wick.
I expect Final Manufacturing PMI and ISM Manufacturing PMI to higher the Gold up to my TP point, then see a correction!
Let's see
GBPUSD Short Fundamental + Technical AnalyzeFundamentals : This weeks GBP PMI coupled with USD Unemployment claims and Core PCE has sent the Dollar rallying while GBP has been in some consolidation until today.
Technical : From a Technical point GBP broke the Bearish Trendline at the same time the Dollar was rallying from news, GBP later retraced some of the sell off and retested the Bearish Trendline it broke earlier which is where the short opportunity become available. Target around a 1% move or check to see when the Dollar takes out its high around 106.5
Macro Monday 44~China NBS PMI & Manufacturing Caixin PMIMacro Monday 44
The China NBS PMI and Manufacturing Caixin PMI
(both released Tuesday 30th April 2024)
China NBS General PMI – Surveys by 3,200 large corporations
▫️ Provided by the National Bureau of Labor Statistics
▫️ Based on a large sample size surveying 3,200 companies across China.
▫️ The NBS PMI has a stronger focus on larger state-owned firms.
▫️ Recently increased from 50.9 in Feb 2024 to 52.7 in Mar 2024 (>50 = Expansionary)
China Manufacturing Caixin PMI – Surveys by 650 SME’s
▫️ The is an S&P Global report released monthly.
▫️ The Caixin PMI focuses on small & medium sized enterprises (SME’s) in China.
▫️ Surveys a smaller sample size of 650 private and state owned manufacturers.
▫️ Recently increased from 50.9 in Feb 2024 to 51.1 in Mar 2024 (>50 = Expansionary)
N.B: The China Services Caixin PMI will be released Monday 6th May which when combined with the China Manufacturing Caixin PMI will form the all encompassing China Caixin Composite PMI. We will cover the China Services and Composite PMI next week on Monday 6th May 2024.
Both the Manufacturing Caixin PMI and the China NBS General PMI are of companies that are mostly export-orientated & located along China’s Costal Regions. These are the manufacturing and export hubs of China, the likes of major coastal regions such as Guangdong, Zhejiang, and Shanghai which have strategic access to ports and shipping routes.
China, the 2nd largest economy in the world at approx. $18 trillion is often referred to as the world’s manufacturing superpower. In 2019, the Chinese manufacturing sector contributed nearly $4 trillion towards the country’s total economic output.
Manufacturing accounted for almost 30% of China’s GDP during 2019 demonstrating the importance of manufacturing and the surveys completed by the manufacturers through the Purchaser Managers Index (PMI) surveys. Incredibly, in 2023 China’s manufacturing continued to increase and contributed 31.7% to China GDP, furthermore China’s exports reached record highs of $3.36 trillion in 2023.
For a country that gets a lot of bad economic press, the economic data from manufacturing and exports suggests China is adaptable and is currently in expansionary territory. This will be further evident from both the PMI charts we are about to review below.
Like most PMI’s the data will generally be derived from the following sub indices; New Orders, Output, Employment, Supplier Deliveries and Inventories.
Reading both PMI’s:
>50 indicates expansion in the manufacturing sector compared to the previous month.
< 50 represents contraction
A reading of 50 indicates no change.
The Charts
China NBS General PMI – Surveys from 3,200 large corporations (subject chart above)
▫️ After hitting an all time low of 28.9 in Feb 2020 from the COVID-19 pandemic, China’s NBS General PMI has experienced significant fluctuations.
▫️ The NBS PMI made two subsequent significant lows in Apr and Dec 2022 at approx. 42.6.
▫️ By March 2023, the PMI reached an all-time high of 57.0, indicating strong expansion in both manufacturing and non-manufacturing sectors.
▫️ This fell to a low of 50.3 in Dec 2023, and since then we have risen to 52.7 in Mar 2023.
🚨 Next release for April is released this Tuesday 30thApril 2024.
China Manufacturing Caixin PMI – Surverys from 650 SME’s
▫️ The China Manufacturing Caixin PMI for smaller SME’s has demonstrated a series of higher lows since February 2020 demonstrating a strong recovery out of the COVID-19 pandemic.
▫️ Momentarily reaching all time highs of 54.9 Nov 2020, thereafter falling significantly to 46 in April 2022, since then the Manufacturing Caixin has pressed into expansionary territory of 51.1 (March 2024).
▫️ This was the fifth straight month of growth in factory activity and the fastest pace since February 2023, boosted by higher new orders from domestic and abroad, with foreign sales rising the most in a year while output climbed the most since last May.
🚨 Next release for April is released this Tuesday 30thApril 2024.
Both PMI's are in expansionary territory which is positive news for China production and exports. SME's appear to have made a more gradual and measured recovery in the Caixin PMI versus the volatile nature of the large corporations in the NBS PMI. Regardless both are swinging higher towards 52 or 53 placing them in the expansionary mode.
Potential Trade Set Up
On a separate note, adding to China's expansionary potential from above economic data and the PMI charts, one of the worlds greatest traders Peter Brandt
@PeterLBrandt
recently posted a potential buy signal one of Chinas main indexes, the Heng Seng Index which looks to have formed a Head and Shoulders bottom with a recent break out (see most recent post under this one).
The Heng Seng Index (HSI) serves as a great proxy for Asian markets, its the main indicator of the overall market performance in Hong Kong and includes 82 constituent companies, representing about 60% of the total capitalization of the Hong Kong Stock Exchange. The companies in the HSI are considered blue chips and thus the index operates a good basal gauge of market sentiment in China. Definitely a chart to add to your arsenal for Asian markets.
All these charts are available on my Tradingview Page and you can go to them at any stage over the next 5 - 10 years press play and you'll get the chart updated with the easy visual guide I provided. I hope its helpful
Lets get after this week 💪🏻
PUKA

Macro Monday 43 - Japan Composite PMI Macro Monday 43
Japan Composite PMI – Japan’s Business Activity
(Flash PMI is released Tuesday 23rd April 2024)
Unfortunately, I had great difficulty in locating the Japan Composite Flash PMI in chart form on TradingView (it appears to not be available).
Instead we will briefly cover the Japan Composite PMI chart which is the final PMI released later on Tuesday 7th May 2024 (for April). We can review the Flash PMI figures that are released tomorrow regardless for an indication. The flash consists of about 90% of the final PMI input thus is a good forward view on how the final PMI will come in on the 7th May 2024.
Over the past three weeks we have covered the following three indicators for Japan:
1.Macro Monday 41 - Japan Consumer Confidence Index (CCI)
🚨 Pessimistic but with an improving long term trend. A positive ranging move from 28.6 in Nov 2022 to 39.5 in April 2024. This is the highest reading in c. 5 years, a significant milestone and trend higher. A move above 40.86 would signify a move above the historical average level of consumer sentiment (less pessimistic, as only above 50 it optimistic).
2. Macro Monday 42 - Japan Reuters Tankan Index (RTI)
✅ Business Optimism is high with the Japan Reuters Tankan Index standing at +9, down from the previous month's 10 however firmly in the positive (above zero).
3. Macro Monday 43 - Japan Composite PMI
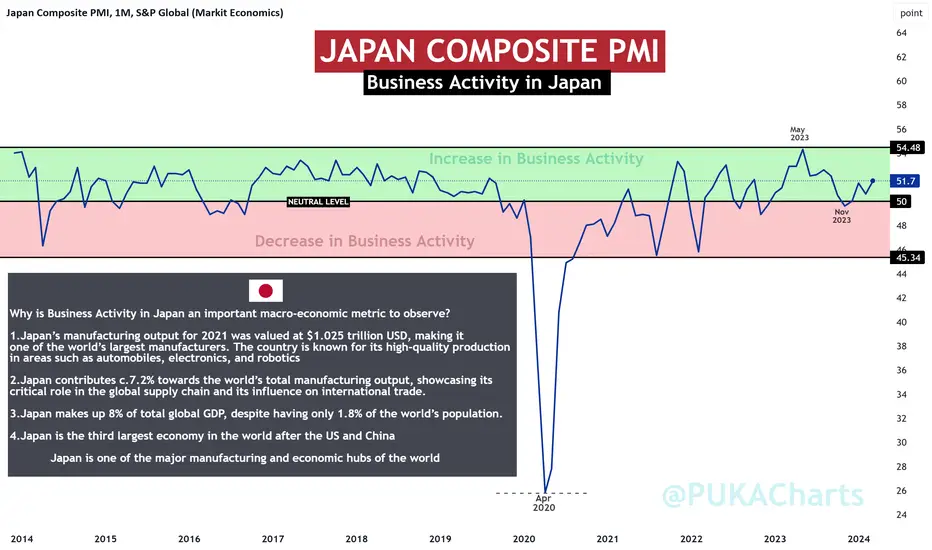
✅ THIS WEEK we take a quick look at the Japan Composite PMI which is firmly in the positive at 51.7 (above 50 is expansionary and below 50 is contractionary).
As you can see from the chart below we have been in an uptrend since Nov 2023
The Japan Composite PMI for March 2024 was 51.7, indicating continued expansion in private sector activity (businesses). This matches the optimistic business sentiment in the Japan Reuters Tankan Index. This marked the third consecutive month of growth and the strongest pace since late September in PMI. The service sector saw solid expansion, while the decline in manufacturing production softened slightly. New orders accelerated to a seven-month peak, primarily led by the service economy. Employment growth was the steepest since May 2023, and there was a marginal rise in outstanding business. Input prices expanded robustly, leading businesses to increase their selling prices at the most pronounced rate for seven months. Overall, the PMI provides insight into the health of Japan’s private sector economy
The overview of the past three weeks we covered and what they broadly tell us? 👇🏻
Japan Businesses are in expansion and optimistic whilst the Japanese Consumer remains reserved
In contrast to the positive Business Sentiment and Business Activity in Japan, the Japanese consumer is not as optimistic and appears to be trailing business behind sentiment(RTI) and activity (PMI). The Japan Consumer Confidence Index (CCI) came in at 39.5 for March. Whilst this was the highest reading in 5 years for the Japan CCI and demonstrated a trending recovery from lows of 28.6 in Nov 2022, the Japan CCI remains below its historical average level of 40.86. Despite a sizable recovery since Nov 2022, the current 39.5 suggests the Japanese Consumer is still more pessimistic than the historical average.
Whats the Japan PMI made up of?
The Japan Composite PMI is a weighted average of several key components that provide insight into the health of the private sector economy.
Here are the main components :
New Orders (30%): Measures the volume of new orders received by businesses. An increase in new orders suggests growing demand and potential future production.
Output (25%): Reflects the level of production or business activity. Higher output indicates expansion, while lower output signals contraction.
Employment (20%): Tracks changes in employment levels. A rising employment index indicates job creation and economic growth.
Suppliers’ Delivery Times (15%): Monitors the time it takes for suppliers to deliver goods or services. Longer delivery times may indicate supply chain disruptions.
Stocks of Purchases (10%): Measures inventory levels. An increase in stocks suggests businesses are building up inventories, while a decrease may indicate reduced demand.
The above components collectively provide a comprehensive view of economic conditions in Japan’s private sector
How to read the PMI chart
The Composite PMI varies between 0 and 100, with a reading above 50 indicating overall growth compared to the previous month, and below 50 indicating contraction.
PUKA
DXY update before PMI price is near the resistance 0f 104.750 >> 104.800 >> 105
now the question whether the price sweep or run through this liquidity ???
as price has made higher high and higher lows with recent bos we are looking to buy instead of going short
during the impulsive momentum candle price has left behind some bullish fvg which are pending below at the level of 103.700 level before this we have higher low (this higher low could be the liquidity
before 103,700 i dont see any major fvg or ob as of 4h time frame
price currently going all time high which need to take a pullback to fuel the upside move again
the candle formed since 27th march are mostly sideways following a trending which is another area of liquidity laying below it
