PNUT/USDT – On the Edge of Rebound or Breakdown?📌 Overview:
PNUT/USDT is currently at a major inflection point, following a prolonged downtrend and months of consolidation. The price is once again testing the key demand zone that has acted as a solid support since February 2025. Will this be the beginning of a strong bullish reversal, or the start of a deeper breakdown?
---
🧠 Price Action & Market Structure:
Since peaking around $2.50, PNUT has undergone a sharp decline, now hovering near the critical support area of $0.21–$0.23.
This zone has repeatedly acted as a historical accumulation zone, providing strong bounce reactions in the past.
A potential double bottom pattern is forming – if confirmed, it could ignite a bullish trend.
Multiple resistance levels lie ahead, creating a clear roadmap for staged recovery if momentum shifts.
---
🔼 📈 Bullish Scenario – Potential Reversal in Sight:
If the support holds and bullish structure forms (e.g., bullish engulfing, morning star, or higher high breakout), we could see:
1. A strong rebound from the demand zone ($0.21–$0.23), signaling buyer strength.
2. Upside targets:
$0.3027 (initial resistance and trend reversal confirmation)
$0.4403
$0.5951 (strong historical resistance)
$0.7674 to $1.0797 (major psychological zones)
3. A breakout with strong volume and MA crossover (if used) would further validate the trend change.
---
🔽 📉 Bearish Scenario – Breakdown Risk:
If the support zone fails and price breaks below $0.21, the bearish trend could continue:
1. A clear breakdown below the demand zone opens room to:
$0.1700 (minor support)
$0.1300
$0.1000 (historical low and key psychological level)
2. This would invalidate the potential reversal and reinforce the broader distribution phase.
---
📊 Identified Patterns:
Range-Bound / Accumulation Phase: Price has moved sideways between $0.21–$0.44 since February, suggesting accumulation by long-term players.
Potential Double Bottom: Still forming – confirmation needed via a breakout of the neckline.
Descending Trendline Resistance: Remains overhead and may act as a strong barrier if price attempts to climb.
---
🧭 Key Things Traders Should Watch:
Monitor price reaction in the current demand zone over the next few candles.
Look for volume confirmation on any breakout.
Stay aware of Bitcoin’s trend and macro sentiment, as it may influence volatility in altcoins like PNUT.
---
📝 Conclusion:
PNUT/USDT is now trading at a crucial technical level. The price reaction here will determine the mid- to long-term direction of this asset. Traders should prepare for either a strong reversal or a significant breakdown. This area offers a strategic opportunity to assess both risk and reward potential.
#PNUTUSDT #CryptoBreakout #TechnicalAnalysis #AltcoinSetup #CryptoReversal #PriceAction #SupportAndResistance #CryptoUpdate #BullishVsBearish
PNUTUSDC

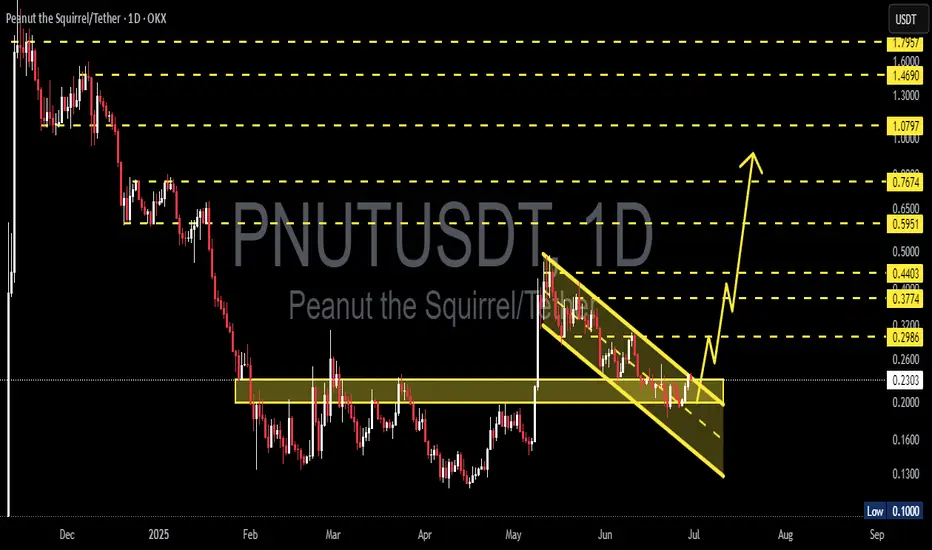
Falling Channel Breakout on PNUT/USDT – Next Stop: $0.76?📊 Pattern Analysis:
Falling Channel (Descending Channel): PNUT formed a clear falling channel from early May to late June 2025. This pattern typically signals a potential bullish reversal once a breakout occurs.
Confirmed Breakout: The price has successfully broken above the upper boundary of the falling channel, which is an early sign of a potential bullish trend.
Strong Support Zone: The horizontal zone around $0.20 – $0.26 USDT has acted as a solid demand base, as seen multiple times from March to June.
✅ Bullish Scenario:
If the breakout continues with momentum, the price could move upward gradually, aiming for the following resistance levels:
1. Target 1: $0.2986 – Minor resistance
2. Target 2: $0.3774 – Previous consolidation area
3. Target 3: $0.4403 – Major historical resistance
4. Target 4: $0.5951 to $0.7674 – Recovery zone from the falling channel
5. Extended Target (Long-Term): $1.0797 to $1.7957 (if a full rally occurs with strong bullish sentiment)
❌ Bearish Scenario:
If the price fails to hold the breakout and re-enters the channel:
Potential drop back to the support zone of $0.2000 - $0.1600
A breakdown below this range may lead to further downside toward $0.1300 to $0.1000 (previous historical low)
🔍 Summary:
The chart displays a classic bullish reversal pattern with a confirmed breakout from the falling channel.
The $0.26–$0.29 area now acts as a key confirmation zone. If the price holds above it and completes a successful retest, the bullish continuation is likely.
However, traders should stay cautious of false breakouts.
#PNUTUSDT #CryptoBreakout #AltcoinSeason #ChartAnalysis #BullishReversal #TechnicalAnalysis #BreakoutTrading #CryptoSignals #DescendingChannel
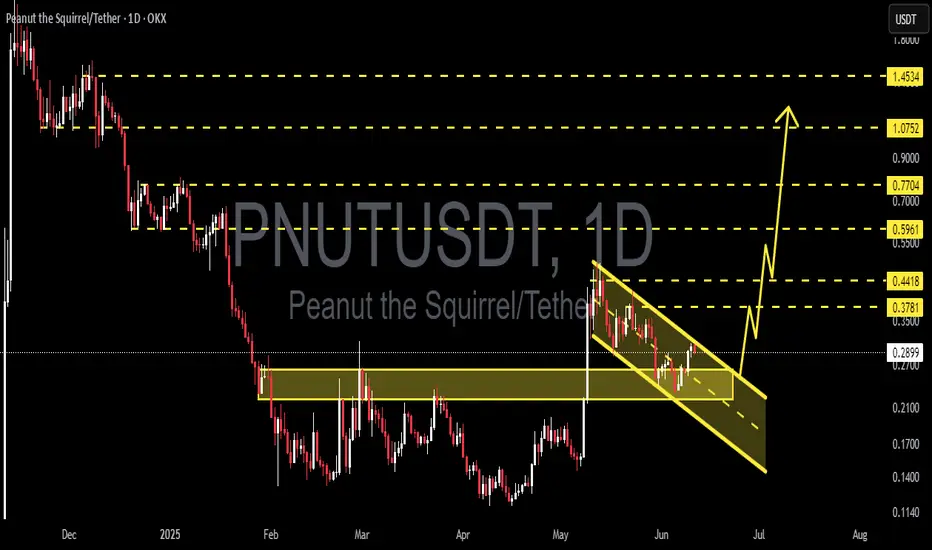
PNUTUSDT 1D Analysis PNUT ~ 1D Analysis
#PNUT Buy when retesting this support block or buy after successfully breaking this resistance line with a short-term target of at least 15%++
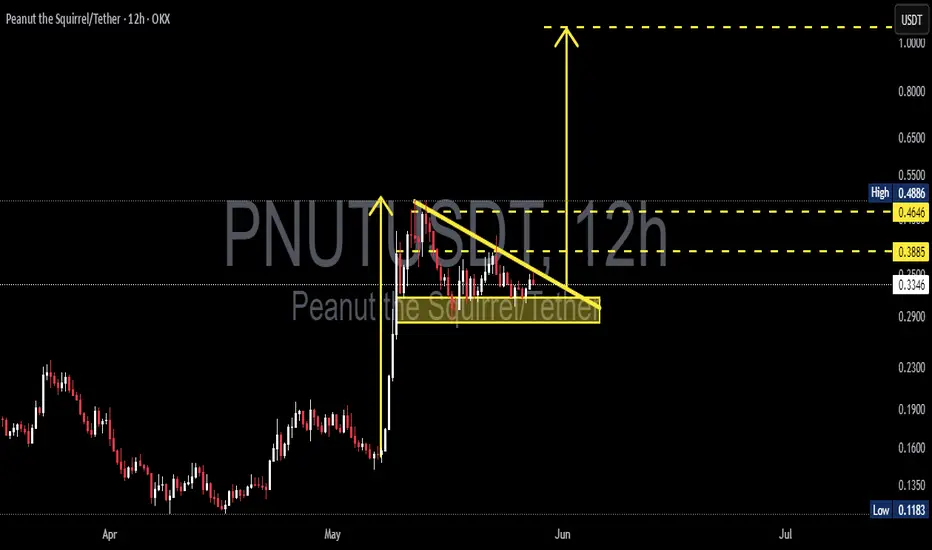
PNUTUSDT 12H AnalysisPNUT ~ 12H Analysis
#PNUT Buy after breaking this resistance line with a short term target of at least 15%+ and a long term target of $1.07++
#PNUT/USDT#PNUT
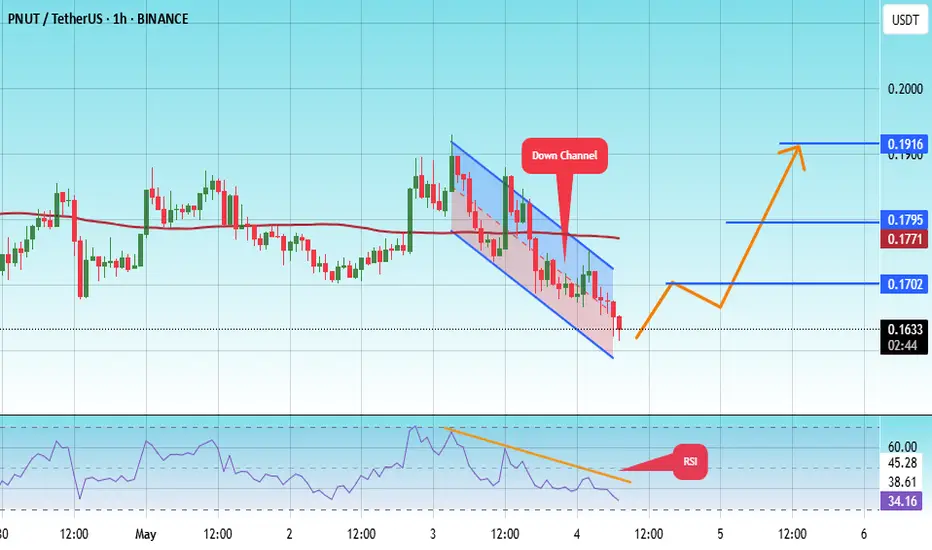
The price is moving within a descending channel on the 1-hour frame, adhering well to it, and is on its way to breaking it strongly upwards and retesting it.
We are seeing a bounce from the lower boundary of the descending channel, which is support at 0.1595.
We have a downtrend on the RSI indicator that is about to break and retest, supporting the upward trend.
We are looking for stability above the 100 Moving Average.
Entry price: 0.1633
First target: 0.1700
Second target: 0.1771
Third target: 0.1916
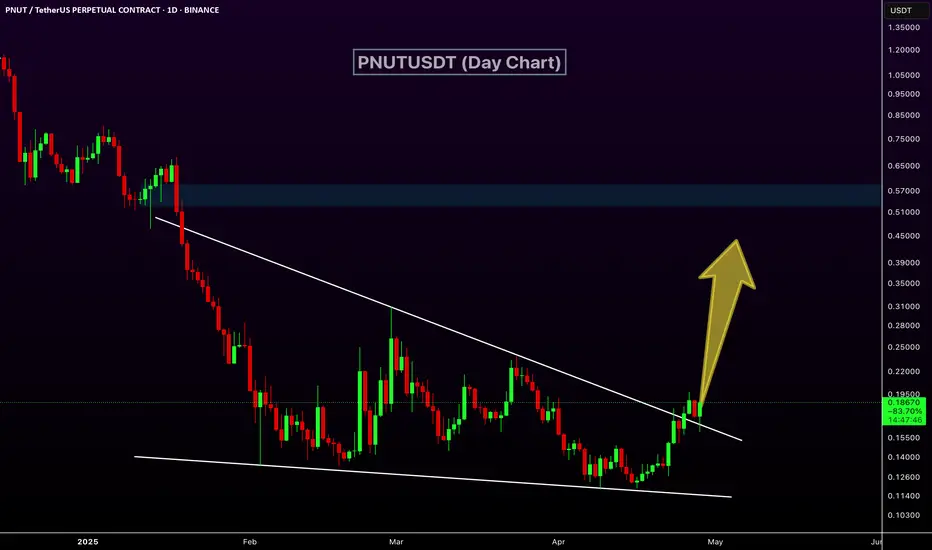
PNUTUSDT Ready to Rally!PNUTUSDT Technical analysis update
PNUTUSDT is breaking out of a wedge pattern on the daily chart after three months of formation. We also observed a bullish RSI divergence in the daily timeframe, along with a MACD bullish crossover a few days ago. A 50–100% move could be seen in the mid-term.
PNUTUSDT 1D AnalysisPNUT ~ 1D Analysis
#PNUT Buy gradually from here with a short -term target of at least 10%+ from here.

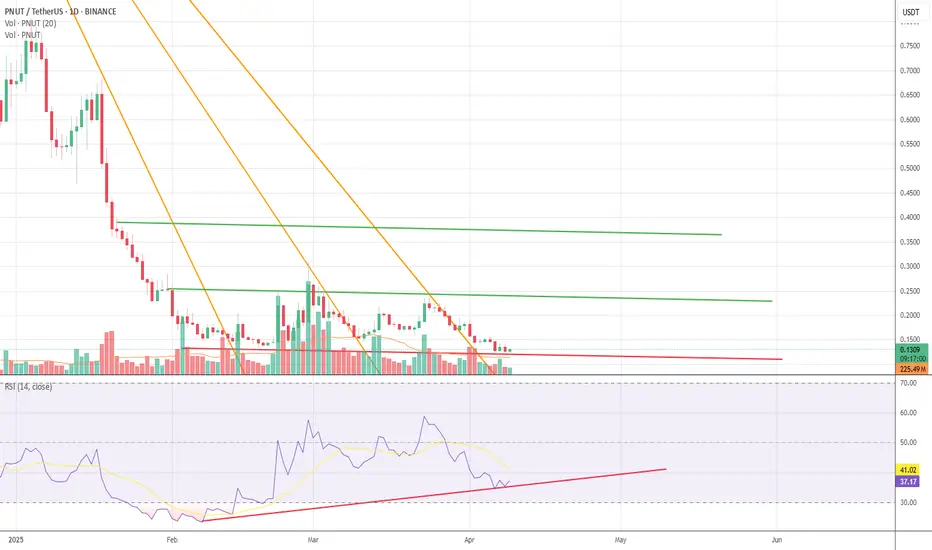
PNUT / USDT – Daily AnalysisBullish divergence spotted!
Price is printing lower lows, but RSI is making higher lows — a classic bullish divergence pattern. This signals potential trend exhaustion on the downside.
#PNUT is holding above a horizontal support level around 0.12–0.13 USDT, aligning with the divergence signal.
Volume is tapering off, indicating decreasing selling pressure.
RSI is currently around 37–38 and showing a higher low structure.
Key levels to watch:
Support: 0.1220–0.1300 USDT (current demand zone).
Resistance: 0.1650 USDT (local high), followed by stronger resistance at 0.2000–0.2200 USDT.
Scenario ideas:
If PNUT can hold above support and RSI continues climbing, we might see a relief rally towards the next resistance zones.
A breakdown below 0.1220 would invalidate this bullish setup and could lead to continuation of the downtrend. Still... bullish divergence then will become even more obvious....
Bias:
bullish short-term, watching for confirmation.
⚠️ Not financial advice. Always manage your risk!
#PNUT #Crypto #Altcoins #BullishDivergence #RSI #TradingView