PNUT/USDT – On the Edge of Rebound or Breakdown?📌 Overview:
PNUT/USDT is currently at a major inflection point, following a prolonged downtrend and months of consolidation. The price is once again testing the key demand zone that has acted as a solid support since February 2025. Will this be the beginning of a strong bullish reversal, or the start of a deeper breakdown?
---
🧠 Price Action & Market Structure:
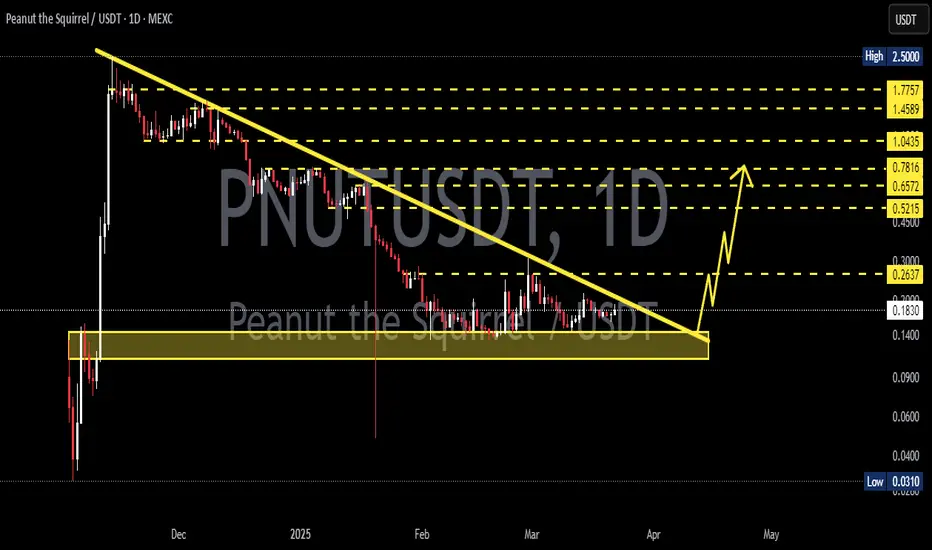
Since peaking around $2.50, PNUT has undergone a sharp decline, now hovering near the critical support area of $0.21–$0.23.
This zone has repeatedly acted as a historical accumulation zone, providing strong bounce reactions in the past.
A potential double bottom pattern is forming – if confirmed, it could ignite a bullish trend.
Multiple resistance levels lie ahead, creating a clear roadmap for staged recovery if momentum shifts.
---
🔼 📈 Bullish Scenario – Potential Reversal in Sight:
If the support holds and bullish structure forms (e.g., bullish engulfing, morning star, or higher high breakout), we could see:
1. A strong rebound from the demand zone ($0.21–$0.23), signaling buyer strength.
2. Upside targets:
$0.3027 (initial resistance and trend reversal confirmation)
$0.4403
$0.5951 (strong historical resistance)
$0.7674 to $1.0797 (major psychological zones)
3. A breakout with strong volume and MA crossover (if used) would further validate the trend change.
---
🔽 📉 Bearish Scenario – Breakdown Risk:
If the support zone fails and price breaks below $0.21, the bearish trend could continue:
1. A clear breakdown below the demand zone opens room to:
$0.1700 (minor support)
$0.1300
$0.1000 (historical low and key psychological level)
2. This would invalidate the potential reversal and reinforce the broader distribution phase.
---
📊 Identified Patterns:
Range-Bound / Accumulation Phase: Price has moved sideways between $0.21–$0.44 since February, suggesting accumulation by long-term players.
Potential Double Bottom: Still forming – confirmation needed via a breakout of the neckline.
Descending Trendline Resistance: Remains overhead and may act as a strong barrier if price attempts to climb.
---
🧭 Key Things Traders Should Watch:
Monitor price reaction in the current demand zone over the next few candles.
Look for volume confirmation on any breakout.
Stay aware of Bitcoin’s trend and macro sentiment, as it may influence volatility in altcoins like PNUT.
---
📝 Conclusion:
PNUT/USDT is now trading at a crucial technical level. The price reaction here will determine the mid- to long-term direction of this asset. Traders should prepare for either a strong reversal or a significant breakdown. This area offers a strategic opportunity to assess both risk and reward potential.
#PNUTUSDT #CryptoBreakout #TechnicalAnalysis #AltcoinSetup #CryptoReversal #PriceAction #SupportAndResistance #CryptoUpdate #BullishVsBearish
Pnutusdtlong

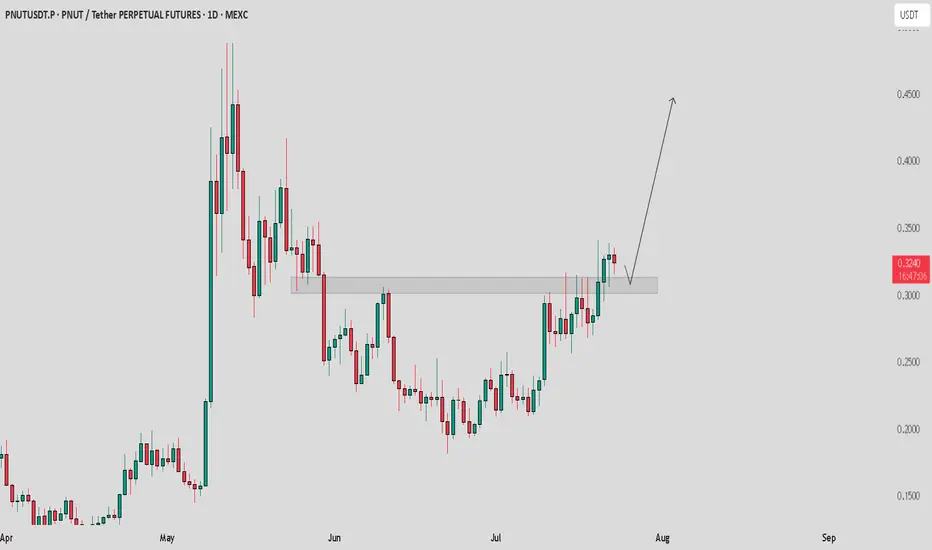
PNUT / USDT Breakout and retest analysisPnut/USDT - Breakout & Retest Analysis
Pnut/USDT has broken out from horizontal resistance, and a retest is currently in progress. If the retest holds, we can expect a strong move towards $0.4 - $0.5.
Bullish Scenario:
Successful retest and holding above the resistance zone should confirm further upside towards $0.4 - $0.5.
Bearish Scenario:
If price fails to hold the breakout level, we may see a pullback and retest of lower levels.
Pro Tip:
Avoid excessive longs. Wait for clear retest confirmation before entering.
Set proper risk management to protect your trades.
PNUT Just Broke Out – Can It Hold 0.2400?Pair: PNUT/USDT
Timeframe: 4H
Pattern: Symmetrical Triangle (Breakout Confirmed)
PNUT has broken out of the symmetrical triangle, showing early signs of bullish momentum. To confirm strength, price must now hold above the breakout zone near 0.2400.
Bullish continuation:
If it holds, we could see upside targets around 0.2700–0.3000 in the short term. Volume confirmation will be key.
Fakeout risk:
If PNUT fails to sustain above 0.2400, the breakout may fail. Stay patient for a clean retest or follow-through to avoid getting trapped.
Wait and manage risk wisely — the next few candles will confirm the move.
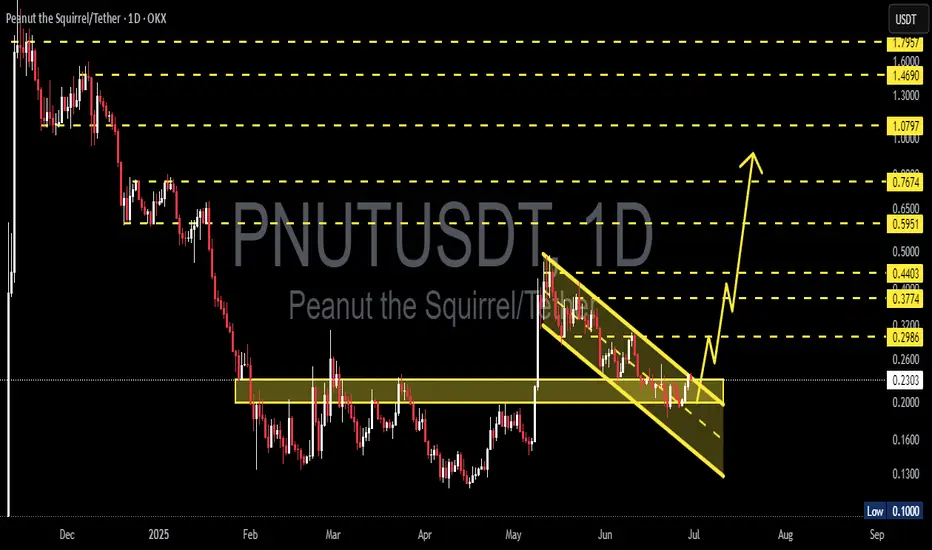
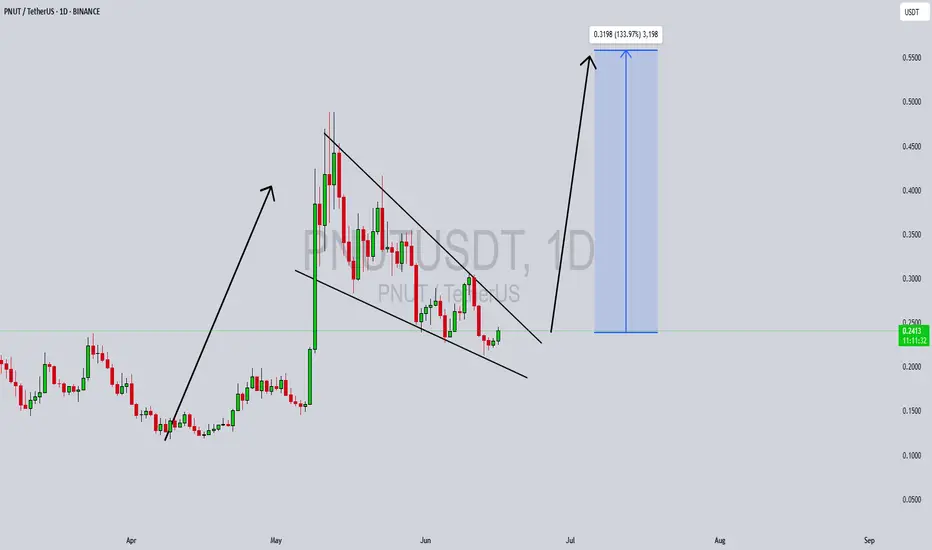
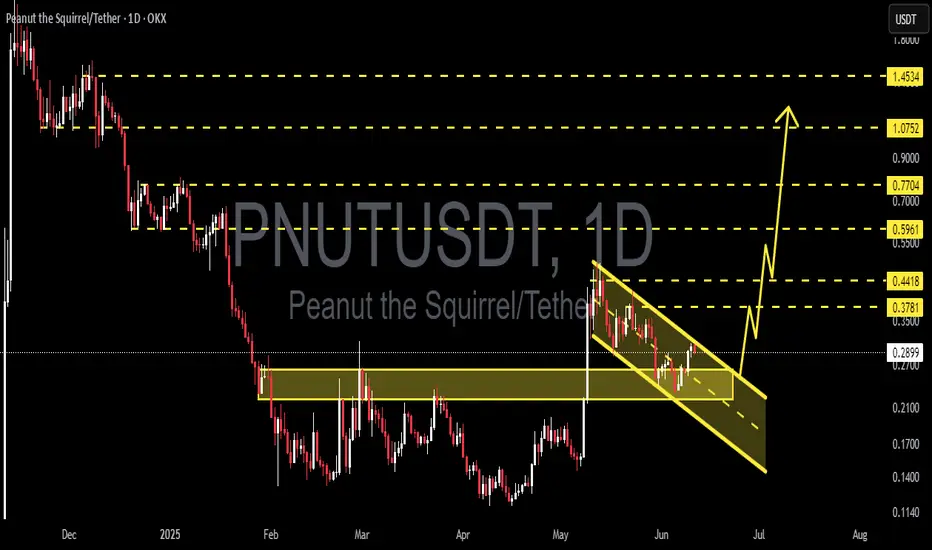
Falling Channel Breakout on PNUT/USDT – Next Stop: $0.76?📊 Pattern Analysis:
Falling Channel (Descending Channel): PNUT formed a clear falling channel from early May to late June 2025. This pattern typically signals a potential bullish reversal once a breakout occurs.
Confirmed Breakout: The price has successfully broken above the upper boundary of the falling channel, which is an early sign of a potential bullish trend.
Strong Support Zone: The horizontal zone around $0.20 – $0.26 USDT has acted as a solid demand base, as seen multiple times from March to June.
✅ Bullish Scenario:
If the breakout continues with momentum, the price could move upward gradually, aiming for the following resistance levels:
1. Target 1: $0.2986 – Minor resistance
2. Target 2: $0.3774 – Previous consolidation area
3. Target 3: $0.4403 – Major historical resistance
4. Target 4: $0.5951 to $0.7674 – Recovery zone from the falling channel
5. Extended Target (Long-Term): $1.0797 to $1.7957 (if a full rally occurs with strong bullish sentiment)
❌ Bearish Scenario:
If the price fails to hold the breakout and re-enters the channel:
Potential drop back to the support zone of $0.2000 - $0.1600
A breakdown below this range may lead to further downside toward $0.1300 to $0.1000 (previous historical low)
🔍 Summary:
The chart displays a classic bullish reversal pattern with a confirmed breakout from the falling channel.
The $0.26–$0.29 area now acts as a key confirmation zone. If the price holds above it and completes a successful retest, the bullish continuation is likely.
However, traders should stay cautious of false breakouts.
#PNUTUSDT #CryptoBreakout #AltcoinSeason #ChartAnalysis #BullishReversal #TechnicalAnalysis #BreakoutTrading #CryptoSignals #DescendingChannel
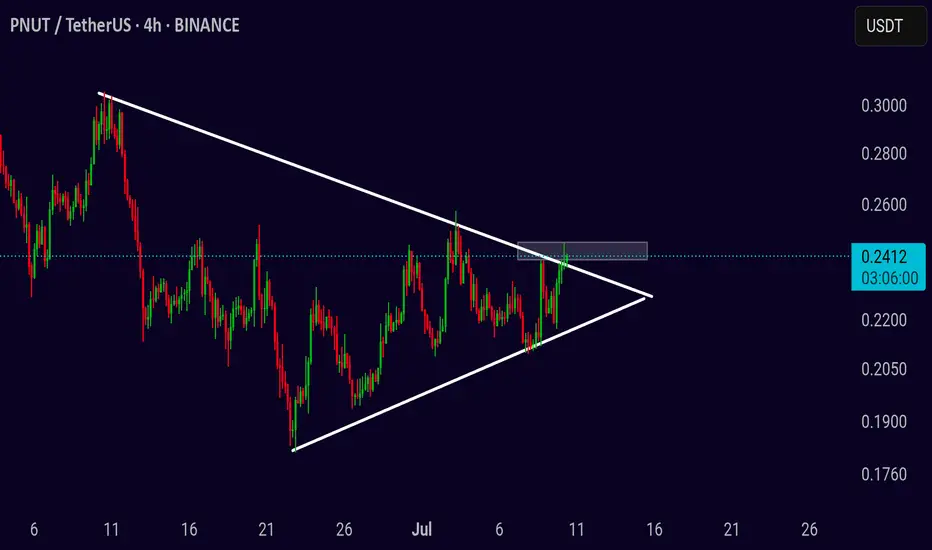
PNUT/USDT – Breakout Watch from Symmetrical TrianglePNUT/USDT – Breakout Watch from Symmetrical Triangle
Chart pattern: Symmetrical Triangle
Timeframe: 4-Hour
Published: June 20, 2025
PNUT/USDT is nearing the apex of a symmetrical triangle that has been forming over several weeks. The price is tightening between rising support and descending resistance, indicating a breakout is likely approaching soon.
Price is currently testing the upper boundary near 0.24. A breakout from this level with strong volume may trigger a bullish move, while rejection could keep price inside the range a little longer.
Bullish scenario
Entry: 4H close above 0.245 with volume
Target 1: 0.28
Target 2: 0.33
Stop-loss: Below 0.22
Bearish scenario
Entry: Break below 0.215
Target 1: 0.18
Target 2: 0.14
Stop-loss: Above 0.24
Wait for confirmation before acting — momentum will likely follow once the triangle breaks.

PNUTUSDT Forming Falling WedgePNUTUSDT is presenting a compelling falling wedge pattern, signaling a high-probability bullish reversal. This technical formation typically occurs after a sustained downtrend and is characterized by converging trendlines sloping downward. In the case of PNUTUSDT, the wedge is nearing its apex, indicating that a breakout is likely imminent. The setup is further supported by healthy volume levels, adding credibility to the expected move. Historically, falling wedges often lead to explosive upside moves, and this pair is currently projecting a potential gain of 90% to 100%+ if the breakout confirms.
Market interest in PNUTUSDT is steadily growing, as indicated by rising trading activity and increased visibility across community forums and social platforms. This surge in attention aligns with the volume spike seen during recent trading sessions — a classic precursor to bullish breakouts. As more investors start to take positions in anticipation of a breakout, price momentum can accelerate rapidly, creating ideal conditions for short- to mid-term gains.
From a technical standpoint, a confirmed breakout above the wedge’s upper resistance line could open the door to rapid price expansion, especially with limited overhead resistance. Traders should watch for confirmation signals such as strong bullish candlesticks, increasing volume, or a retest of the breakout level. PNUTUSDT is shaping up as an exciting opportunity for swing traders looking to capitalize on pattern-based moves in the altcoin space.
With bullish sentiment, clear technical structure, and improving market participation, PNUTUSDT could be on the verge of a significant breakout. It’s a setup that combines strong technicals with growing investor interest — a powerful combination in crypto trading.
✅ Show your support by hitting the like button and
✅ Leaving a comment below! (What is You opinion about this Coin)
Your feedback and engagement keep me inspired to share more insightful market analysis with you!
PNUTUSDT 1D Analysis PNUT ~ 1D Analysis
#PNUT Buy when retesting this support block or buy after successfully breaking this resistance line with a short-term target of at least 15%++
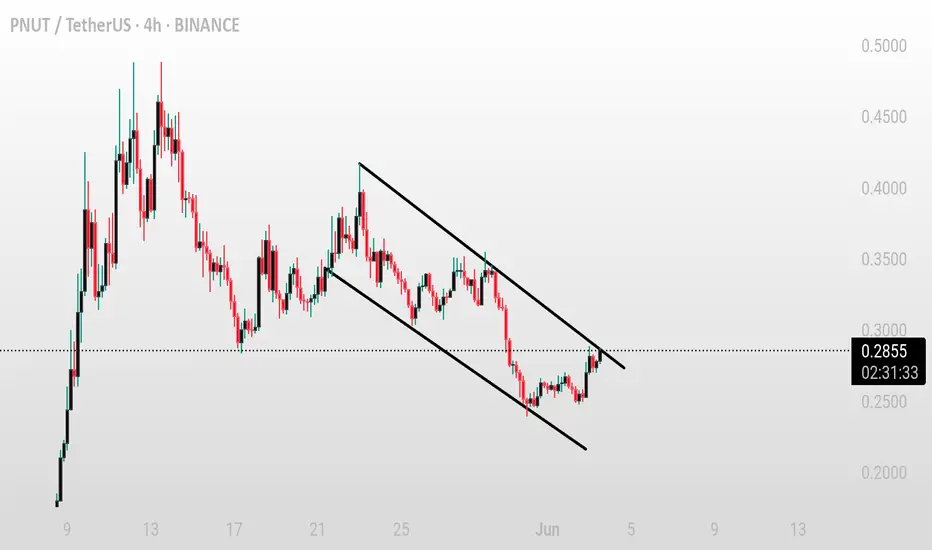
PNUT/USDT (4H) – Bull Flag Breakout Setup PNUT/USDT (4H) – Bull Flag Breakout Setup
Pattern: Bull Flag 📉📈
Timeframe: 4-Hour ⏱️
Pair: PNUT/USDT 💱
Published: June 10, 2025 📅
Technical Overview:
PNUT/USDT is forming a classic bull flag on the 4-hour chart following a strong impulsive rally. The price has been consolidating inside a descending channel — a typical continuation structure in bullish trends. Currently, the price is testing the upper trendline resistance, signaling potential breakout pressure building up 🔥
Potential Trade Setup:
Bullish Scenario ✅
Entry: On a confirmed breakout and close above the flag resistance (\~0.3000)
Targets:
* First target at 0.4200 🎯
* Second target at 0.5000–0.5200 zone 🎯
Stop-loss: Below recent swing low (\~0.2500) 🛑
Risk Management ⚠️
If PNUT gets rejected at the upper trendline and fails to break out, it could revisit the lower channel support near 0.2300. Look for a volume spike on breakout for added confirmation 📊
Conclusion:
PNUT is at a key decision point. A clean breakout above the descending channel could unlock a fresh bullish wave. As always, wait for confirmation and manage your risk accordingly 🔍📈

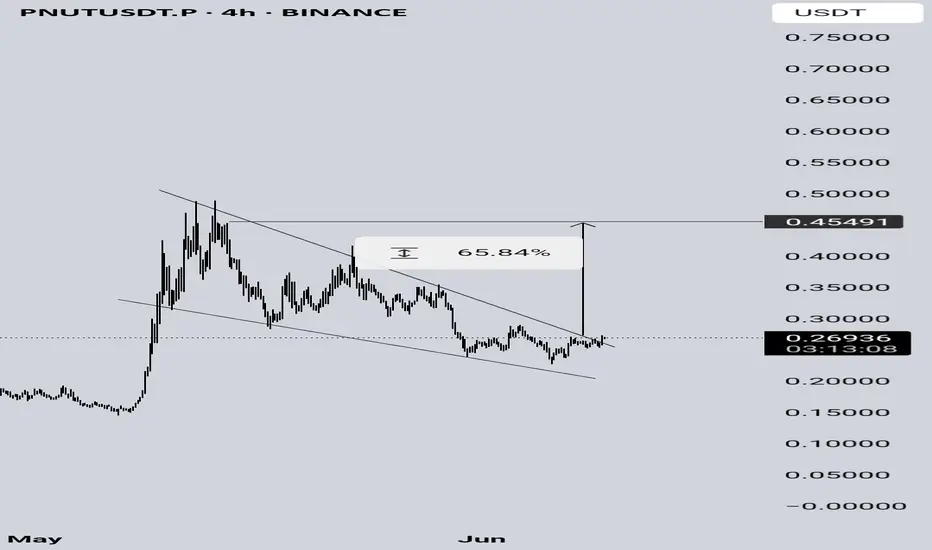
PNUTUSDTA Falling Wedge (Bearish) pattern has breakout the resistance, and it is targeting $0.45 with a profit of 65% on the 4-hour chart.
PNUT/USDT – Bull flag breakout attemptPNUT/USDT – Bull flag breakout attempt
PNUT is currently showing signs of breaking out from a bull flag pattern. This pattern typically indicates a continuation of the previous uptrend if confirmed with strong volume.
The price is testing the upper trendline of the flag. If it breaks and closes above this resistance, we may see bullish momentum ahead. However, a rejection from this zone could lead to consolidation or a short-term pullback.
Key levels to monitor:
* Breakout confirmation area
* Support near the flag base
* Volume activity for breakout strength
Keep a close watch — a successful breakout could lead to the next upward move.
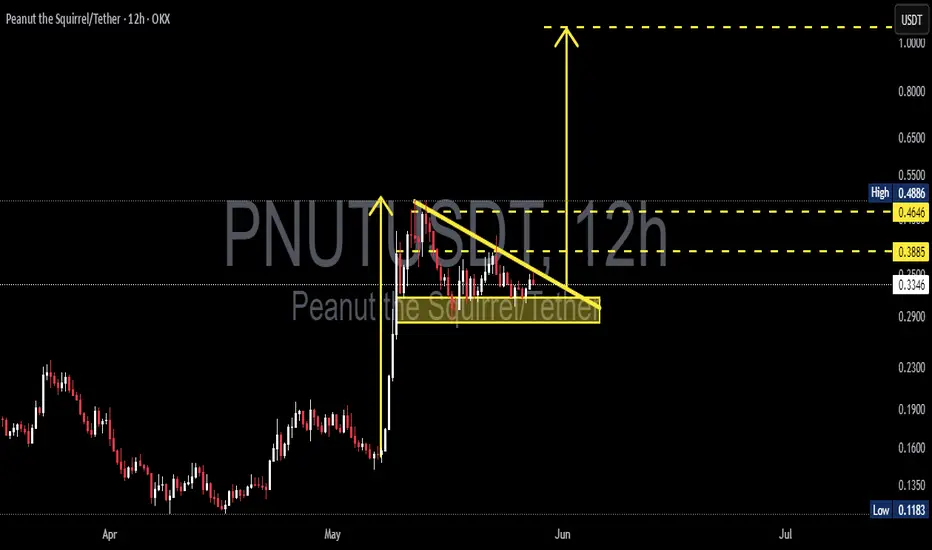
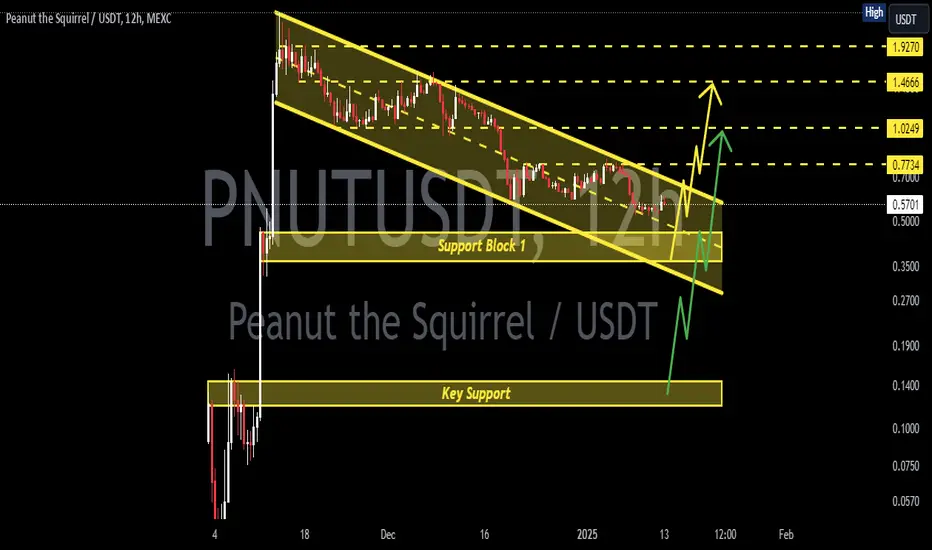
PNUTUSDT 12H AnalysisPNUT ~ 12H Analysis
#PNUT Buy after breaking this resistance line with a short term target of at least 15%+ and a long term target of $1.07++
BUY/LONG PNUTUSDT FOLLOWING D1 PEAKBUY/LONG PNUTUSDT FOLLOWING D1 PEAK
Hello,
I currently recommend a pair for you to BUY/LONG: PNUTUSDT.
Why should you BUY/LONG PNUTUSDT?
The D1 peak is still ongoing, with no signs of a confirmed D1 top for PNUT.
H4 is currently in a corrective pullback after rallying to form a peak at $0.49.
The likelihood of breaking above the recent H4 All-Time High (ATH) is high, making it a good opportunity for a LONG/BUY position.
So, what should we do?
Trend: BUY
Entry: When H4 corrects, the price is expected to return to around $0.3167. At this level, allocate your capital and enter a BUY position.
Close Buy: When H4 forms a peak (has a peak on H4).Alternatively, refer to the price levels on the chart.
Wishing you success!

#PNUT/USDT#PNUT
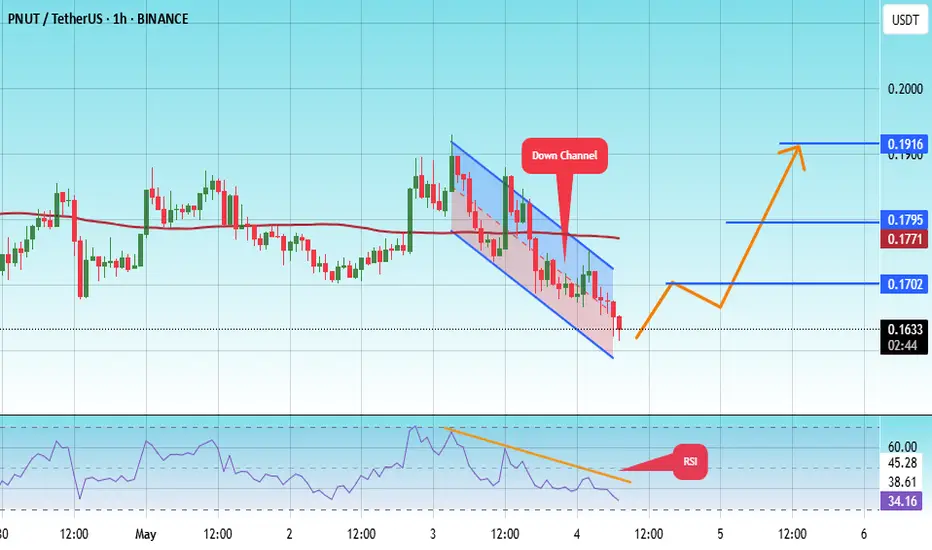
The price is moving within a descending channel on the 1-hour frame, adhering well to it, and is on its way to breaking it strongly upwards and retesting it.
We are seeing a bounce from the lower boundary of the descending channel, which is support at 0.1595.
We have a downtrend on the RSI indicator that is about to break and retest, supporting the upward trend.
We are looking for stability above the 100 Moving Average.
Entry price: 0.1633
First target: 0.1700
Second target: 0.1771
Third target: 0.1916
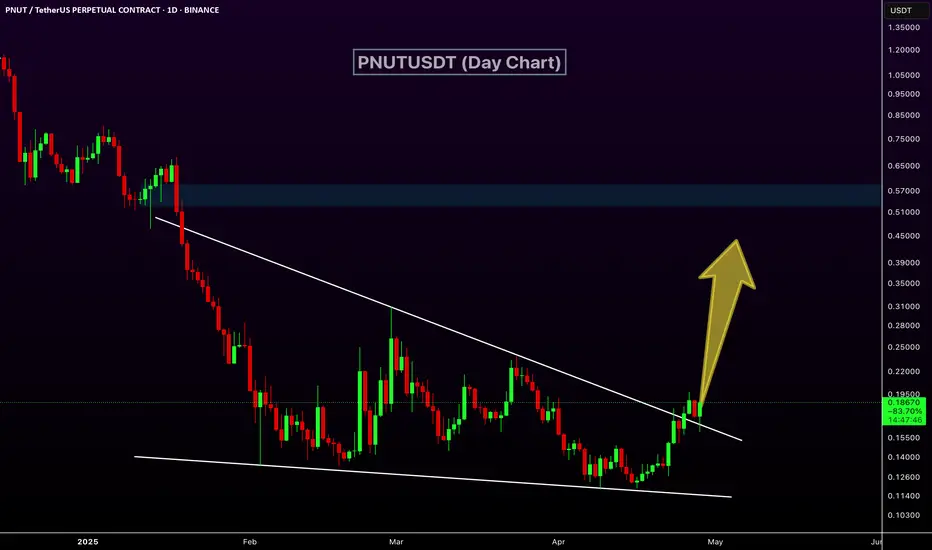
PNUTUSDT Ready to Rally!PNUTUSDT Technical analysis update
PNUTUSDT is breaking out of a wedge pattern on the daily chart after three months of formation. We also observed a bullish RSI divergence in the daily timeframe, along with a MACD bullish crossover a few days ago. A 50–100% move could be seen in the mid-term.
PNUTUSDT 1D AnalysisPNUT ~ 1D Analysis
#PNUT Buy gradually from here with a short -term target of at least 10%+ from here.

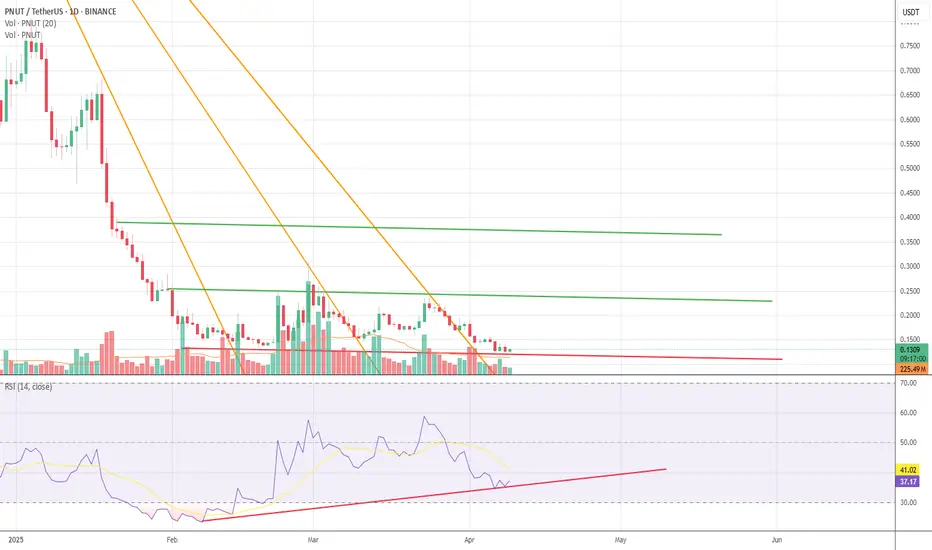
PNUT / USDT – Daily AnalysisBullish divergence spotted!
Price is printing lower lows, but RSI is making higher lows — a classic bullish divergence pattern. This signals potential trend exhaustion on the downside.
#PNUT is holding above a horizontal support level around 0.12–0.13 USDT, aligning with the divergence signal.
Volume is tapering off, indicating decreasing selling pressure.
RSI is currently around 37–38 and showing a higher low structure.
Key levels to watch:
Support: 0.1220–0.1300 USDT (current demand zone).
Resistance: 0.1650 USDT (local high), followed by stronger resistance at 0.2000–0.2200 USDT.
Scenario ideas:
If PNUT can hold above support and RSI continues climbing, we might see a relief rally towards the next resistance zones.
A breakdown below 0.1220 would invalidate this bullish setup and could lead to continuation of the downtrend. Still... bullish divergence then will become even more obvious....
Bias:
bullish short-term, watching for confirmation.
⚠️ Not financial advice. Always manage your risk!
#PNUT #Crypto #Altcoins #BullishDivergence #RSI #TradingView
PNUTUSDT 1DPNUT ~ 1D Analysis
#PNUT Buy after successfully penetrating this resistant line or buy after re -testing this support block with a short -term target of at least 15%+.
$PNUT - The Peanut TrajectoryBINANCE:PNUTUSDT - Finally i think, its time to push massively on top after a huge bearish pullback from the highs. This zone looks about right to create some huge potential. Play it easy though as its very risky.

PNUT COIN PRICE ANALYSIS AND NEXT POSSIBLE MOVES!!$PNUT Coin Update!!
• Until Price Holding its current Support area... 30%-50% any time pottential bounce back expected in comming days.
• Without SL Don't Build any trade on it🚨
Warning : That's just my analysis DYOR Before taking any action🔥

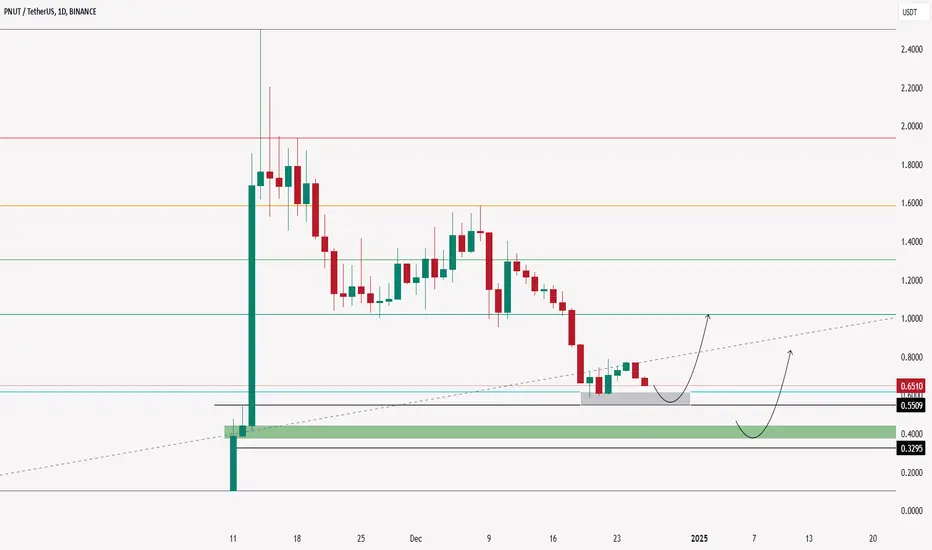
Just In: Coinbase Adds PNUT Meme Coin on Solana NetworkCoinbase has officially announced the listing of Peanut the Squirrel (PNUT), a Solana-based meme coin, for trading on January 14, 2025. The news has already sparked a 10% price surge for PNUT, though the token still trades below its all-time high. Let’s delve into the technical and fundamental aspects surrounding this development.
Key Highlights
1. Coinbase Listing Details:
- PNUT-USD trading pair launches on January 14, 2025, at 9:00 AM PT.
- Token transfers for PNUT are live on Coinbase and Coinbase Exchange.
- Trading will be rolled out in phases based on liquidity conditions.
2. Immediate Market Reaction:
- PNUT’s price rose from $0.48 to $0.59, a 10% increase.
- Trading volume surged over 107%, reaching $431.71 million.
- Despite the rebound, PNUT remains 79% below its all-time high of $2.47, recorded in November 2024.
3. Historical Context and Legal Challenges:
- PNUT originated in late 2024 following the controversial euthanasia of a pet squirrel named Peanut, which galvanized community support.
- Legal disputes have since arisen, with Mark Longo, Peanut’s owner, suing Binance for alleged unauthorized intellectual property usage to promote the coin.
Technical Analysis
From a technical perspective, PNUT exhibits strong potential for further gains: PNUT’s recent price action forms a bullish engulfing pattern, signalling a potential upward trend. The Relative Strength Index (RSI) indicates that PNUT is not yet overbought, providing room for further price growth.
Immediate support lies at the one-month low axis, providing a safety net in case of a pullback. The next resistance point aligns with the 38.2% Fibonacci retracement level, which traders are eyeing for a potential breakout.
PNUT’s unique narrative and community support position it as a potential standout in the meme coin category. The Coinbase listing, coupled with strong technical indicators, creates a favorable environment for a potential rally toward $1 and beyond.
Conclusion
The listing of PNUT on Coinbase marks a pivotal moment for the Solana-based meme coin. With a bullish technical setup and growing community support, PNUT is well-positioned to capitalize on its newfound exposure. However, investors should remain cautious of potential legal and market risks. As the crypto industry evolves, PNUT’s journey underscores the power of community-driven innovation and the unpredictable nature of meme coins.
Stay tuned for more updates as PNUT’s story unfolds in the coming weeks.

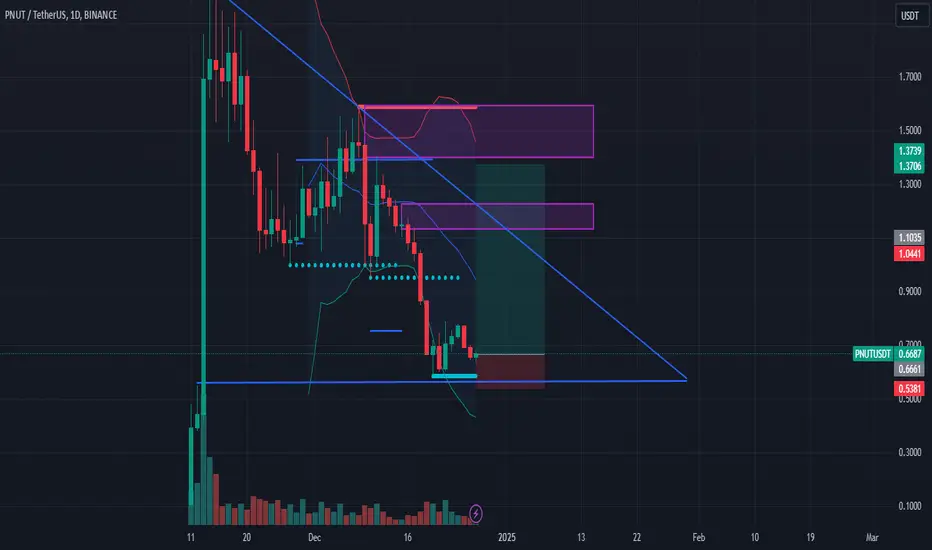
PNUTUSDT 12HPNUT ~ 12H
#PNUT One of these support blocks will bounce the price for this coin.
If you still have Conviction on this coin,. Buy on retest of this support
PNUT - LONGRisky but high profit entry. Let's give it another chance to PNUT. Be very careful as it's risky.
TP 1: 1.13
TP 2: 1.38
PNUT COIN PRICE ANALYSIS AND NEXT POSSIBLE MOVES!!$PNUT Coin!!
• 2 major areas where we can expect now potential bounce back in its price🥷
• On First Support Don't Build trade without SL🚨
Warning : That's just my analysis DYOR Before Taking any trade.