PNUT/USDT – On the Edge of Rebound or Breakdown?📌 Overview:
PNUT/USDT is currently at a major inflection point, following a prolonged downtrend and months of consolidation. The price is once again testing the key demand zone that has acted as a solid support since February 2025. Will this be the beginning of a strong bullish reversal, or the start of a deeper breakdown?
---
🧠 Price Action & Market Structure:
Since peaking around $2.50, PNUT has undergone a sharp decline, now hovering near the critical support area of $0.21–$0.23.
This zone has repeatedly acted as a historical accumulation zone, providing strong bounce reactions in the past.
A potential double bottom pattern is forming – if confirmed, it could ignite a bullish trend.
Multiple resistance levels lie ahead, creating a clear roadmap for staged recovery if momentum shifts.
---
🔼 📈 Bullish Scenario – Potential Reversal in Sight:
If the support holds and bullish structure forms (e.g., bullish engulfing, morning star, or higher high breakout), we could see:
1. A strong rebound from the demand zone ($0.21–$0.23), signaling buyer strength.
2. Upside targets:
$0.3027 (initial resistance and trend reversal confirmation)
$0.4403
$0.5951 (strong historical resistance)
$0.7674 to $1.0797 (major psychological zones)
3. A breakout with strong volume and MA crossover (if used) would further validate the trend change.
---
🔽 📉 Bearish Scenario – Breakdown Risk:
If the support zone fails and price breaks below $0.21, the bearish trend could continue:
1. A clear breakdown below the demand zone opens room to:
$0.1700 (minor support)
$0.1300
$0.1000 (historical low and key psychological level)
2. This would invalidate the potential reversal and reinforce the broader distribution phase.
---
📊 Identified Patterns:
Range-Bound / Accumulation Phase: Price has moved sideways between $0.21–$0.44 since February, suggesting accumulation by long-term players.
Potential Double Bottom: Still forming – confirmation needed via a breakout of the neckline.
Descending Trendline Resistance: Remains overhead and may act as a strong barrier if price attempts to climb.
---
🧭 Key Things Traders Should Watch:
Monitor price reaction in the current demand zone over the next few candles.
Look for volume confirmation on any breakout.
Stay aware of Bitcoin’s trend and macro sentiment, as it may influence volatility in altcoins like PNUT.
---
📝 Conclusion:
PNUT/USDT is now trading at a crucial technical level. The price reaction here will determine the mid- to long-term direction of this asset. Traders should prepare for either a strong reversal or a significant breakdown. This area offers a strategic opportunity to assess both risk and reward potential.
#PNUTUSDT #CryptoBreakout #TechnicalAnalysis #AltcoinSetup #CryptoReversal #PriceAction #SupportAndResistance #CryptoUpdate #BullishVsBearish
Pnutusdtperp

PNUT Just Broke Out – Can It Hold 0.2400?Pair: PNUT/USDT
Timeframe: 4H
Pattern: Symmetrical Triangle (Breakout Confirmed)
PNUT has broken out of the symmetrical triangle, showing early signs of bullish momentum. To confirm strength, price must now hold above the breakout zone near 0.2400.
Bullish continuation:
If it holds, we could see upside targets around 0.2700–0.3000 in the short term. Volume confirmation will be key.
Fakeout risk:
If PNUT fails to sustain above 0.2400, the breakout may fail. Stay patient for a clean retest or follow-through to avoid getting trapped.
Wait and manage risk wisely — the next few candles will confirm the move.
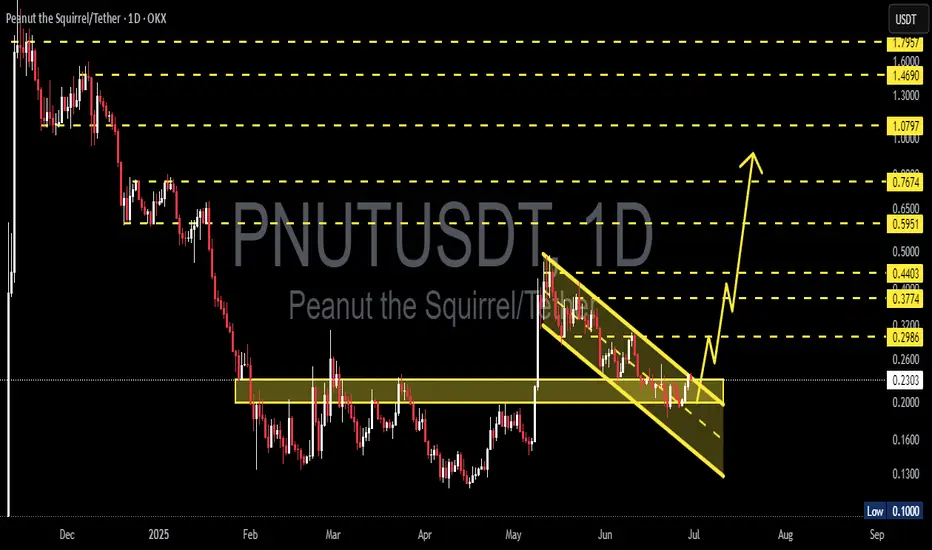
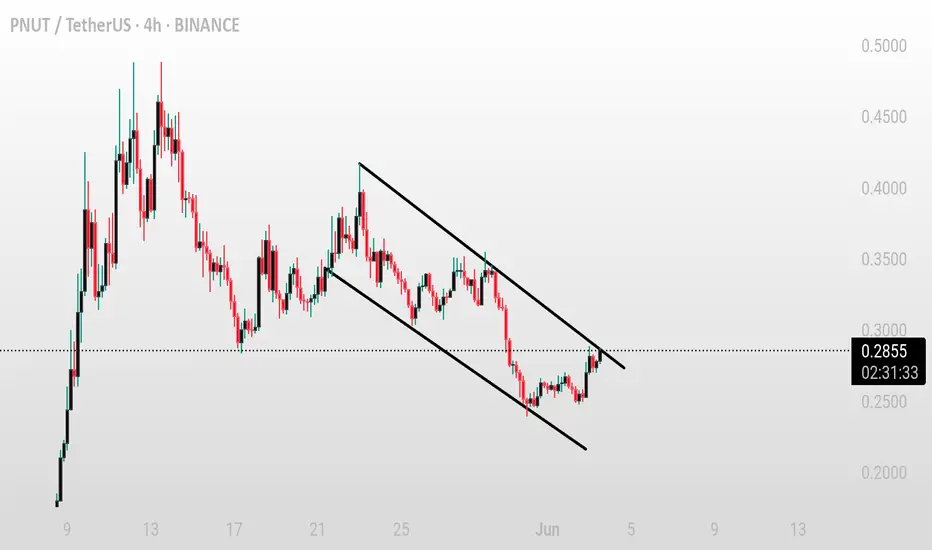
Falling Channel Breakout on PNUT/USDT – Next Stop: $0.76?📊 Pattern Analysis:
Falling Channel (Descending Channel): PNUT formed a clear falling channel from early May to late June 2025. This pattern typically signals a potential bullish reversal once a breakout occurs.
Confirmed Breakout: The price has successfully broken above the upper boundary of the falling channel, which is an early sign of a potential bullish trend.
Strong Support Zone: The horizontal zone around $0.20 – $0.26 USDT has acted as a solid demand base, as seen multiple times from March to June.
✅ Bullish Scenario:
If the breakout continues with momentum, the price could move upward gradually, aiming for the following resistance levels:
1. Target 1: $0.2986 – Minor resistance
2. Target 2: $0.3774 – Previous consolidation area
3. Target 3: $0.4403 – Major historical resistance
4. Target 4: $0.5951 to $0.7674 – Recovery zone from the falling channel
5. Extended Target (Long-Term): $1.0797 to $1.7957 (if a full rally occurs with strong bullish sentiment)
❌ Bearish Scenario:
If the price fails to hold the breakout and re-enters the channel:
Potential drop back to the support zone of $0.2000 - $0.1600
A breakdown below this range may lead to further downside toward $0.1300 to $0.1000 (previous historical low)
🔍 Summary:
The chart displays a classic bullish reversal pattern with a confirmed breakout from the falling channel.
The $0.26–$0.29 area now acts as a key confirmation zone. If the price holds above it and completes a successful retest, the bullish continuation is likely.
However, traders should stay cautious of false breakouts.
#PNUTUSDT #CryptoBreakout #AltcoinSeason #ChartAnalysis #BullishReversal #TechnicalAnalysis #BreakoutTrading #CryptoSignals #DescendingChannel
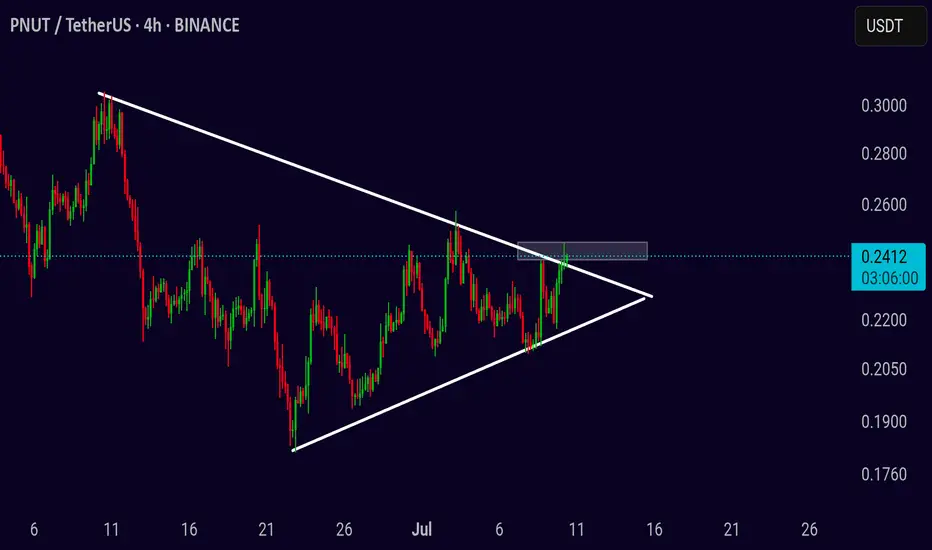
PNUT/USDT – Breakout Watch from Symmetrical TrianglePNUT/USDT – Breakout Watch from Symmetrical Triangle
Chart pattern: Symmetrical Triangle
Timeframe: 4-Hour
Published: June 20, 2025
PNUT/USDT is nearing the apex of a symmetrical triangle that has been forming over several weeks. The price is tightening between rising support and descending resistance, indicating a breakout is likely approaching soon.
Price is currently testing the upper boundary near 0.24. A breakout from this level with strong volume may trigger a bullish move, while rejection could keep price inside the range a little longer.
Bullish scenario
Entry: 4H close above 0.245 with volume
Target 1: 0.28
Target 2: 0.33
Stop-loss: Below 0.22
Bearish scenario
Entry: Break below 0.215
Target 1: 0.18
Target 2: 0.14
Stop-loss: Above 0.24
Wait for confirmation before acting — momentum will likely follow once the triangle breaks.

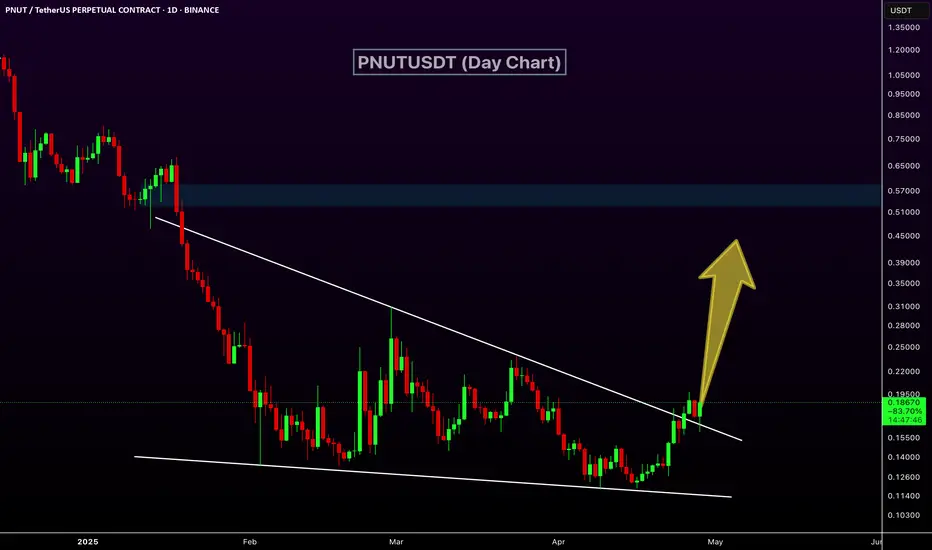
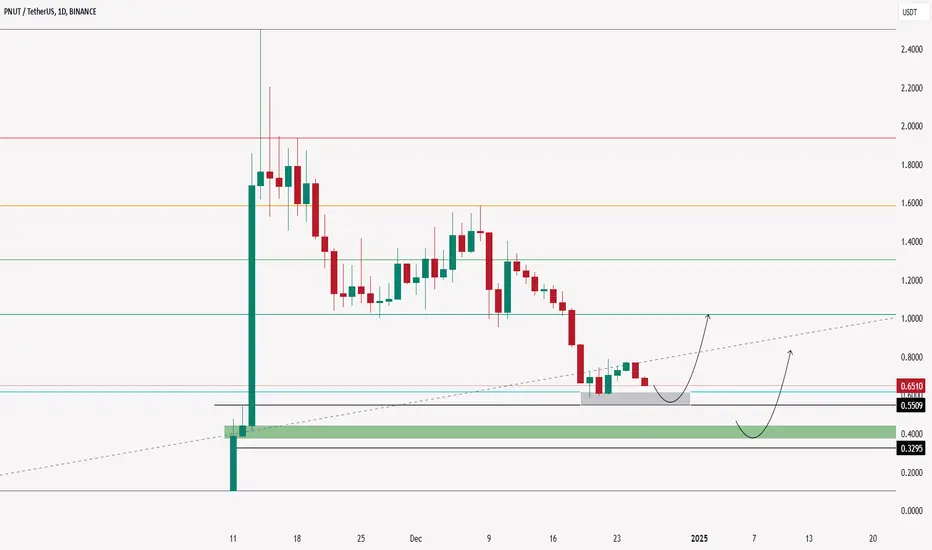
PNUTUSDT 1D Analysis PNUT ~ 1D Analysis
#PNUT Buy when retesting this support block or buy after successfully breaking this resistance line with a short-term target of at least 15%++
PNUT/USDT (4H) – Bull Flag Breakout Setup PNUT/USDT (4H) – Bull Flag Breakout Setup
Pattern: Bull Flag 📉📈
Timeframe: 4-Hour ⏱️
Pair: PNUT/USDT 💱
Published: June 10, 2025 📅
Technical Overview:
PNUT/USDT is forming a classic bull flag on the 4-hour chart following a strong impulsive rally. The price has been consolidating inside a descending channel — a typical continuation structure in bullish trends. Currently, the price is testing the upper trendline resistance, signaling potential breakout pressure building up 🔥
Potential Trade Setup:
Bullish Scenario ✅
Entry: On a confirmed breakout and close above the flag resistance (\~0.3000)
Targets:
* First target at 0.4200 🎯
* Second target at 0.5000–0.5200 zone 🎯
Stop-loss: Below recent swing low (\~0.2500) 🛑
Risk Management ⚠️
If PNUT gets rejected at the upper trendline and fails to break out, it could revisit the lower channel support near 0.2300. Look for a volume spike on breakout for added confirmation 📊
Conclusion:
PNUT is at a key decision point. A clean breakout above the descending channel could unlock a fresh bullish wave. As always, wait for confirmation and manage your risk accordingly 🔍📈

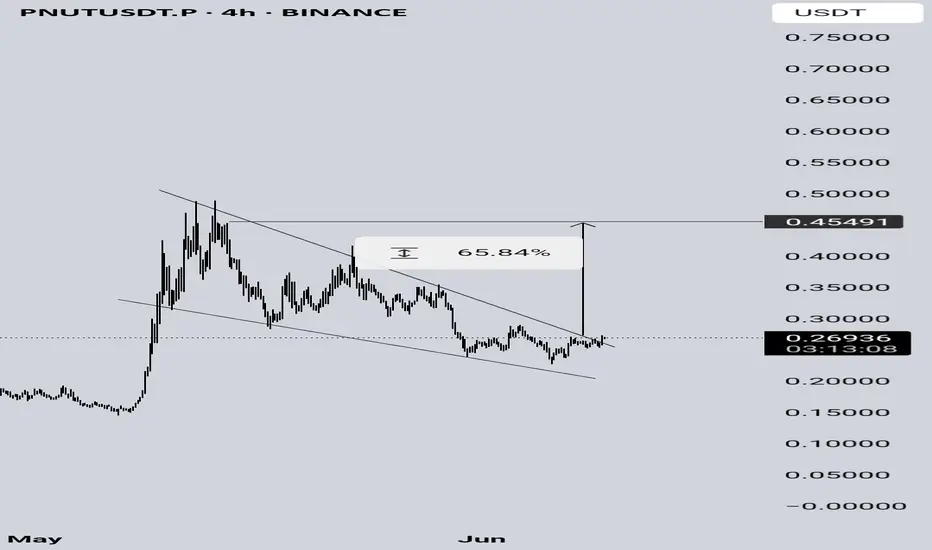
PNUTUSDTA Falling Wedge (Bearish) pattern has breakout the resistance, and it is targeting $0.45 with a profit of 65% on the 4-hour chart.
PNUT/USDT – Bull flag breakout attemptPNUT/USDT – Bull flag breakout attempt
PNUT is currently showing signs of breaking out from a bull flag pattern. This pattern typically indicates a continuation of the previous uptrend if confirmed with strong volume.
The price is testing the upper trendline of the flag. If it breaks and closes above this resistance, we may see bullish momentum ahead. However, a rejection from this zone could lead to consolidation or a short-term pullback.
Key levels to monitor:
* Breakout confirmation area
* Support near the flag base
* Volume activity for breakout strength
Keep a close watch — a successful breakout could lead to the next upward move.
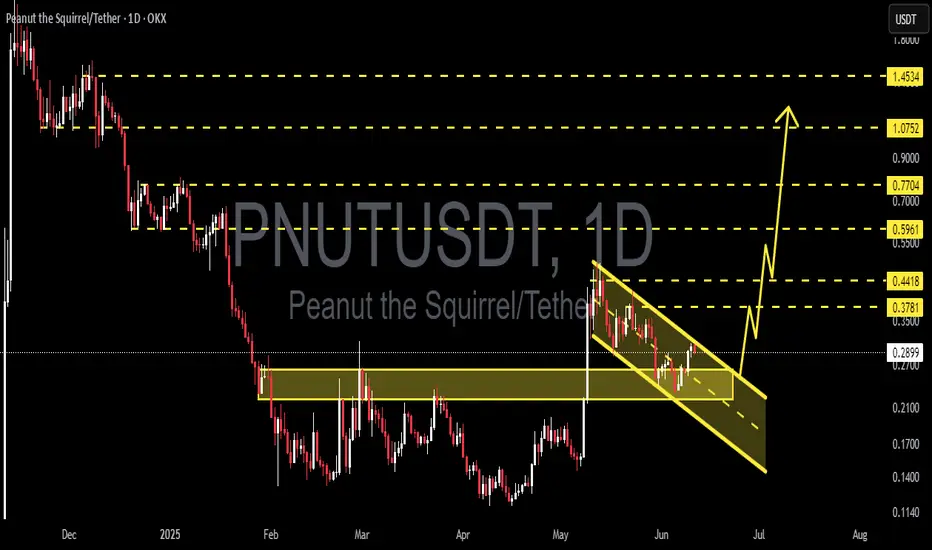
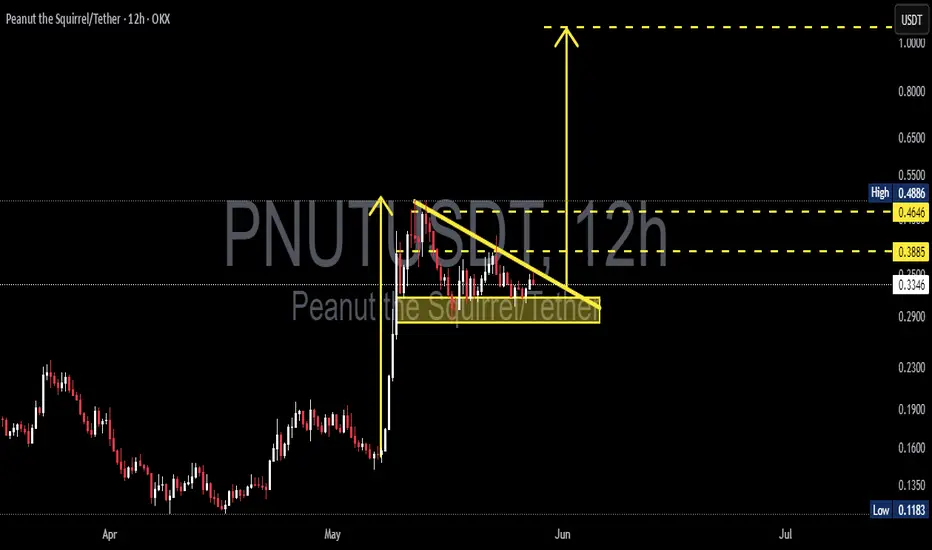
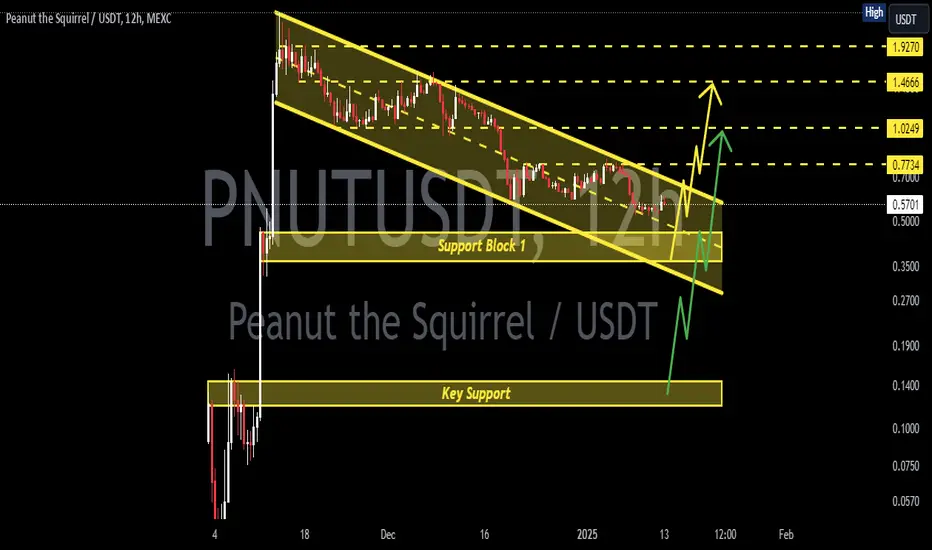
PNUTUSDT 12H AnalysisPNUT ~ 12H Analysis
#PNUT Buy after breaking this resistance line with a short term target of at least 15%+ and a long term target of $1.07++
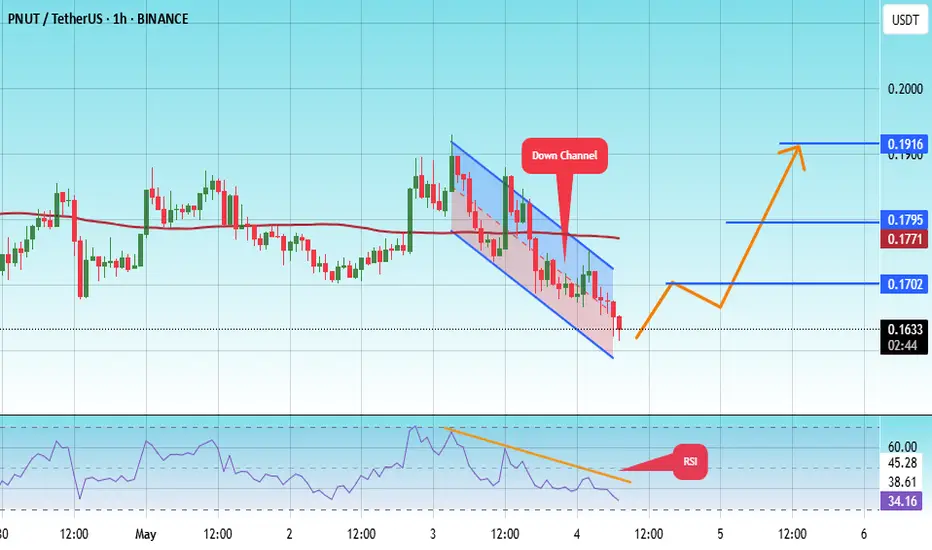
#PNUT/USDT#PNUT
The price is moving within a descending channel on the 1-hour frame, adhering well to it, and is on its way to breaking it strongly upwards and retesting it.
We are seeing a bounce from the lower boundary of the descending channel, which is support at 0.1595.
We have a downtrend on the RSI indicator that is about to break and retest, supporting the upward trend.
We are looking for stability above the 100 Moving Average.
Entry price: 0.1633
First target: 0.1700
Second target: 0.1771
Third target: 0.1916
PNUTUSDT Ready to Rally!PNUTUSDT Technical analysis update
PNUTUSDT is breaking out of a wedge pattern on the daily chart after three months of formation. We also observed a bullish RSI divergence in the daily timeframe, along with a MACD bullish crossover a few days ago. A 50–100% move could be seen in the mid-term.
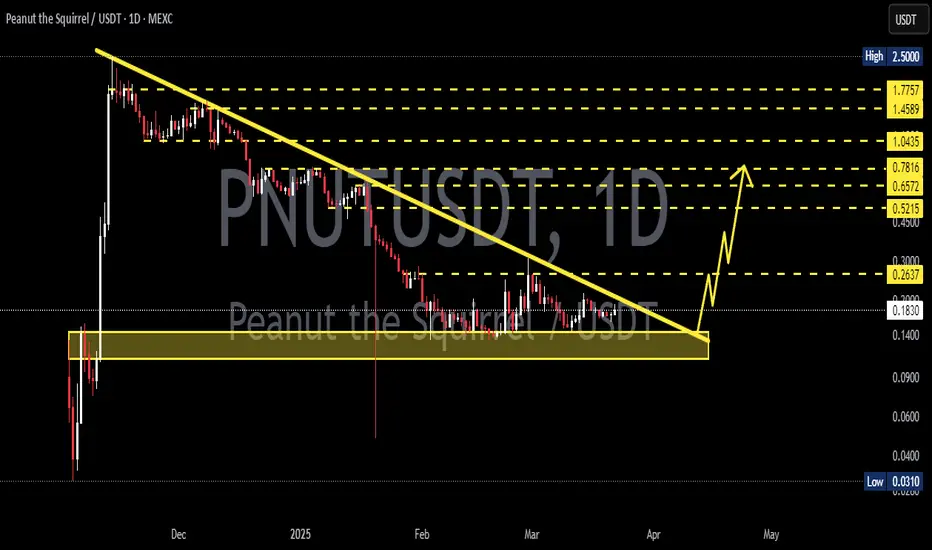
PNUTUSDT 1D AnalysisPNUT ~ 1D Analysis
#PNUT Buy gradually from here with a short -term target of at least 10%+ from here.

Peanut the Squirrel PNUT price analysis🐿 For #PNUT holders, there is good news and a little bit of "not so good" news)
🟢 Good - the formation of a reversal pattern continues
🟡 Not so good - so far, buyers have not managed to gain a foothold above $0.26
As soon as this happens, OKX:PNUTUSDT price will go up to at least $0.40 and $0.57
_____________________
Did you like our analysis? Leave a comment, like, and follow to get more

PNUTUSDT 1DPNUT ~ 1D Analysis
#PNUT Buy after successfully penetrating this resistant line or buy after re -testing this support block with a short -term target of at least 15%+.
PNUT Coin Price Analysis and Next Possible moves !!$PNUT Coin Update!!
• $PNUT Coin Break now its All support areas on HTF'S... Now any time bounce back expected in its price✅
• If it's price bounce back from current area then with SL I will build trade on it... Otherwise from 0.24$ & 0.225$ pottential bounce back expected🫡
Warning That's just my analysis DYOR Before taking any action🚨

PNUT COIN PRICE ANALYSIS AND NEXT SHOERT-TERM POSSBLE MOVES!!$PNUT Coin Updates!!
• In $PNUT Coin Near Me Potential Bounce back Expected from 0.325$-0.29$ area.. Where you are able to build proper trade setup.
•its current local support is0. 365$.
Warning : That's just my idea DYOR Before taking any risk🥷

PNUTUSDT 12HPNUT ~ 12H
#PNUT One of these support blocks will bounce the price for this coin.
If you still have Conviction on this coin,. Buy on retest of this support
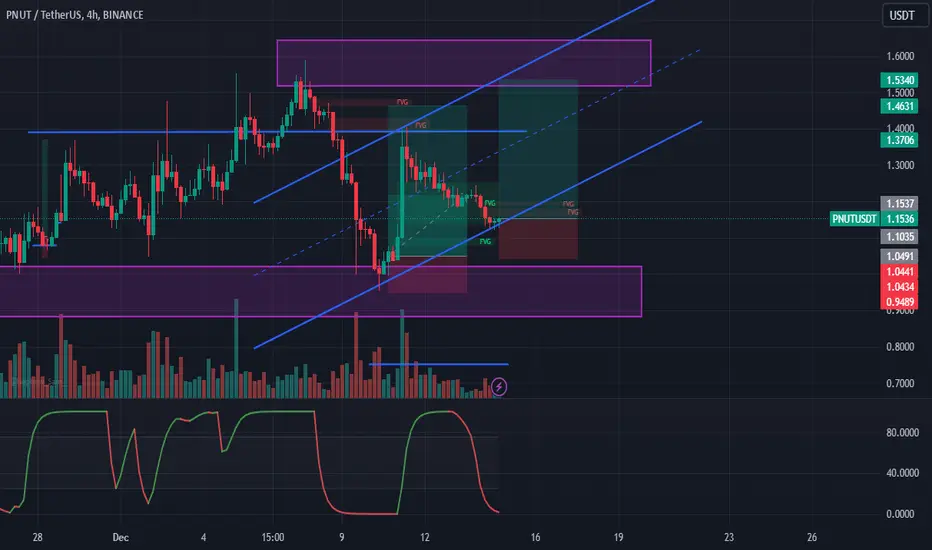
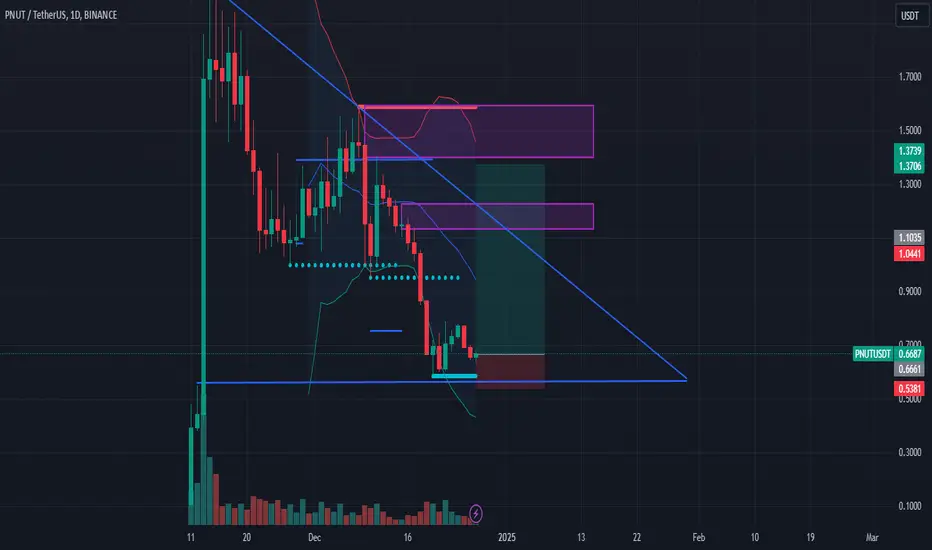
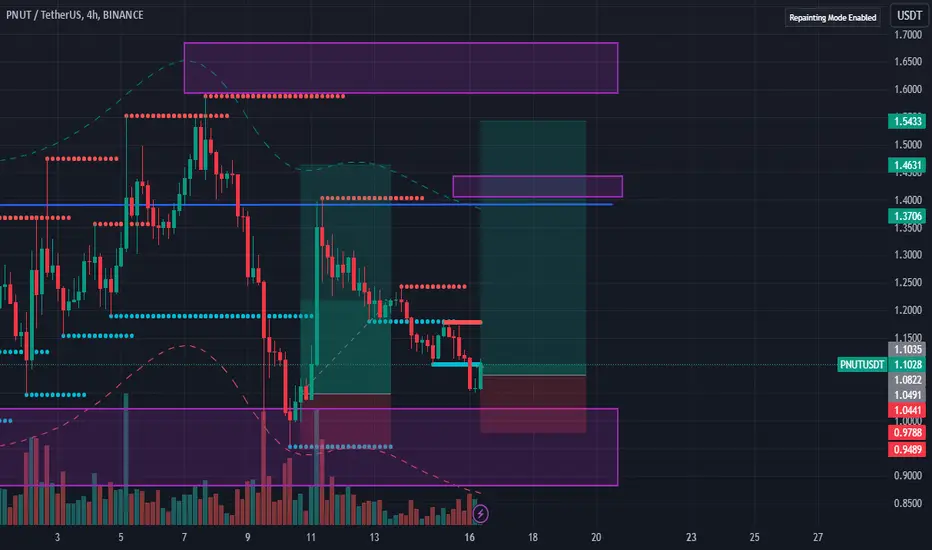
PNUT - LONGRisky but high profit entry. Let's give it another chance to PNUT. Be very careful as it's risky.
TP 1: 1.13
TP 2: 1.38
PNUT COIN PRICE ANALYSIS AND NEXT POSSIBLE MOVES!!$PNUT Coin!!
• 2 major areas where we can expect now potential bounce back in its price🥷
• On First Support Don't Build trade without SL🚨
Warning : That's just my analysis DYOR Before Taking any trade.
PNUT COIN PRICE ANALYSIS AND NEXT POSSIBLE MOVES!!$PNUT Coin Updates & Possible Moves!!
• Right Now $PNUT Coin Holding its 4h Local Support and technically its look in over sold zone... That's mean Quick Bounce Back Expected✅
• if its failed to Hold current Support Then Next Strong support will be 0.50$ Area🫠

PNUT - LONG - Re-entry*This is a re-entry of my other idea. This trade is quite risky so you should not use too much capital. I even think about closing at target 1 if I see a lot of resistance.
Now we do have a better opportunity to enter (see related publications). We are in a good place to resume and make a reentry of the previous trade.
Until it breaks 1.18 or 1.20, it could remain bearish down to 1.0. So, it’s just speculation right now, but my target is 1.38, where I would take a partial profit of 50% or 75%, or close the position if there is a lot of rejection. But I plan to protect it soon, if it breaks 1.14. Still, nothing is certain yet, it remains bearish. So we have to be very careful.
Targets:
T1: 1.38
T2: 1.55
Stops:
0.98 (4 hours)
0.95 (swing/days)

PNUT - Re-entry - LONG*This is a re-entry of my other idea. This trade is quite risky so you should not use too much capital. I even think about closing at target 1 if I see a lot of resistance.
Now we do have a better opportunity to enter (see related publications). We are in a good place to resume and make a reentry of the previous trade.
T1: 1.38
T2: 1.55
PNUT - Re-entry - LONG - 4 hourNow we do have a better opportunity to enter (see related publications). We are in a good place to resume and make a reentry of the previous trade.
T1: 1.38
T2: 1.52