Spacial Geons: Repeated Fractal Waves
The bull movement was considered reversed but the geons suggest otherwise.
POC
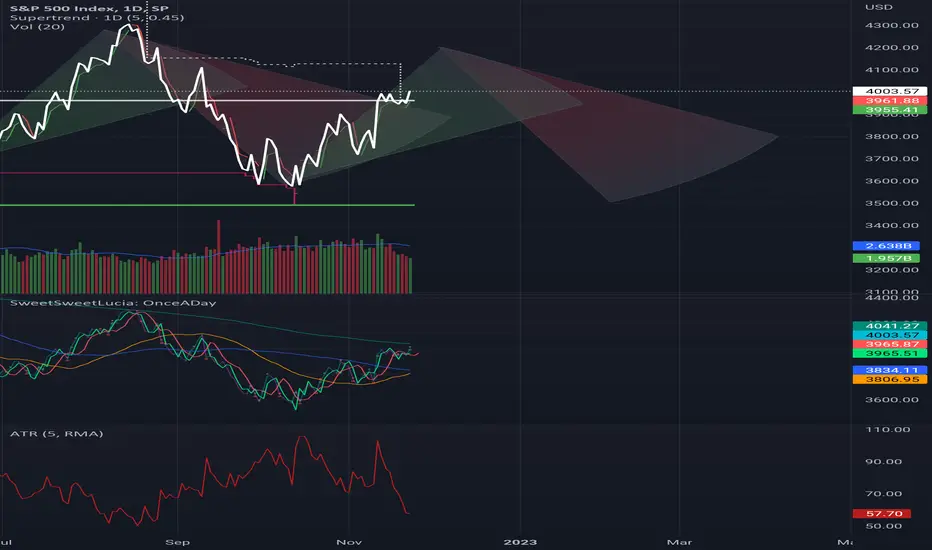
SPX hitting huge excess area, which way will it go next?As you can see, the price is sitting in a large excess range, trying to push higher with the bullish momentum since the opening. Looks like it is feeling lots of selling pressure. But if we can break up and into the higher naked value area, there is great opportunity for a bull run to the value area high. Otherwise, we might go back to the value area from yesterday's price action. What's your take?? Will we go up or down?

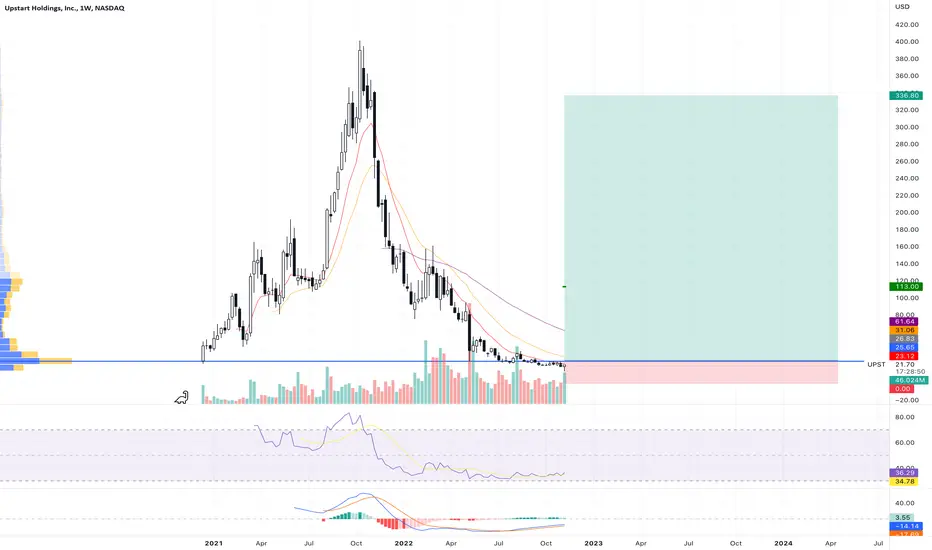
UPST weekly at all time low POC stop loss $0 HODLUPST weekly at all time low point of control stop loss $0 HODL
Logscale Bearish Butterfly and Bearish ABCD Attempting RetestThis is a potential Logscale Butterfly at the PCZ of a logscale ABCD after declining 50 percent from the low to high of the Butterfly on the first attempt at breaking the PCZ. This may be the second attempt to break through the PCZ which if it fails could take us down much lower towards BTC's lifetime POC.

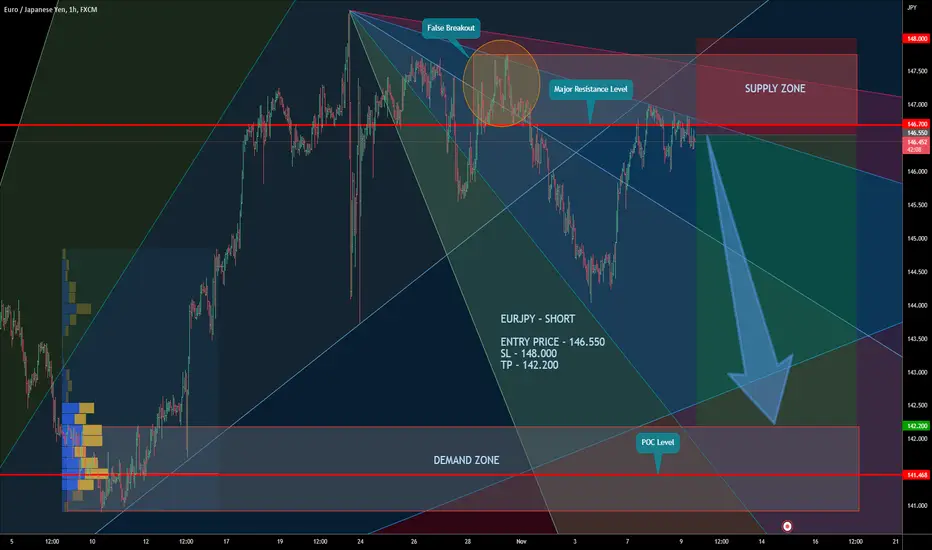
EURJPY – SHORTThe possibility of selling from the Major Resistance Level and Supply Zone. Sell on a false breakout! The target is POC level in Demand Zone.
EURJPY – SHORT
ENTRY PRICE - 146.550
SL - 148.000
TP - 142.200
Always follow the 6 Golden Rules of Money Management:
1. Protect your gains and never enter into a position without setting a stop loss.
2. Always trade with a Risk-Reward Ratio of 1 to 1.5 or better.
3. Never over-leverage your account.
4. Accept your losses, move on to the next trade and trust the software.
5. Make realistic goals that can be achieved within reason.
6. Always trade with money you can afford to lose.
Please leave your comment and support me with like if you agree with my idea. If you have a different view, please also share with me your idea in the comments.
Have a nice day!
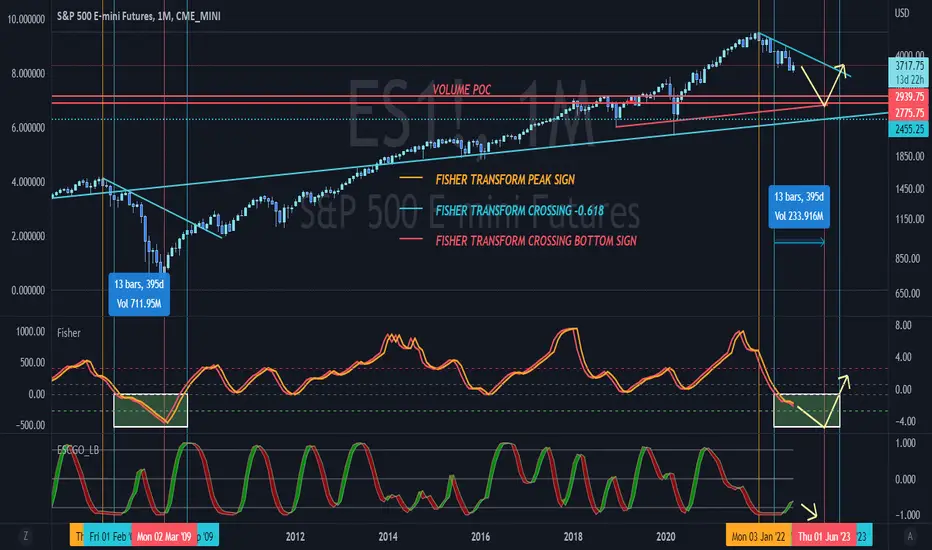
S&P500 Hypothetical fractal for the bottomHypothetical scenario with potential fractal of Fisher Transform oscillator for the bottom price region.
WTI Crude Oil headed for 96?Following a 3-day pullback from 93.64, WTI produced a bullish engulfing candle on the daily chart which closed back above the 20-day EMA. Given the strength of the rally from the 76.30 low, we suspect a corrective low has been found.
The 4-hour chart shows that there was a lot of trading activity around 87.60 since the September low (which marks the volume POC / point of control). But also note that yesterday's low held above a previous bullish engulfing candle on the 4-hour chart, rebounded above the 200-bar EMA and a bullish engulfing candle closed firmly above trend resistance. Prices are pulling back in Asia so we're now looking for opportunities to enter long above the 88.0 area / monthly R1 pivot point, and anticipate prices to retest the 94 highs and head for 96 - or even the high around 97.66.

BTCUSDT Swing Short Targets 20900, 20200, Naked POCsSwing shorts to 20900 and 20200 are a very good bet.
These are NPOCs from July 5, 6, and 7.
It is rare when the price does not return to a previous POCs, so they are very good targets.
POCs from HTFs (higher timeframes) are especially good targets because the higher time means more volume during that time period than LTFs (lower time frames)
The volume at a POC is too significant for traders to not bring the price back to it.
Until the price the returns to that POC, the POC is naked.
On Bybit's BTCUSDT perp market, the daily POCs from July 5, 6, and 7 are naked on a 1 tick bid/ask profile chart.
The POCs are
20900
: July 7
20200:
July 5 AND July 6
POCs (naked and virgin)
POCs are points of control. They are prices that had the highest volume during a time period. The high volume at that price means traders are strongly motivated to bring the price back to that POC value.
After a time period has closed, until the price returns to the POC of that period, in the jargon of order flow trading, the POC is called a naked or a virgin POC.

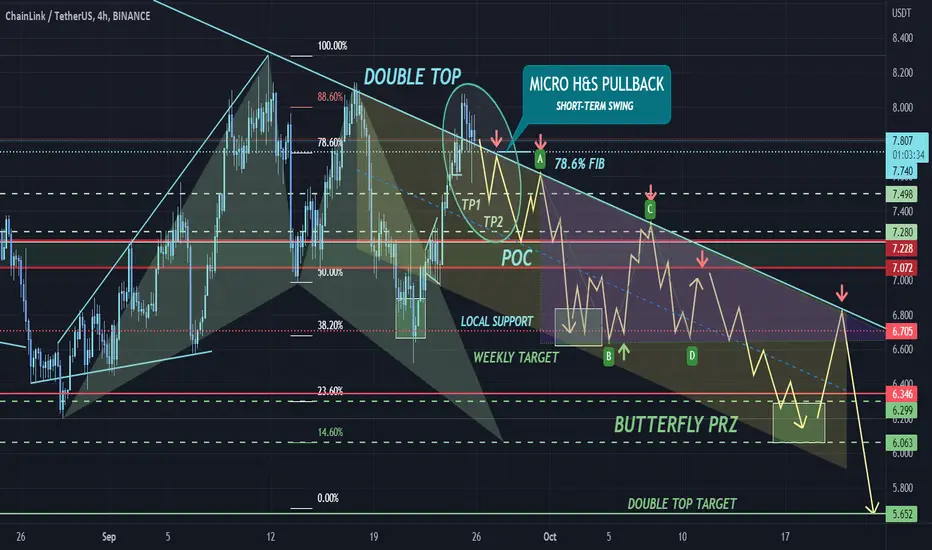
LINKUSDT map for a potential downtrendThat's my ultimate speculative map for a potential downtrend anatomy for LINKUSDT. We have a reversal Head and Shoulders top in formation, which a pullback to neckline can occurs in a retest of broken dynamic trendline. If the price remains bearish, a test of the volume point of control POC can be expected. Then a potential downtrend in a parallel channel formation can be expected w/ lower highs retesting the dynamic trendline / resistance. The final target is the D point from prior Butterfly pattern.
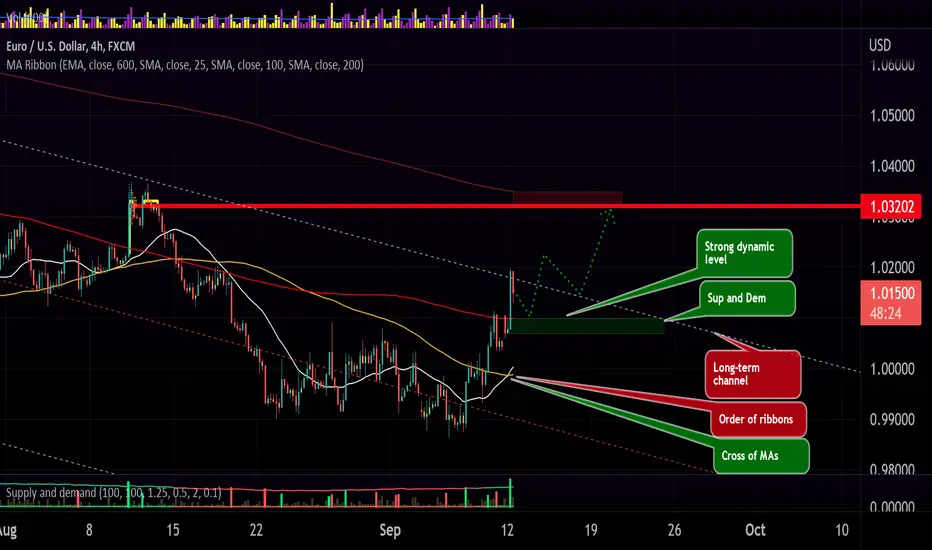
Ribbons and sup_and_dem analysis and trading setup for EURUSDAs you can see strong dynamic level is broken up and in case of probable reversal I will long the pair around the demand zone.
TP is around the VP of the last significant reversal which coincidence with dynamic level.
SL is just below the zone!
I think the long-term channel may be broken temporarily.
We do have chance to short from the VP level.
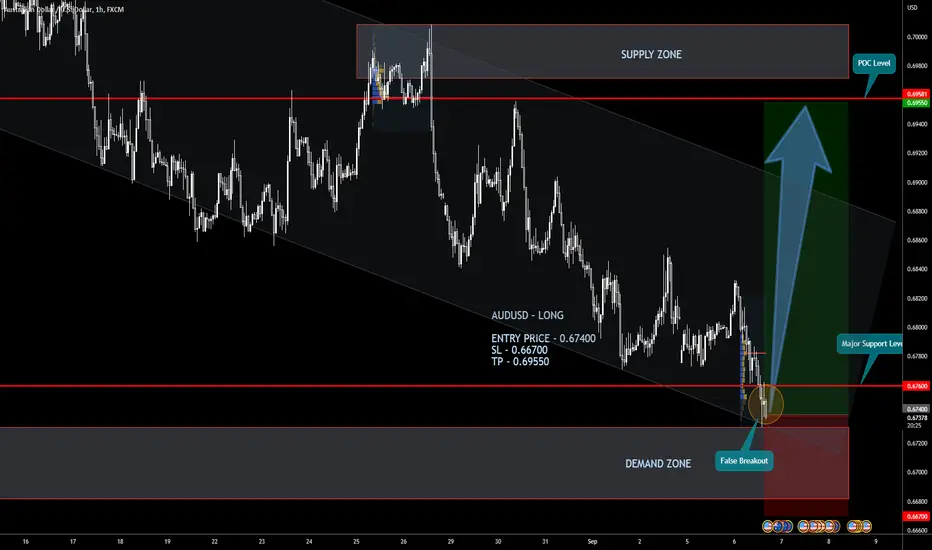
AUDUSD – LONGBuying opportunity from Major Support Level and Demand Zone . Buy on a false breakout! The target is next POC level in Supply Zone.
AUDUSD – LONG
ENTRY PRICE - 0.67400
SL - 0.66700
TP - 0.69550
Always follow the 6 Golden Rules of Money Management:
1. Protect your gains and never enter into a position without setting a stop loss.
2. Always trade with a Risk-Reward Ratio of 1 to 1.5 or better.
3. Never over-leverage your account.
4. Accept your losses, move on to the next trade and trust the software.
5. Make realistic goals that can be achieved within reason.
6. Always trade with money you can afford to lose.
Please leave your comment and support me with like if you agree with my idea. If you have a different view, please also share with me your idea in the comments.
Have a nice day!
GBPUSD - LONGConsider the formation of North Impulse from Major Resistance Level. Buy on a false breakout! The target is next Supply Zone.
GBPUSD - LONG
ENTRY PRICE - 1.14450
SL - 1.13700
TP - 1.18000
Always follow the 6 Golden Rules of Money Management:
1. Protect your gains and never enter into a position without setting a stop loss.
2. Always trade with a Risk-Reward Ratio of 1 to 1.5 or better.
3. Never over-leverage your account.
4. Accept your losses, move on to the next trade and trust the software.
5. Make realistic goals that can be achieved within reason.
6. Always trade with money you can afford to lose.
Please leave your comment and support me with like if you agree with my idea. If you have a different view, please also share with me your idea in the comments.
Have a nice day!

SP500 2022 expectationThis is what im expecting regarding $SPX price action for the rest of 2022.
Some volatility to the upside for the first half of september due to a lower CPI, but still a negative one. After CPI report, market will puke.

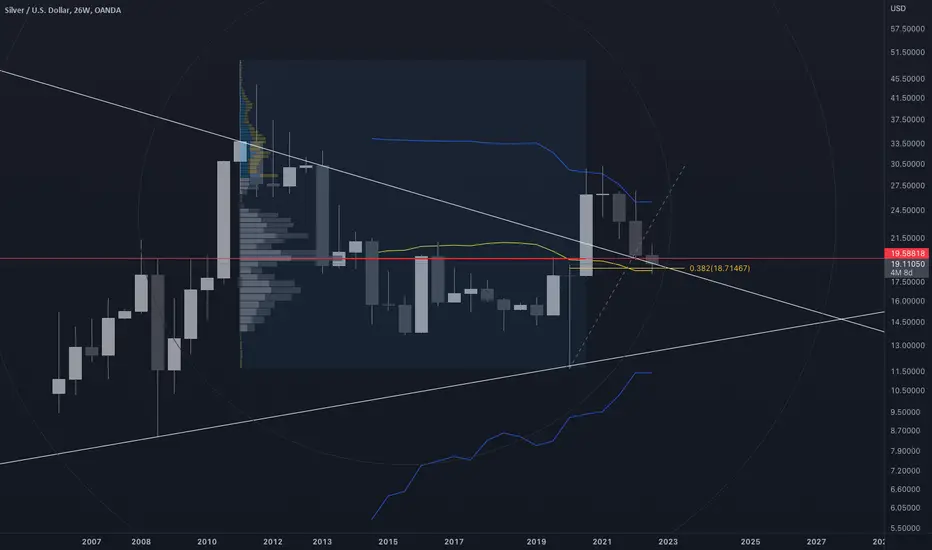
xagusd to $70?is xagusd going to find support here on the 6 month chart?
- mid bollinger band
- corrective poc from ATH to 2020 low
- golden pocket retrace of the move up
- candle apporaching fibo circle
- diagonal breakout retest
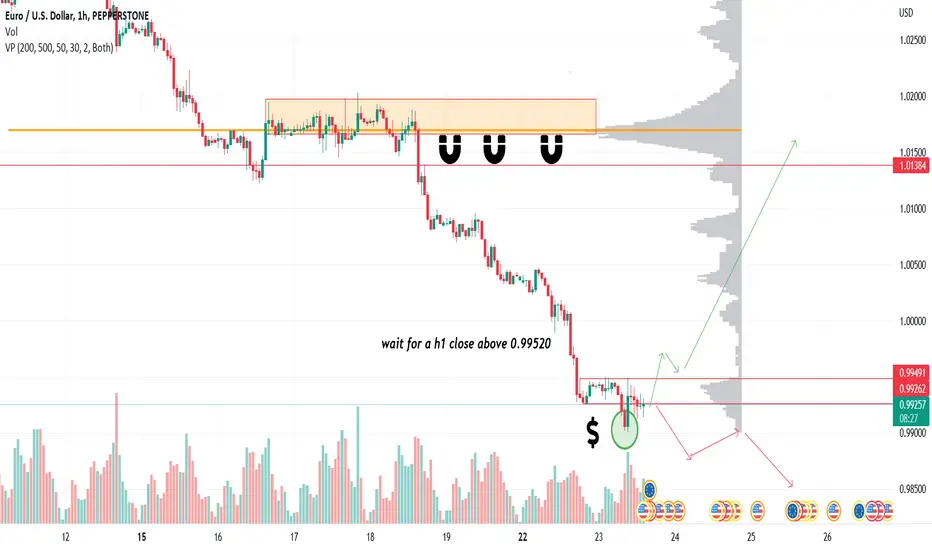
Liquidity overviewEURUSD H1
You can clearly see the Point of Control in volume profile, in that specific zone there is avoid of liquidity (asa IMBALANCE) and that zone will attract the price because big players will have to mitigate their trades.
Anyway we see that price is trading in a narrow range now, we should wait a potential breakout and the close of a H1 candle above the rsistance before placing a buy, if instead price goes down we will stay out of market.
The Italian Trader
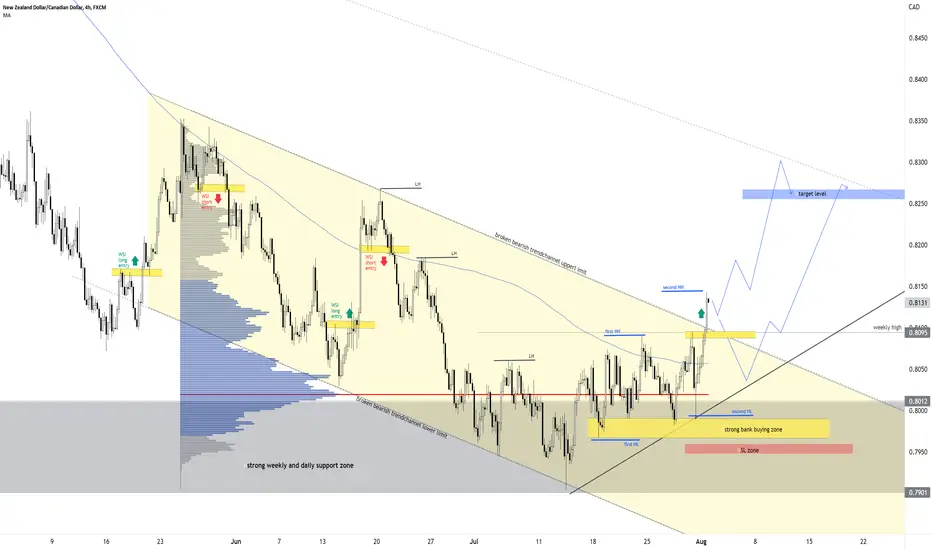
NZD/CAD: Bullish Reversal runningNZD/CAD: Bullish Reversal running
> breakout of bearish trendchannel
> Higher-high-higher-low sequence established
> weekly high broken to the upside
> 200er MA in H4 protecting downside
> next downward trendline fard away
> POC volume below current levels
The setup can potentially pull back a little before advancing. As we are Wall Street Swing Traders, our Stop Losses are far (see SL zone) to give our trades room to breath.
This way, we are achieving an unusually high success rate. I have included the past entries with the WSI H/L Wall Street system in the chart, as usual.
Feel free to reach out with any questions or comments.
Meikel & Your Team WSI
PS :
Join our stream tomorrow! The link will follow shortly in the comments.... See you there!
EUR/CAD - Ongoing Short BreakEUR/CAD - Ongoing Short Break
> Bullish Trendchannel broken to the downside
> last higher low invalidated
> POC above current price
> Small bearish trendchannel established
EUR/CAD is the mirror image of CAD/CHF (which in turn looks long).
The current market environment is rocky, so use proper risk management if you position yourself in the short direction.

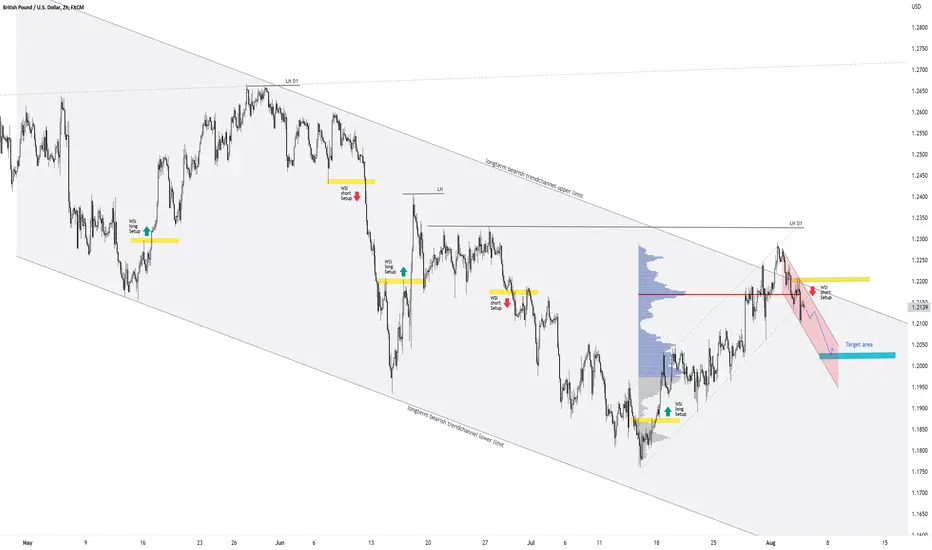
GBP/USD: Continuation of bearish trendGBP/USD: Continuation of bearish trend
> Overarching bearish trend
> Bullish correction broken to the downside
> 200er MA + POC above current price
> Bearish Engulfing Trigger + Follow-up candle
Probablity of a short move high. Please manage your risk in the current markets. Markets are very skittish and irrational. We are trading with 0.5% maximum.
Best
Meikel & Team WSI
Short Entry Setup on SPY @ POC resistanceThe Volume profile for the SPY is painting a picture of near-term resistance for SPY and using the breakdown of the august trendline as entry criteria.

Next possible short on Nifty, MAYBE?Most 786+ POC confluence gives out great possibilities for an entry, one such entry is around the corner.
Why bear?
we are forming lower high on high time frame, gives me a reason this will continue as we have lower levels to visit especially the 618 fib fan.
Here we can see most of the fib fan working, even on the 2008 crash we found support at 618.
This analysis is to be taken as a form of hedge, I'm not saying this will work but in the technical analysis world we are at resistance, its time to enter short (under the correct conditions).
How to enter?
This is my expectations (in an ideal situation) take out the support and flip bearish.

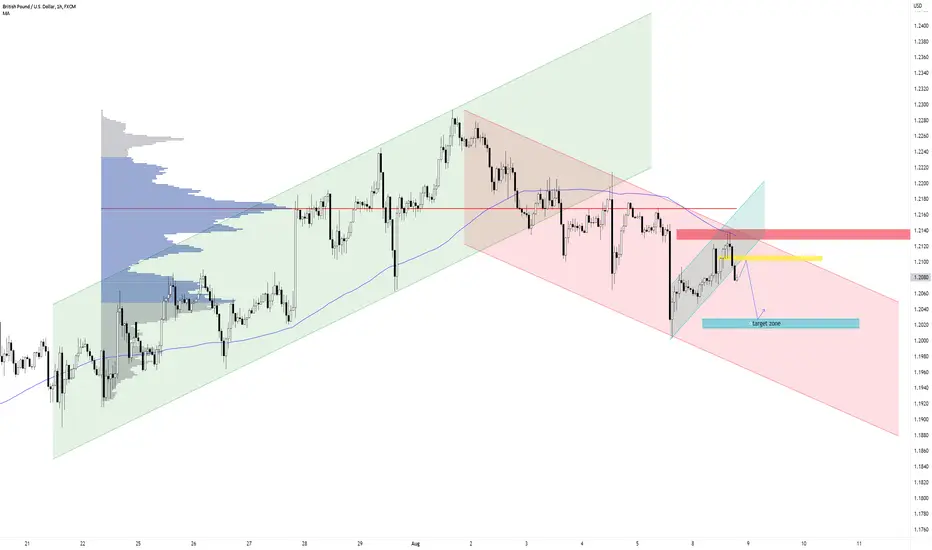
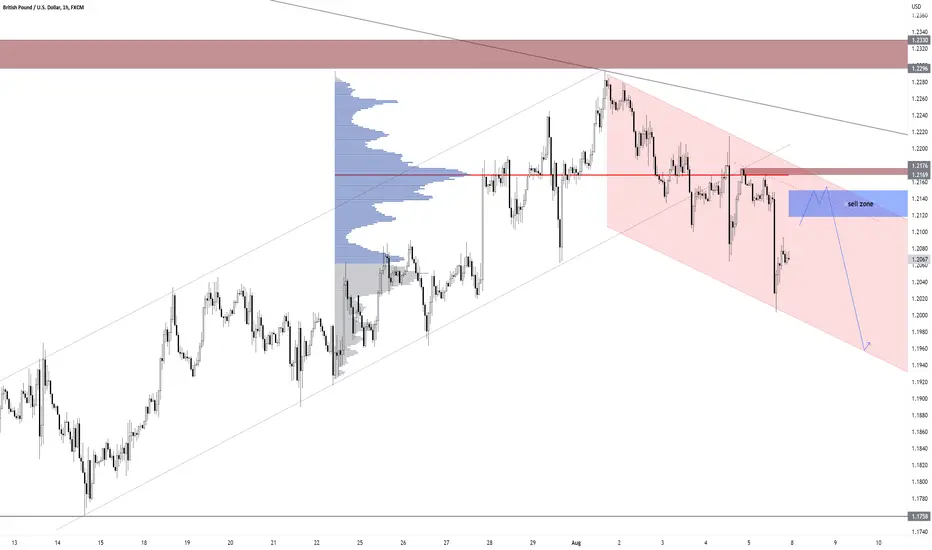
GBP/USD: Short Trendtrade H1GBP/USD: Short Trendtrade H1
> H4 structural break
> LH and LL established
> POC above current price
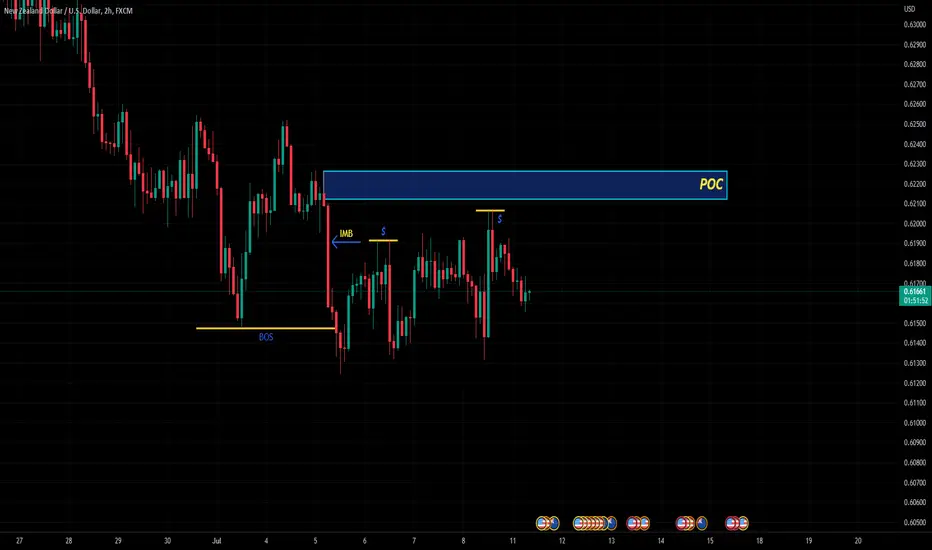
> BOS is our sell zone
This is a short-term H1 Setup, coupled with the preceeding H4 structural break.
We already published the H4 idea, but this setup can be used further.
Meikel & Team WSI
GBP/USD: Short about to rolloverGBP/USD: Short about to rollover
> Price at upper end of overarching bearish trendchannel
> Break of inner bullish trend to the downside
> LL-LH-Sequence
> POC above current price
> General USD-strength ahead of NFP on Friday
Generell USD strength after strong ISM data. Short move likely. Only event risk: NFP on Friday.
As always: Manage your risk, especially during the summer months.
Meikel & Team WSI
Price within liquidity rangeThe price passing through the liquidity area can continue its downward movement in the main trend when it meets the first orders area.