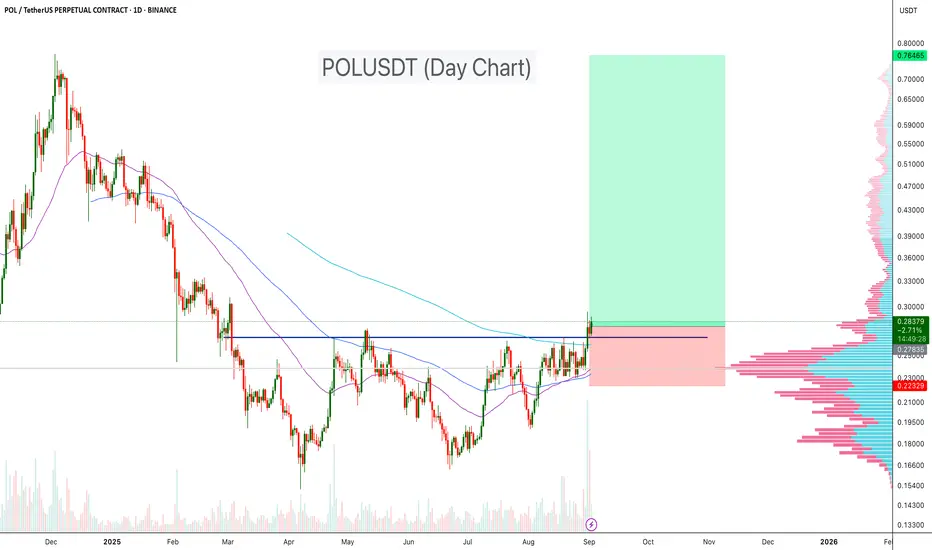
POLUSDT Reversal Confirmed!POLUSDT is showing a strong bullish reversal setup on the daily chart. The price has broken above resistance and both the 100 EMA and 200 EMA, signaling a momentum shift to the upside. A clear double bottom pattern has formed, with a breakout above the neckline resistance, confirmed by high trading volume. These technical signals suggest that the market structure is turning bullish, and as long as the price holds above the breakout zone and EMA support, there is strong potential for continuation toward higher resistance levels.
Key Points:
- Price trading above 100 & 200 EMA
- Double bottom neckline breakout
-Breakout supported by high volume
- Volume profile shows major accumulation below current price, lighter resistance above
Cheers
Hexa
POLUSDC
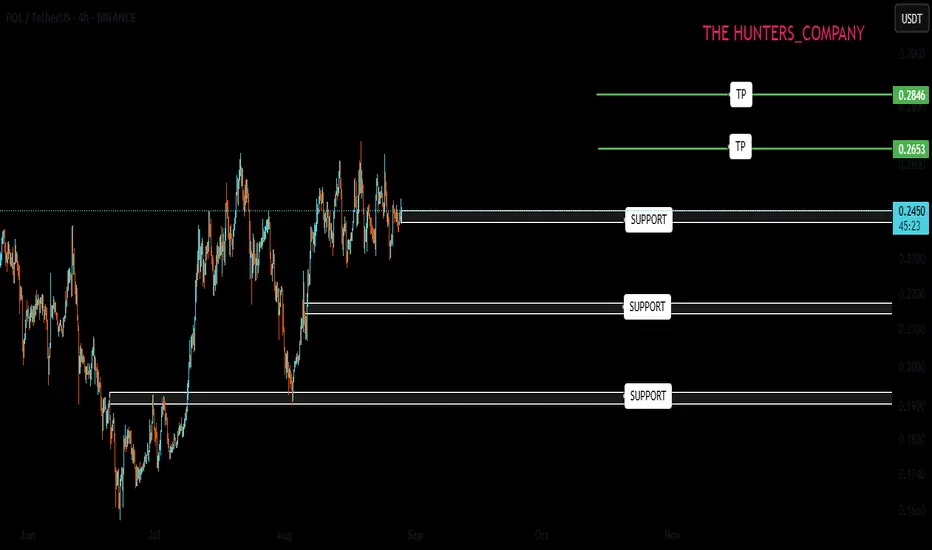
POL ; Important supportHello friends
Given the upward trend we had, now that the price has corrected, we have identified important and good support areas for you, and if these supports are maintained and stabilized above, the price can move to the specified targets.
Trade safely with us
POL/USDT Preparing for a Major Breakout?📊 Chart Overview:
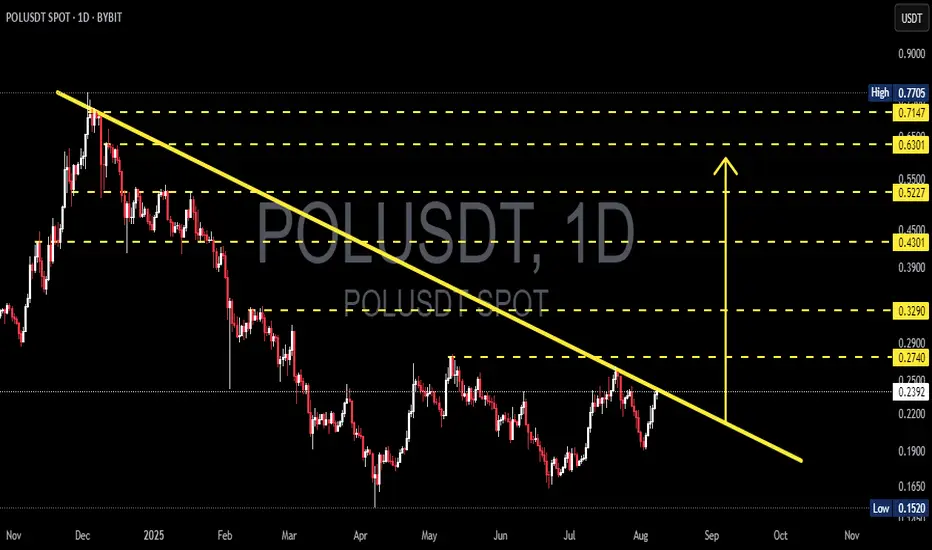
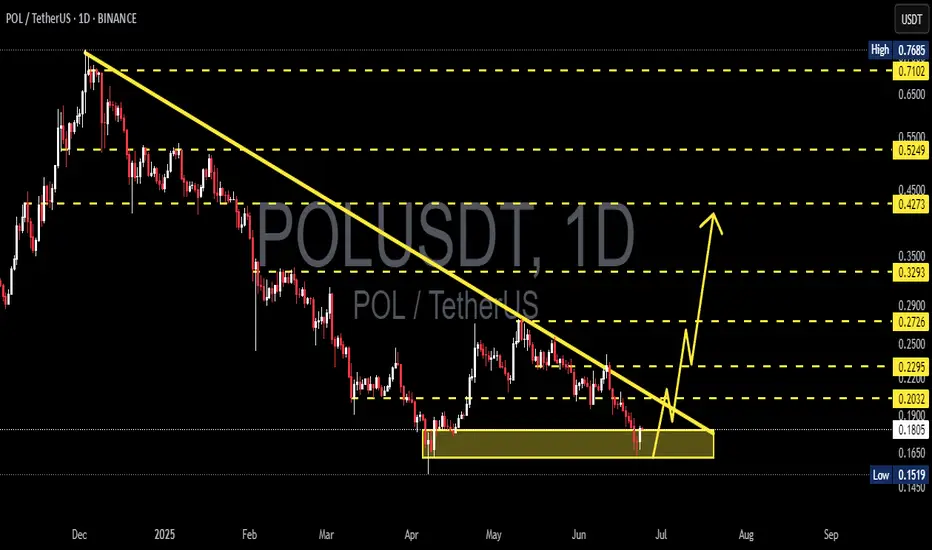
POL/USDT is currently showing signs of a potential trend reversal after months of sustained bearish momentum. The price is now testing a long-term descending trendline that has acted as a strong resistance since the November 2024 peak — and this moment could be a critical turning point for the market.
---
📌 Pattern Structure & Technical Setup:
🔸 Primary Pattern: Descending Trendline, capping every rally since late 2024.
🔸 Potential Reversal Structure: Falling Wedge Pattern – often a bullish reversal signal, supported by weakening bearish pressure and a series of higher lows forming since June 2025.
🔸 Current Position: Price is testing the trendline resistance around the $0.24–$0.27 zone.
---
📍 Key Price Levels:
✅ Resistance:
$0.2740 → Key breakout level; confirmation of trendline break.
$0.3290 → Important horizontal level, previously acted as major support.
$0.4301 – $0.7147 → Extended bullish targets based on Fibonacci retracement and historical price memory zones.
🛑 Support:
$0.2200 → Minor support if price rejects the trendline.
$0.1520 → Major long-term support (current all-time low).
---
📈 Bullish Scenario (Breakout Case):
If price successfully breaks and closes above $0.2740, we could expect:
Confirmation of a long-term downtrend breakout.
A shift in market sentiment from bearish to bullish.
Short-term target: $0.3290 → then $0.4301.
Higher upside potential if volume supports the breakout and altcoin momentum strengthens.
> 🚀 Volume will be the key validator – a breakout without volume = weak signal.
---
📉 Bearish Scenario (Rejection Case):
If the price fails to break the trendline:
Likely rejection and pullback toward the $0.2200 support zone.
If selling pressure increases, a retest of the $0.1520 demand zone is possible.
This would extend the consolidation phase or confirm continued bearish control over the medium term.
---
🔍 Conclusion & Trading Strategy:
POL/USDT is at a technical decision point. A confirmed breakout could mark the end of the accumulation/distribution phase and trigger a new bullish leg.
📌 Strategy Overview:
Breakout Traders: Enter after confirmed daily close above $0.2740, target levels above.
Reversal Traders: Enter conservatively after a retest of the breakout zone with a tight SL.
Bearish Traders: Consider shorts on strong rejection at the trendline, targeting $0.22 → $0.15.
---
🧠 Extra Notes:
Watch Bitcoin dominance and overall market sentiment.
Volume confirmation is crucial for validating breakout strength.
Be cautious of fakeouts, especially around dynamic resistance like trendlines.
#POLUSDT #CryptoBreakout #FallingWedge #AltcoinAnalysis #TechnicalAnalysis #CryptoSetup #PriceActionTrading #BullishBreakout #BearishScenario #CryptoReversal #TrendlineBreakout
POLUSDT 1D AnalysisPOL ~ 1D Analysis
#POL This coin is currently at its lowest support. Buy if you still have confidence in this coin with a short term target of at least 15%+ from this support.
POLUSDT 1D Analysis POL ~ 1D Analysis
#POL Buy gradually from here if you still have confidence in this coin with a short term target of at least 15%++ from here.
POLUSDT 1D AnalysisPOL ~ 1D Analysis
#POL Buy gradually from here if you still have a Conviction on this coin with a short -term target of at least 15%+ from here.
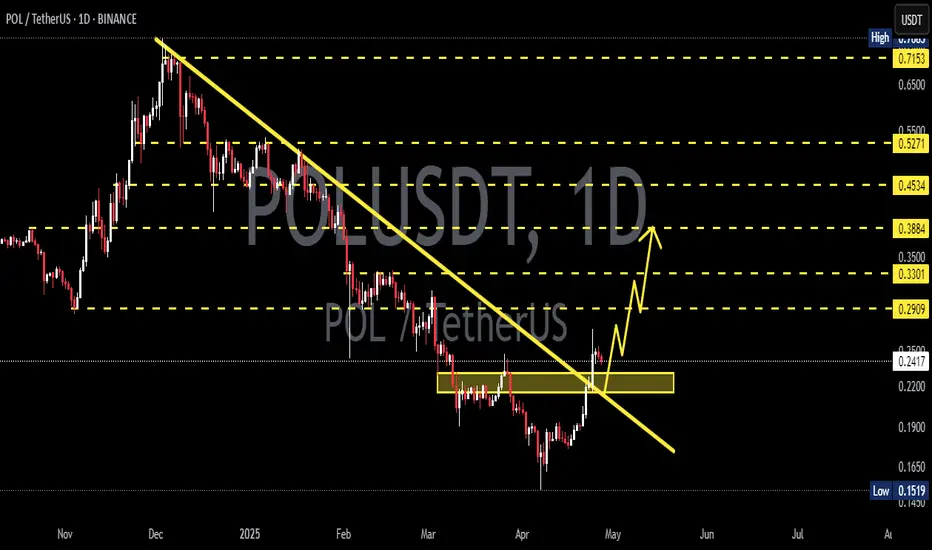
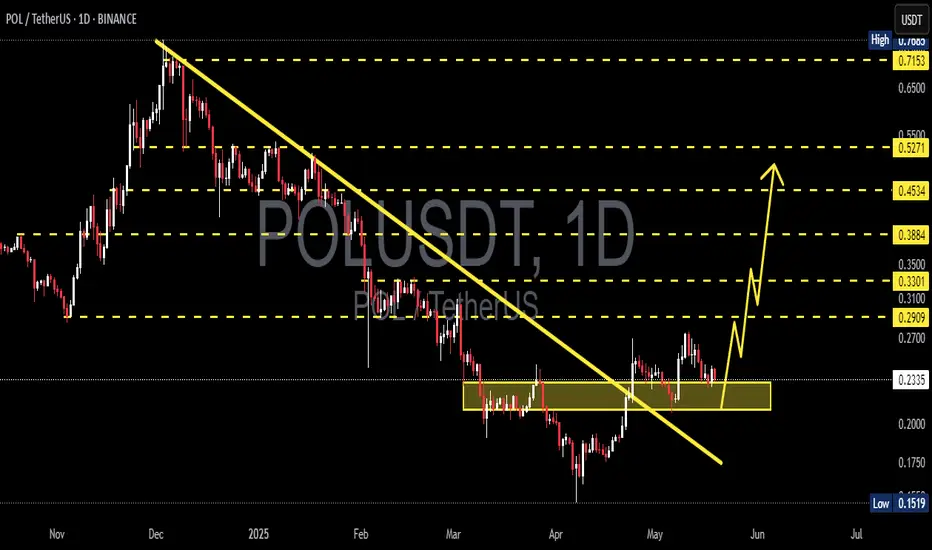
POL is breakout out of the descending wedge upper trend line.POLYGON is now trading outside the upper trendline of the descending wedge pattern and may be preparing for a substantial move in the month of May.
Good luck, and always use a stop-loss!

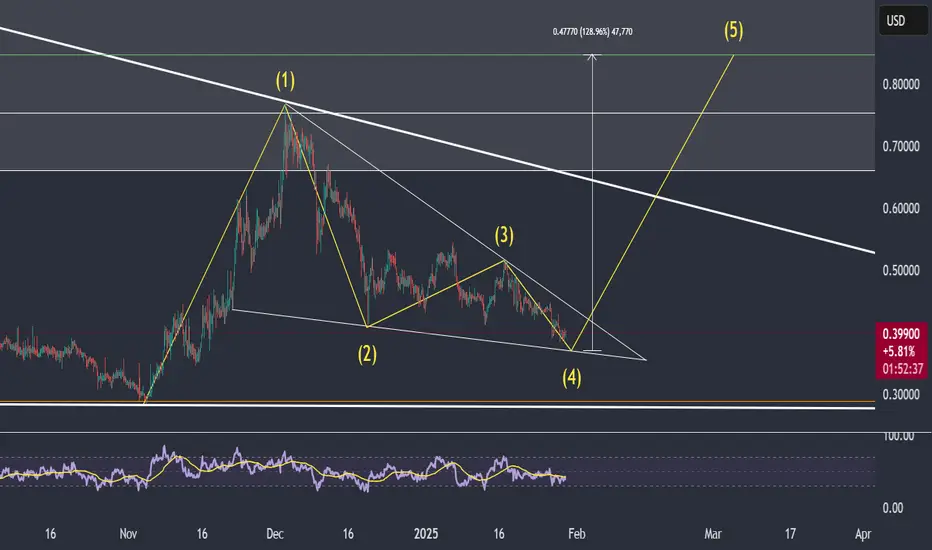
MATIC returning to equilibrium would be a 128% gain from here!MATIC is looking extremely undervalued at current levels. The price has pulled back considerably since the "Trump election pump" and is forming a nice wedge on the 4-hour chart, which is currently on a four-count. A price move back to equilibrium from the wedge's bottom trendline would, by itself, result in approximately a 128% gain.
Longer term, if the price breaks out of the monthly chart wedge pattern (see comments below for the chart), which is also currently trading at a four-count, we could see some incredible price appreciation over the next 6 to 9 months.
Good luck, and always use a stop-loss!
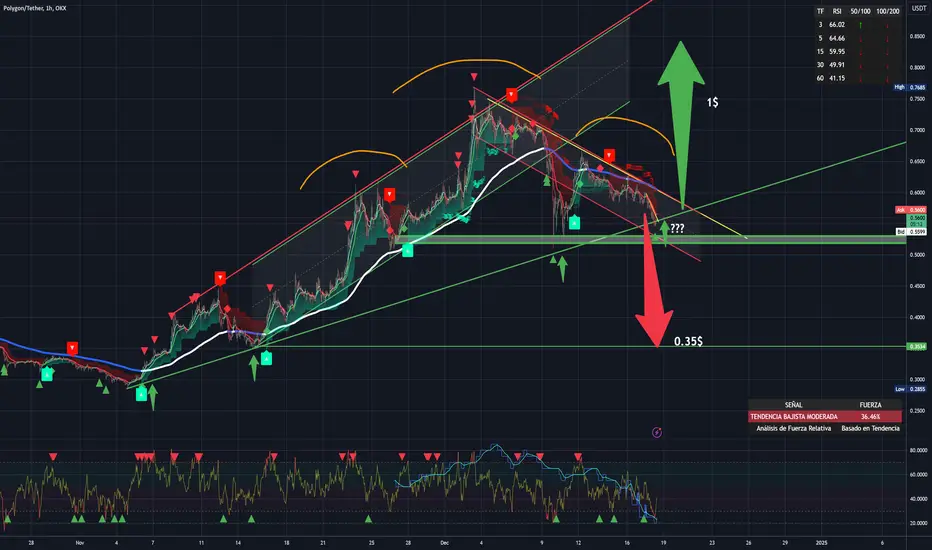
POLUSDT - 1H - Critical point: $0.35 - $1POLUSDT - 1H - Critical point: $0.35 - $1
TRADEX BOT NEWS:
We are continuing to move forward with the development of the CEX autotrading bot. At the moment we are testing it on OKx accounts, but we are working to include other exchanges: binance, coinbase, krakken...
We have also added "all" of the exchange's trading pairs.
This will be the first version of TradeX BoT, which will work as a second layer Order Book in CEX markets, hiding our greed (TP) and fears (SL) from the exchanges.
We will have more news soon!
Thank you!
_______________________________________________________
POLUSDT - 1H - Critical point: $0.35 - $1
We are in the support zone of the current bullish trend. It should be a good support point to boost the price up to $0.98-$1.
On the contrary, if it continues to delve into its current bearish channel, it could lose all interest for the investor and could collapse to $0.34 - $0.35.
__________________________________________________
Automated Cryptocurrency Trading Bots: All these strategic alternatives can be configured with TradeX BoT, since it will allow you to position in both directions without having to block any amount per position. It will only be necessary for the conditions to be met, either downward or upward, for the orders to be executed in one direction or another, taking the necessary deposits from your portfolio.
TradeX BoT (in development): Tool to automate trading strategies designed in TradingView. It works with both indicators and technical drawing tools: parallel channels, trend lines, supports, resistances... It allows you to easily establish SL (%), TP (%), SL Trailing... multiple strategies in different values, simultaneous BUY-SELL orders, conditional orders.
This tool is in the process of development and the BETA will soon be ready for testing.
FOLLOW ME and I will keep you informed of the progress we make.
I share with you my technical analysis assessments on certain values that I follow as part of the strategies I design for my portfolio, but I do not recommend anyone to operate based on these indicators. Inform yourself, educate yourself and build your own strategies when investing. I only hope that my comments help you on your own path :)