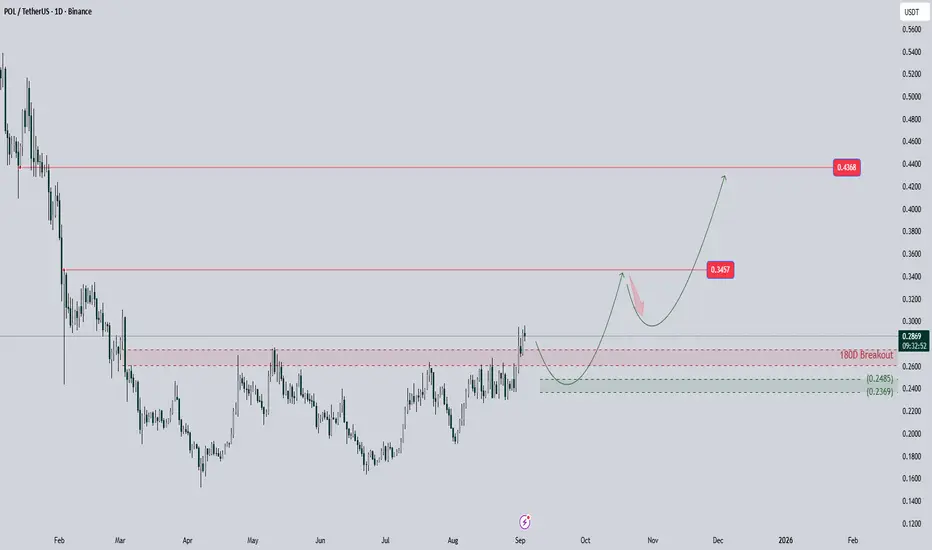
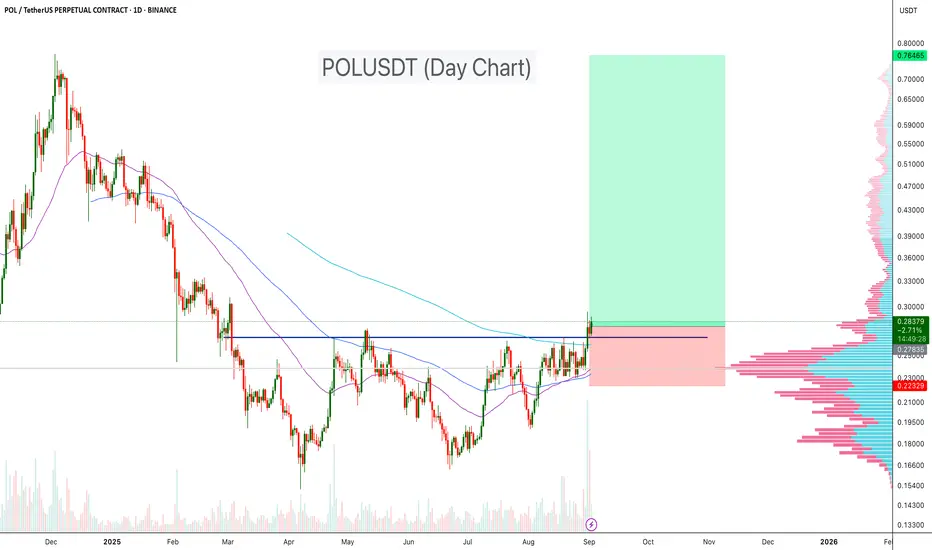
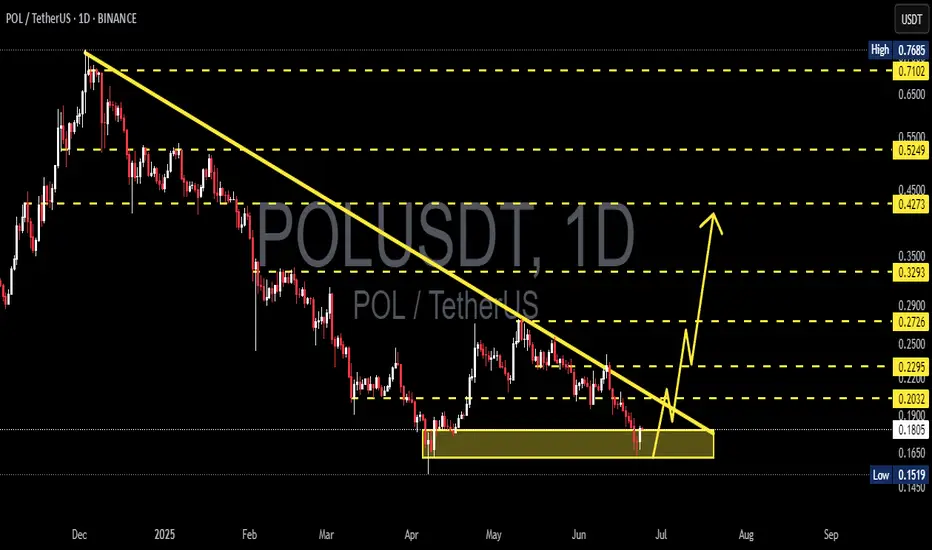
Ready for the POL RallyAfter 180 days of being in a range and below the resistance line, the BINANCE:POLUSDT has finally broken the resistance area and given us the confirmation we need to ascend to higher prices.
However, before the move starts, I would like it to return to the box marked in green on the chart and then begin its upward movement. For the long-term targets, I have marked two red lines, which could be the long-term goals. There is also a possibility that it could reach these targets quickly with sharp moves.
⛔ This is not financial advice; do your own research.
Polusdtsignal
POL/USDT Trade Idea💎 BINANCE:POLUSDT Trade Idea 💎
📊 Pattern spotted: Double Bottom ✅
This setup indicates strong support around 0.2800 and signals a possible bullish reversal.
⚡ Entry (Advanced): 0.2860 – 0.2870
🎯 Target (TP): 0.2960
🛡️ Stop Loss (SL): 0.2800
✨ Risk/Reward: Low Risk – High Profit 🚀
This is an advanced entry with tight SL and strong upside potential.
📈 If the neckline breaks and sustains above, we can expect a bullish move towards the target.
🔑 Summary: Double Bottom gives confidence of reversal 📉➡️📈. Perfect setup for traders who like low loss & high reward opportunities.
POLUSDT Reversal Confirmed!POLUSDT is showing a strong bullish reversal setup on the daily chart. The price has broken above resistance and both the 100 EMA and 200 EMA, signaling a momentum shift to the upside. A clear double bottom pattern has formed, with a breakout above the neckline resistance, confirmed by high trading volume. These technical signals suggest that the market structure is turning bullish, and as long as the price holds above the breakout zone and EMA support, there is strong potential for continuation toward higher resistance levels.
Key Points:
- Price trading above 100 & 200 EMA
- Double bottom neckline breakout
-Breakout supported by high volume
- Volume profile shows major accumulation below current price, lighter resistance above
Cheers
Hexa
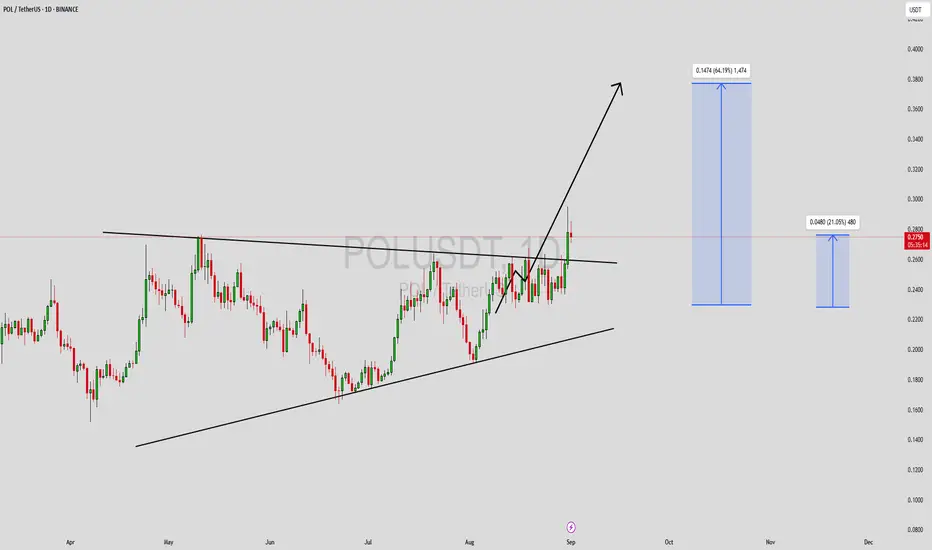
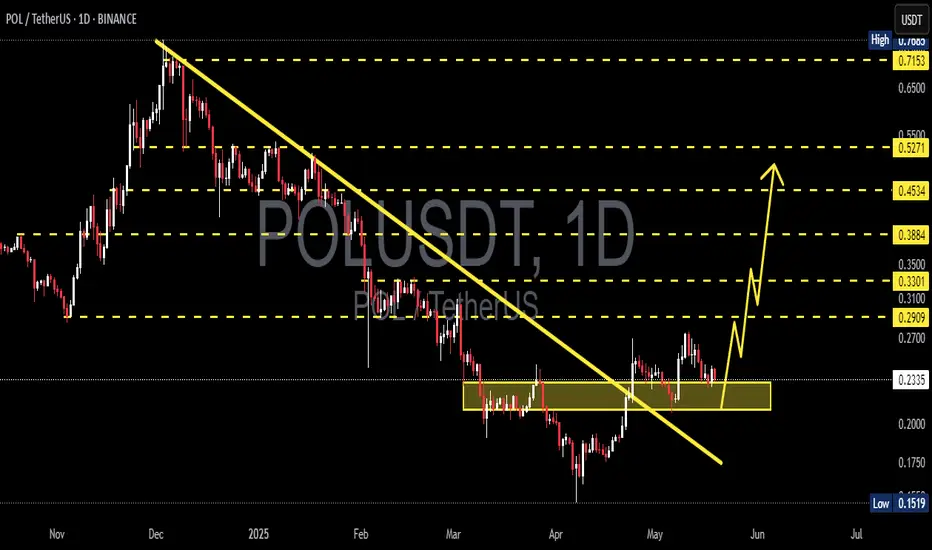
POLUSDT Forming Bullish WavePOLUSDT is showing an interesting technical setup as the price consolidates within a broader ascending structure. After weeks of accumulation, the pair has recently attempted a breakout, supported by growing investor interest and consistent trading volume. This suggests that the market is preparing for a strong move, with potential upside targets aligning well with the 50% to 60%+ gain expectation.
The price action highlights a bullish breakout structure, where higher lows and repeated resistance testing indicate increasing buying pressure. If this breakout sustains, POLUSDT could accelerate toward higher price zones, fueled by momentum traders and fresh inflows of capital. Such patterns often act as the beginning of a larger bullish wave, which makes this setup highly relevant for short to mid-term traders.
Investor sentiment around this project has been improving, with many considering POLUSDT as an undervalued opportunity compared to other crypto pairs. The combination of good volume, favorable technicals, and renewed interest strengthens the probability of further upside continuation. Traders should closely monitor breakout confirmations as the price approaches critical resistance levels.
✅ Show your support by hitting the like button and
✅ Leaving a comment below! (What is You opinion about this Coin)
Your feedback and engagement keep me inspired to share more insightful market analysis with you!
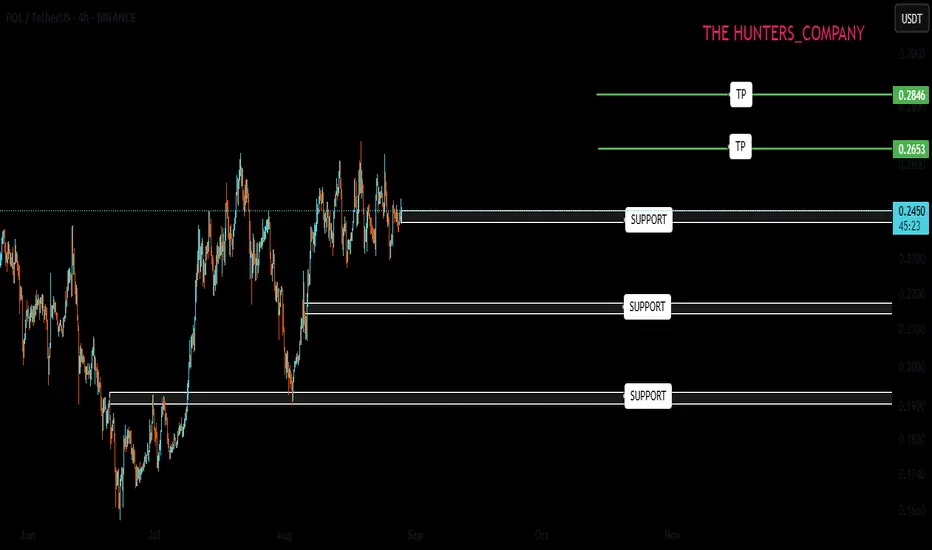
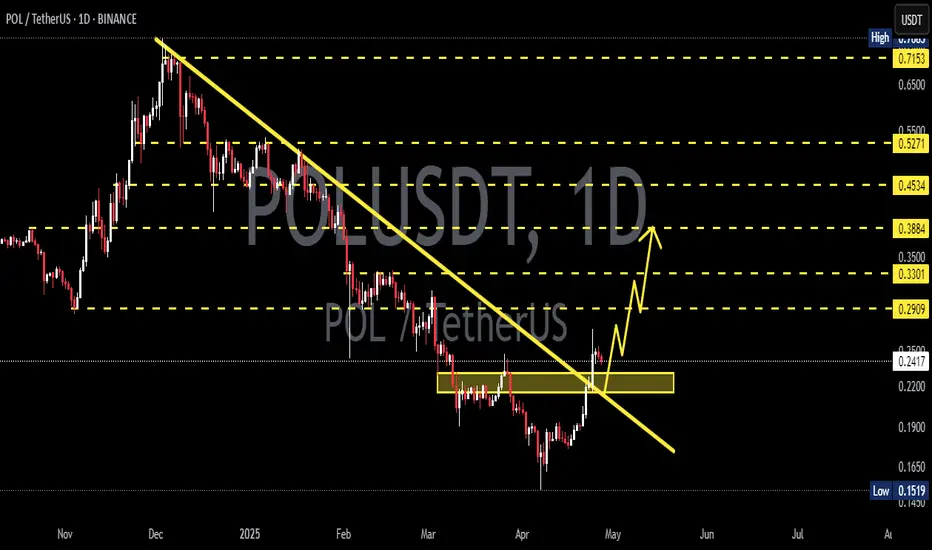
POL ; Important supportHello friends
Given the upward trend we had, now that the price has corrected, we have identified important and good support areas for you, and if these supports are maintained and stabilized above, the price can move to the specified targets.
Trade safely with us
POL/USDT Preparing for a Major Breakout?📊 Chart Overview:
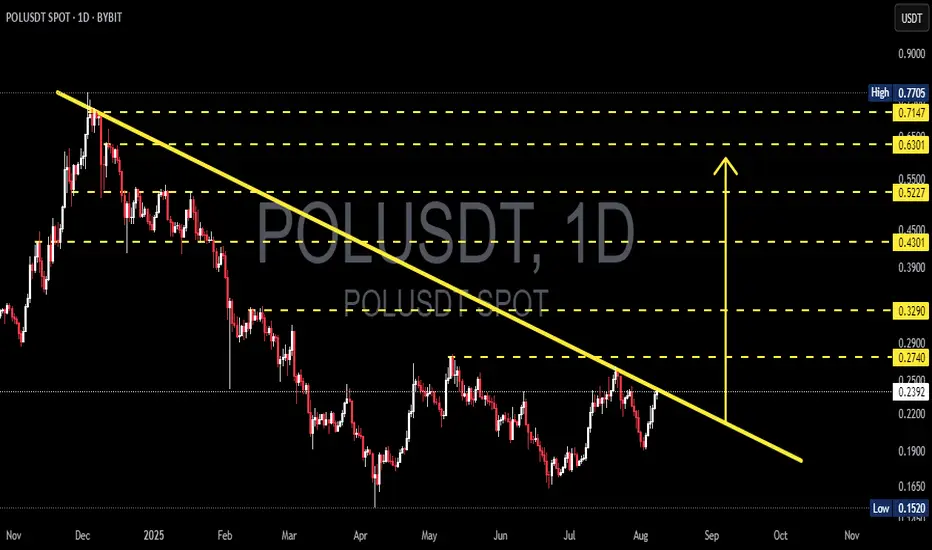
POL/USDT is currently showing signs of a potential trend reversal after months of sustained bearish momentum. The price is now testing a long-term descending trendline that has acted as a strong resistance since the November 2024 peak — and this moment could be a critical turning point for the market.
---
📌 Pattern Structure & Technical Setup:
🔸 Primary Pattern: Descending Trendline, capping every rally since late 2024.
🔸 Potential Reversal Structure: Falling Wedge Pattern – often a bullish reversal signal, supported by weakening bearish pressure and a series of higher lows forming since June 2025.
🔸 Current Position: Price is testing the trendline resistance around the $0.24–$0.27 zone.
---
📍 Key Price Levels:
✅ Resistance:
$0.2740 → Key breakout level; confirmation of trendline break.
$0.3290 → Important horizontal level, previously acted as major support.
$0.4301 – $0.7147 → Extended bullish targets based on Fibonacci retracement and historical price memory zones.
🛑 Support:
$0.2200 → Minor support if price rejects the trendline.
$0.1520 → Major long-term support (current all-time low).
---
📈 Bullish Scenario (Breakout Case):
If price successfully breaks and closes above $0.2740, we could expect:
Confirmation of a long-term downtrend breakout.
A shift in market sentiment from bearish to bullish.
Short-term target: $0.3290 → then $0.4301.
Higher upside potential if volume supports the breakout and altcoin momentum strengthens.
> 🚀 Volume will be the key validator – a breakout without volume = weak signal.
---
📉 Bearish Scenario (Rejection Case):
If the price fails to break the trendline:
Likely rejection and pullback toward the $0.2200 support zone.
If selling pressure increases, a retest of the $0.1520 demand zone is possible.
This would extend the consolidation phase or confirm continued bearish control over the medium term.
---
🔍 Conclusion & Trading Strategy:
POL/USDT is at a technical decision point. A confirmed breakout could mark the end of the accumulation/distribution phase and trigger a new bullish leg.
📌 Strategy Overview:
Breakout Traders: Enter after confirmed daily close above $0.2740, target levels above.
Reversal Traders: Enter conservatively after a retest of the breakout zone with a tight SL.
Bearish Traders: Consider shorts on strong rejection at the trendline, targeting $0.22 → $0.15.
---
🧠 Extra Notes:
Watch Bitcoin dominance and overall market sentiment.
Volume confirmation is crucial for validating breakout strength.
Be cautious of fakeouts, especially around dynamic resistance like trendlines.
#POLUSDT #CryptoBreakout #FallingWedge #AltcoinAnalysis #TechnicalAnalysis #CryptoSetup #PriceActionTrading #BullishBreakout #BearishScenario #CryptoReversal #TrendlineBreakout
POLUSDT 1D AnalysisPOL ~ 1D Analysis
#POL This coin is currently at its lowest support. Buy if you still have confidence in this coin with a short term target of at least 15%+ from this support.
POLUSDT 1D Analysis POL ~ 1D Analysis
#POL Buy gradually from here if you still have confidence in this coin with a short term target of at least 15%++ from here.
#POL/USDT#POL
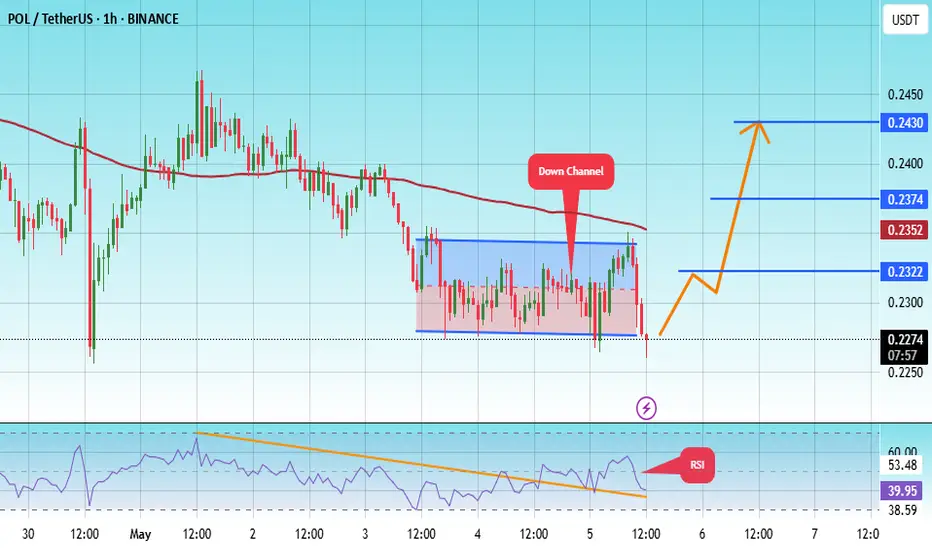
The price is moving within a descending channel on the 1-hour frame, adhering well to it, and is on its way to breaking it strongly upwards and retesting it.
We are seeing a rebound from the lower boundary of the descending channel, which is support at 2270.
We have a downtrend on the RSI indicator that is about to break and retest, supporting the upward trend.
We are looking for stability above the 100 moving average.
Entry price: 0.2270
First target: 0.2322
Second target: 0.2374
Third target: 0.2430
POLUSDT 1D AnalysisPOL ~ 1D Analysis
#POL Buy gradually from here if you still have a Conviction on this coin with a short -term target of at least 15%+ from here.
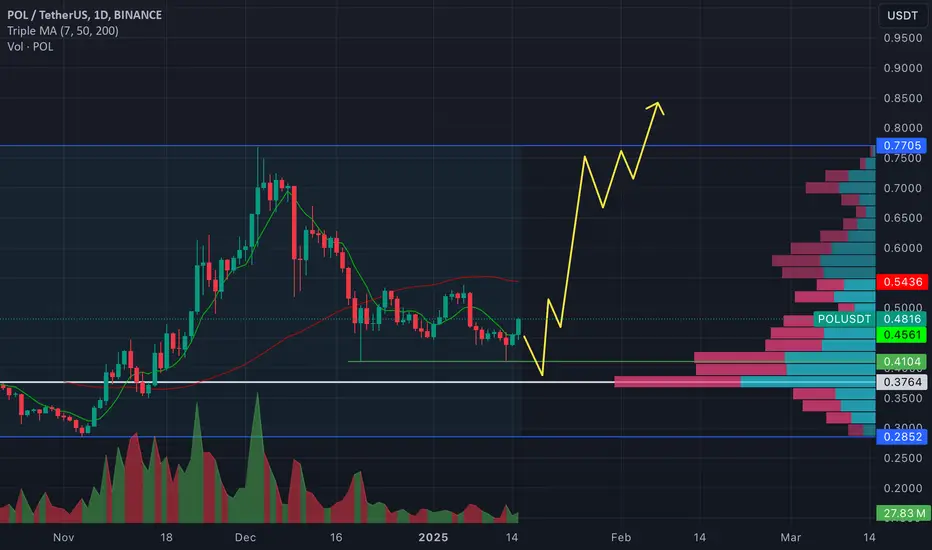
Polygon is ready to take off!Hi fellow traders, POLUSDT is ready to make a move higher after completing the complex correction in WXY formation. Target the 0.8414 level. Good luck and trade safe!

POL/USDT Trading ScenarioIn November, POL showed confident growth driven by euphoria following the U.S. presidential election results. The asset's price surged from $0.2852 to $0.7705, marking a gain of over 160%. However, profit-taking by market participants soon followed, resulting in a correction that now exceeds 46%.
Currently, seller activity appears to be waning, with a support level forming at $0.4104, from which the price has rebounded twice. Volume profile analysis indicates that POL has stabilized within a zone of market interest.
Further declines may occur as liquidity from short-term players is absorbed, potentially setting the stage for a trend reversal. The recovery dynamics and subsequent growth of the asset are largely influenced by U.S. macroeconomic indicators. Special attention is being paid to the Federal Reserve's decisions on adjusting the key interest rate, which are revised based on current data.