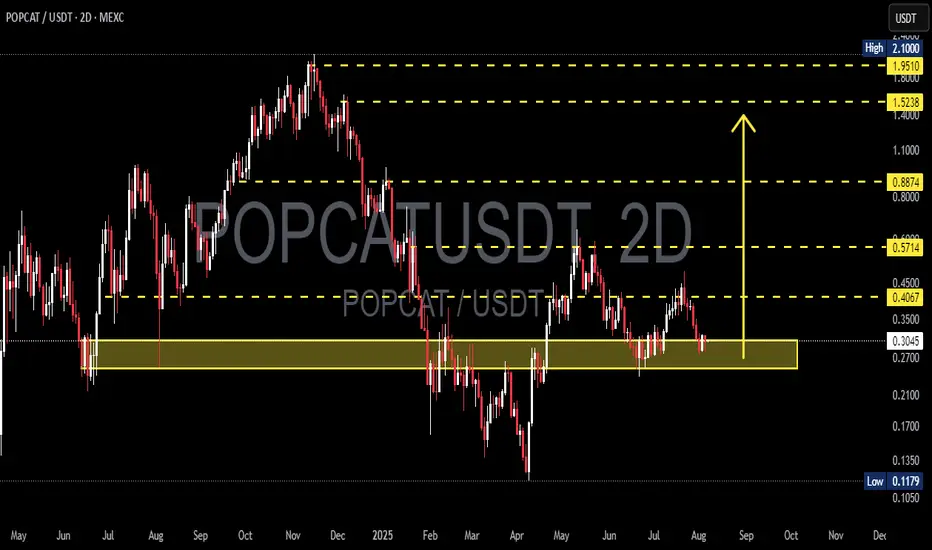
POPCAT/USDT – Testing Demand Zone: Reversal or Breakdown?POPCAT/USDT is currently retesting one of the most crucial demand zones in its mid-term price structure, located between $0.2700 – $0.3037. This area has historically acted as a strong support level and has triggered significant rebounds in the past. The market's reaction here will be key in determining whether POPCAT is ready for a bullish reversal or heading for a deeper correction.
---
🔍 Market Structure & Price Action
The price has entered a sideways consolidation phase after a steady decline from the $0.4067 region.
So far, the support zone at $0.2700 has been respected multiple times, indicating buying interest remains active.
However, no clear bullish reversal pattern has formed yet, making the next movement critical.
---
🟢 Bullish Scenario (Reversal / Bounce)
If the price manages to hold above this demand zone and forms a higher low along with a strong bullish candlestick confirmation, we could see a potential trend reversal.
🎯 Potential bullish targets:
TP1: $0.4067 – Minor resistance, top of the current range.
TP2: $0.5714 – Mid-range resistance, a previous breakdown zone.
TP3: $0.8874 – Major resistance, the last high before the steep drop.
TP4: $1.5238 – $1.9510 – Psychological resistance zone, possible medium-term swing targets if bullish momentum strengthens.
🔐 Key confirmations:
Bullish engulfing / hammer candlestick on the 2D chart.
Increase in volume + breakout above range resistance.
---
🔴 Bearish Scenario (Breakdown Continuation)
If the price fails to hold $0.2700 and we see a clear daily or 2D candle close below the demand zone, this would indicate loss of bullish strength and open room for further downside.
🎯 Bearish targets:
TP1: $0.2100 – Psychological support level.
TP2: $0.1179 – All-time low and historical bottom.
⚠️ Risk factors:
Strong bearish candle close + high volume breakdown would confirm sellers’ dominance.
---
🧩 Pattern & Formation Insights
A horizontal base / accumulation range is visible within the demand zone.
If the price rebounds, we could be forming a double bottom – a classic reversal signal.
However, if the zone breaks, the chart may develop into a descending channel or bearish continuation pattern.
---
🧠 Trading Strategy Outlook
Swing Traders: Consider long entries within the demand zone ($0.2700–$0.3037) with a tight stop-loss just below the zone. Aim for multiple resistance levels as take-profit targets.
Breakout Traders: Wait for confirmation above $0.4067 with increased volume.
Bearish Setup: Short entry upon breakdown below $0.2700 with targets towards the next support zones.
#POPCAT #AltcoinAnalysis #CryptoTechnicalAnalysis #DemandZone #BreakoutOrBreakdown #USDT #MEXC #SwingTrade #CryptoSetup #BullishReversal #BearishBreakdown #ChartAnalysis #TradingView
Popcatsignals
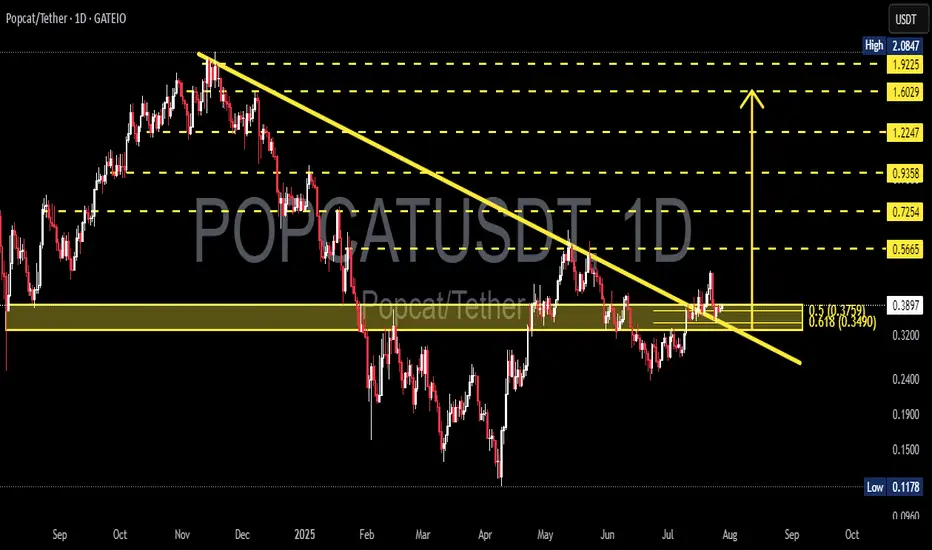
POPCATUSDT – Breakout Confirmation or False Signal?On the daily chart of POPCATUSDT, the price has recently broken out of a descending trendline that has been acting as resistance since December 2024. This breakout signals a potential trend reversal from bearish to bullish.
Currently, the price is in a retest phase, revisiting the breakout zone, which also aligns with a strong support and Fibonacci retracement area:
Support zone: $0.34 – $0.38
Fibonacci 0.618: $0.3490 (major technical support)
Fibonacci 0.5: $0.3759 (typical retest level after breakout)
If the price holds above this zone and forms a bullish confirmation candle, it strengthens the case for continued upward momentum.
---
Pattern and Market Structure:
Descending Triangle Breakout: The price has broken out of a long-standing descending triangle pattern, which is typically a bullish reversal signal — especially if supported by volume (not shown in chart but crucial).
Neckline Retest: The current move is retesting the breakout zone, a common behavior after significant breakouts.
---
Bullish Scenario:
If the price holds above the $0.34–$0.38 zone and forms bullish price action:
Potential targets based on Fibonacci levels:
Target 1: $0.5665
Target 2: $0.7254
Target 3: $0.9358
Major targets: $1.2247 and possibly $1.6029 if bullish momentum sustains
---
Bearish Scenario:
If the price fails to hold above $0.34 and breaks down below the support:
Potential downside towards $0.26 – $0.20 zone
If selling pressure intensifies, it may revisit the key support low around $0.1178
---
Conclusion:
POPCATUSDT is at a critical decision point. The breakout from the descending trendline is an early bullish signal, but confirmation from the $0.34–$0.38 retest zone is essential. If it holds, a strong bullish rally may follow. However, a failure to hold could signal a false breakout and resume the bearish trend.
#POPCAT #POPCATUSDT #CryptoBreakout #AltcoinAnalysis #ChartPatterns #TechnicalAnalysis #FibonacciLevels #CryptoTrading #BullishSetup #BearishScenario
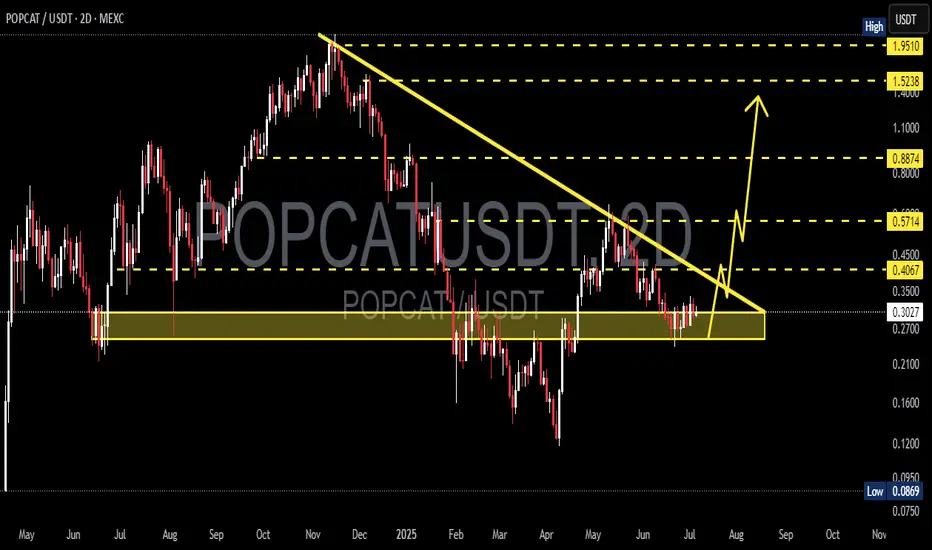
POPCAT/USDT — Major Reversal in Play? Strong Bounce
📌 Quick Summary:
Altcoins are starting to show signs of life, and POPCAT/USDT is now sitting at a critical price structure. After a long and painful downtrend since November 2024, the price is consolidating near a powerful support zone — potentially signaling the start of a reversal phase. Is this the calm before a major breakout? Let’s dive into the technical setup.
🔍 Pattern & Market Structure:
🟨 Descending Triangle Pattern – with Signs of Accumulation:
A clear descending triangle has formed, typically a continuation pattern — but in this context, paired with strong demand at the base, it can signal a reversal.
The horizontal support ($0.27–$0.30) has been tested multiple times, holding firm, which suggests large-scale accumulation by smart money.
A breakout above the descending trendline would invalidate the bearish bias and open the door to a bullish surge.
📐 Descending Trendline (Yellow Line):
This line has been acting as resistance since November 2024.
A clean breakout from this line would serve as a strong bullish signal, likely attracting new buyers and triggering FOMO.
🟩 Bullish Scenario (Reversal Potential):
If the price successfully breaks above the descending trendline and holds above the breakout level, the following targets are in play:
1. 🎯 Target 1: $0.4067 – Minor horizontal resistance
2. 🎯 Target 2: $0.5714 – Previous support turned resistance
3. 🎯 Target 3: $0.8874 – Strong psychological and structural zone
4. 🎯 Target 4: $1.5238 to $1.9510 – Possible macro target if the crypto cycle enters full bullish mode
🧠 Market Psychology Insight: This type of breakout from a long-term downtrend often leads to high-momentum moves, especially if backed by volume. Swing traders and mid-term holders may see this as a golden entry.
🟥 Bearish Scenario (Continuation Risk):
If the price fails to reclaim the descending trendline and breaks below the demand zone:
1. ❌ A breakdown below $0.27 opens room for:
Minor support: $0.20
Long-term low: $0.0869
2. 📉 This would confirm extended bearish control and possibly a deeper retracement phase.
🧭 Strategy Tips for Traders:
✅ Aggressive Approach: Begin accumulating around the $0.27–$0.30 zone with tight stop-losses below $0.26
✅ Conservative Approach: Wait for a confirmed breakout and successful retest before entering toward the next key resistance levels
⚠️ Always combine technical setups with proper risk management and volume confirmation
💬 Final Thoughts:
POPCAT/USDT is at a key decision point. The current support zone shows signs of strength and accumulation by buyers, offering a potential launchpad for a powerful breakout. If the descending triangle breaks to the upside, this could mark the beginning of a trend reversal — with potential gains of 100%+ on the horizon.
The chart is setting up for something big. Are you ready?
#POPCAT #CryptoBreakout #AltcoinReversal #POPCATUSDT #DescendingTriangle #CryptoTrading #ChartAnalysis #BullishSetup #CryptoSignals #BuyTheDip #CryptoTechnicalAnalysis
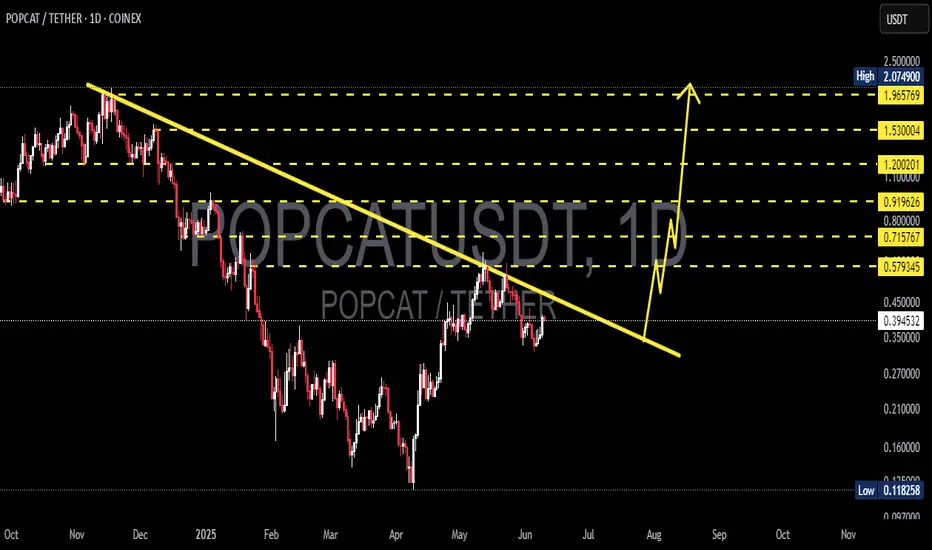
POPCATUSDT 1D AnalysisPOPCAT ~ 1D Analysis
#POPCAT Buy after successfully breaking this resistance line with a short term target of at least 15%+, Long term target $2
POPCAT/USDT Analysis – Trend Reversal
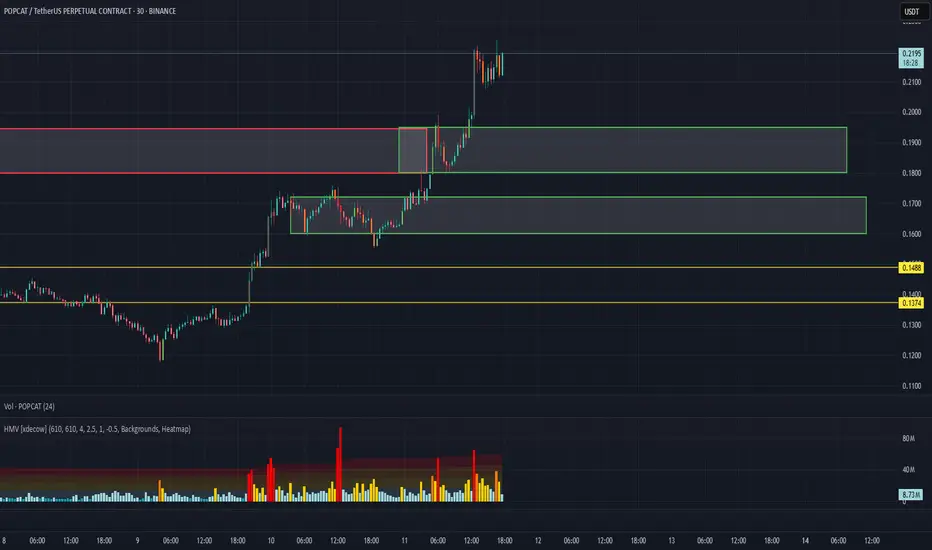
The short-term downtrend on this coin has shifted into a strong bullish trend.
During the rally, we broke through the sell zone at $0.182–$0.195 without any significant reaction, forming a mirrored zone as a result.
At this point, entry opportunities could be considered on a pullback to the $0.195–$0.18 zone , or from the lower support area at $0.173–$0.16 .
#POPCATUSDT Expecting further bullish continuation📈 LONG BYBIT:POPCATUSDT.P from $0.2850
🛡 Stop Loss: $0.2760
⏱ 1H Timeframe
✅ Overview:
➡️ BYBIT:POPCATUSDT.P is showing strong bullish movement, breaking above key resistance at $0.2778, confirming buying interest.
➡️ The $0.2778 - $0.2850 zone now acts as a support, and if the price holds above it, further upside is likely.
➡️ The first major resistance level is at $0.2900, followed by $0.2989 and $0.3100 if the momentum continues.
➡️ Volume remains high, indicating strong liquidity and potential for further growth.
⚡ Plan:
➡️ Enter LONG after confirming a breakout above $0.2850, reinforcing bullish momentum.
➡️ Risk management with Stop-Loss at $0.2760, below key support.
➡️ Key upside targets:
🎯 TP Targets:
💎 TP1: $0.2900 — first take-profit level.
🔥 TP2: $0.2989 — potential resistance.
⚡ TP3: $0.3100 — major upside target.
🚀 BYBIT:POPCATUSDT.P - Expecting further bullish continuation!
━━━━━━━━━━━━━━━━━━━━━━
📢 BYBIT:POPCATUSDT.P is maintaining bullish momentum, and a breakout above $0.2850 could confirm further upside movement.
📢 Watch for price action at $0.2900, as this level might act as short-term resistance.
📢 If the price holds above $0.2989, a strong push towards $0.3100 is possible. However, a drop below $0.2760 would invalidate the bullish setup.

POPCAT - LONG - Good opportunityPOPCAT is now ready to give us a chance. Despite being a little late it is still in a good place for daily timeframe. This is a risky trade because the stop loss is tight; you can use an extended stop (SL 2 or SL 3), i will move it if I see a lot volatility. These currencies are also very volatile and high leverage should not be used.
TP 1: 1.15
TP 2: 1.25
TP 3: 1.55
SL 1: 0.7099 (risky)
SL 2: 0.68 (good)
SL 3: 0.62 (best)
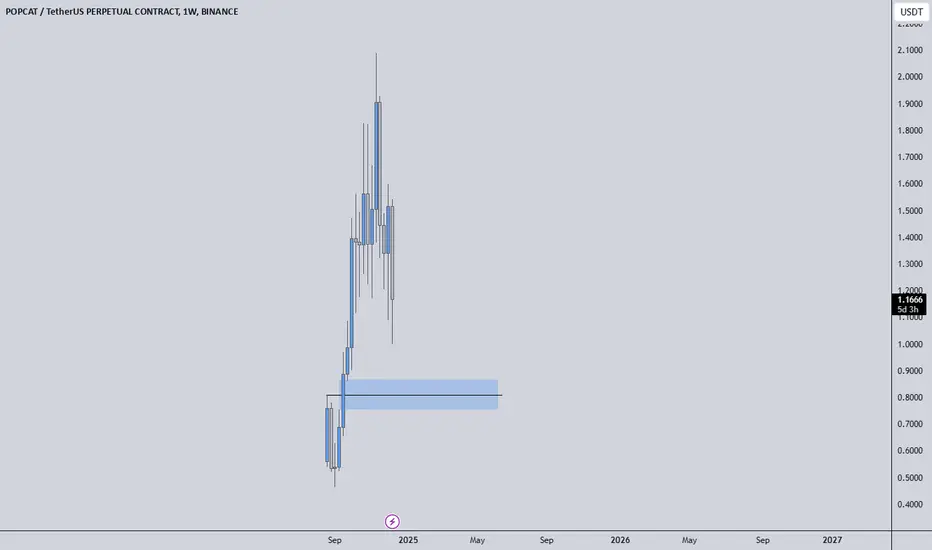
POPCAT TRADE IDEAPOPCATUSDT is currently trending bullish
If price stay good above 0.8731.... we should expect a strong move to 1.0089
always take profits as you go

POPCAT - Bullish Reversal - LONG - (Re-entry)We are at an excellent entry point. Little possibility of it reaching 0.88 in the short term. The stop loss is somewhat tight, so be careful. If you want more security, increase the stop by covering up to that point.
T1: 1.27
T2: 1.40
T3: 1.45
T4: 1.60
Stop loss:
1) 0.98
2) 0.88
*This is a re-entry from my last POPCAT idea

POPCAT - Bullish Reversal - LONGWe are at an excellent entry point. Little possibility of it reaching 0.88 in the short term. The stop loss is somewhat tight, so be careful. If you want more security, increase the stop by covering up to that point.
T1: 1.27
T2: 1.40
T3: 1.45
T4: 1.60
Stop loss:
1) 0.98
2) 0.88
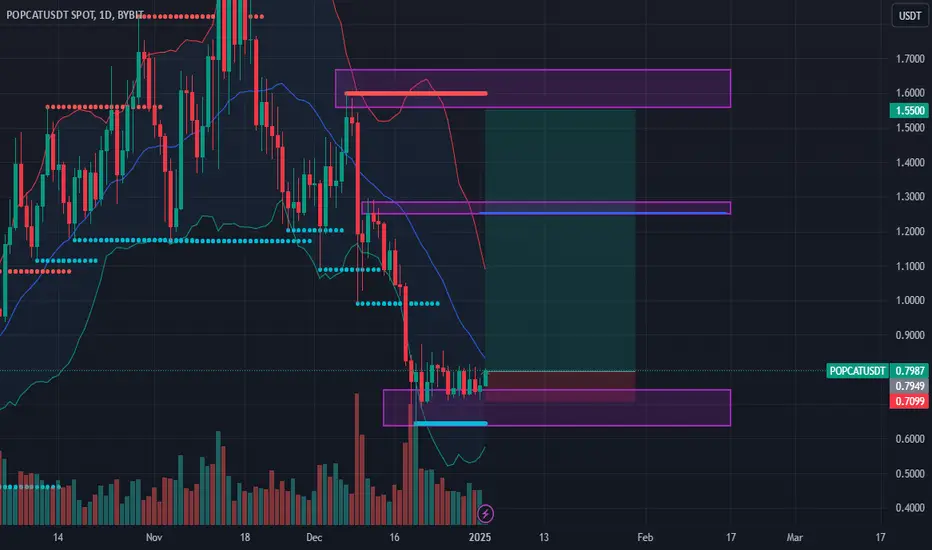
POPCATUSDT Buy Zone IdentifiedThe broader cryptocurrency market faces uncertainty, with a possibility of no recovery by year-end. In light of this, I’ve adjusted my buy positions lower to reflect a more cautious approach.
For POPCATUSDT.P, the blue box highlights a key buy zone where I anticipate strong support. I plan to join as a buyer within this area, looking for a favorable entry point aligned with current market sentiment.
Key Points:
Buy Zone: Blue box region
Risk Management: Stop loss placed below the box
Potential Target: Await confirmation of a bounce for upside momentum
Remaining patient and disciplined will be crucial in navigating the current market conditions.
Disclaimer: This is not financial advice.
I keep my charts clean and simple because I believe clarity leads to better decisions.
My approach is built on years of experience and a solid track record. I don’t claim to know it all, but I’m confident in my ability to spot high-probability setups.
My Previous Analysis
🐶 DOGEUSDT.P: Next Move
🎨 RENDERUSDT.P: Opportunity of the Month
💎 ETHUSDT.P: Where to Retrace
🟢 BNBUSDT.P: Potential Surge
📊 BTC Dominance: Reaction Zone
🌊 WAVESUSDT.P: Demand Zone Potential
🟣 UNIUSDT.P: Long-Term Trade
🔵 XRPUSDT.P: Entry Zones
🔗 LINKUSDT.P: Follow The River
📈 BTCUSDT.P: Two Key Demand Zones
🟩 POLUSDT: Bullish Momentum
🌟 PENDLEUSDT: Where Opportunity Meets Precision
🔥 BTCUSDT.P: Liquidation of Highly Leveraged Longs
🌊 SOLUSDT.P: SOL's Dip - Your Opportunity
🐸 1000PEPEUSDT.P: Prime Bounce Zone Unlocked
🚀 ETHUSDT.P: Set to Explode - Don't Miss This Game Changer
🤖 IQUSDT: Smart Plan
⚡️ PONDUSDT: A Trade Not Taken Is Better Than a Losing One
💼 STMXUSDT: 2 Buying Areas
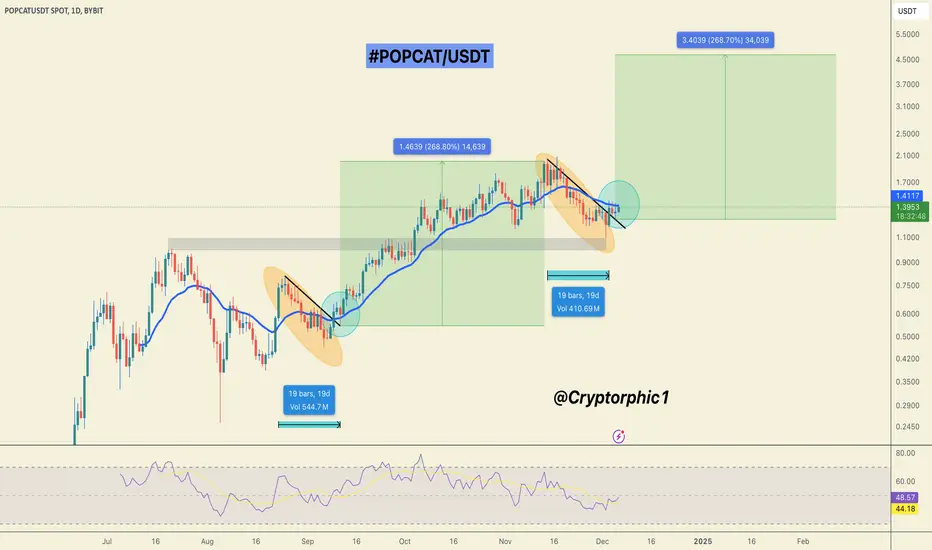
#POPCAT can pomp 268% Here's why!POPCAT has broken out of its structure after 19 days of accumulation.
Indicators and oscillators are signalling a potential 268% pump to $4.50. Is this achievable? Given the current market momentum, with BTC holding steady and BTC dominance dropping sharply, this target is well within reach.
Coins like ATH, GOAT, FWOG, NEAR, and SLF are also set to pump hard, and POPCAT will likely move in tandem. Patience is the key here.
DYOR | NFA
If you like this chart, don’t forget to hit the like button and share your thoughts in the comments below.
Thank you!
#Peace 🚀
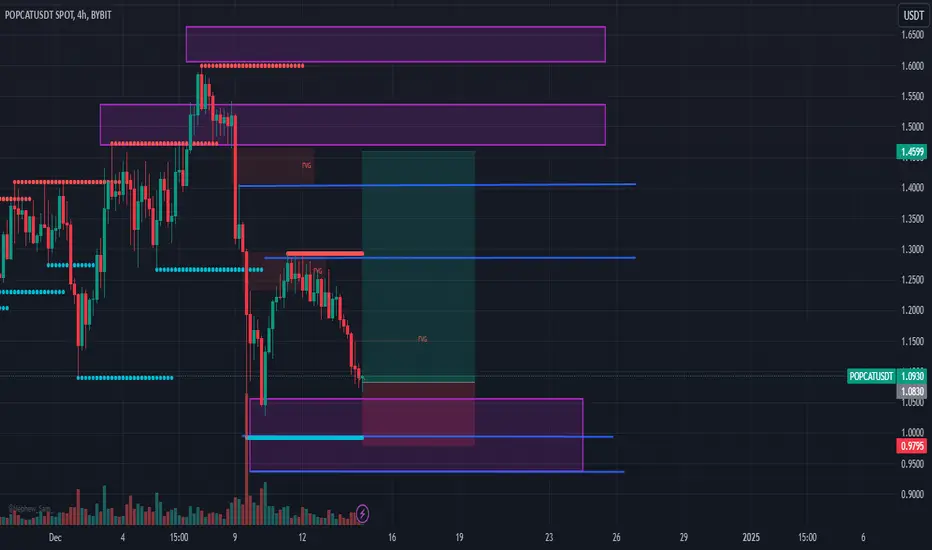
POPCAT COIN LONG OPPORTUNITY - Solana MemecoinPOPCAT is one of the most popular Solana memecoins, currently listed on Binance and generating a lot of hype. I’m keeping a close watch and trading this one to catch the memecoin trend.
Technical Analysis: Price recently hit the daily demand, ran daily liquidity, and failed to close below, indicating a potential move higher. Following the liquidity run, we saw a strong increase in volume, which created a 4-hour demand zone. Price has since rejected off the bearish trendline and is now moving into the 4H demand and maximum discount area, where I’ll be looking for long entries.
Lower time frame confirmations will be necessary before initiating the trade.
Stop loss: 1.15
TP1: Trendline
TP2: Equal Highs - 1.66
TP3: ATH - 1.82

POPCATUSD Wait for a pull-back and buy.POPCATUSD has been trading within a Rising Wedge pattern and is currently on a new Bullish Leg (green). With the Internal Higher Highs trend-line just above, we expect a short-term pull-back towards the 1D MA50 (blue trend-line), which will present a buy opportunity at the bottom of the pattern. Our Target is 1.2500 short-term.
-------------------------------------------------------------------------------
** Please LIKE 👍, FOLLOW ✅, SHARE 🙌 and COMMENT ✍ if you enjoy this idea! Also share your ideas and charts in the comments section below! This is best way to keep it relevant, support us, keep the content here free and allow the idea to reach as many people as possible. **
-------------------------------------------------------------------------------
💸💸💸💸💸💸
👇 👇 👇 👇 👇 👇
