POPCATUSDT – Breakout Confirmation or False Signal?On the daily chart of POPCATUSDT, the price has recently broken out of a descending trendline that has been acting as resistance since December 2024. This breakout signals a potential trend reversal from bearish to bullish.
Currently, the price is in a retest phase, revisiting the breakout zone, which also aligns with a strong support and Fibonacci retracement area:
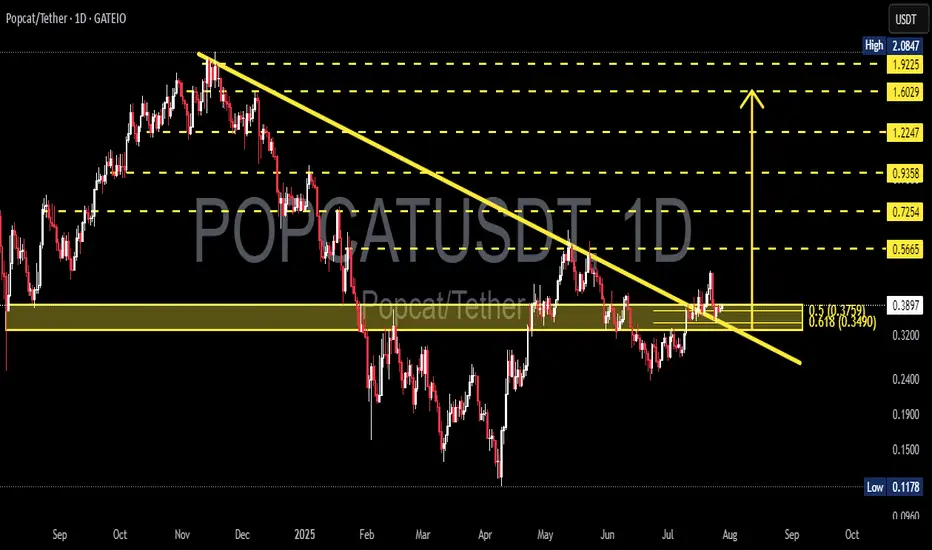
Support zone: $0.34 – $0.38
Fibonacci 0.618: $0.3490 (major technical support)
Fibonacci 0.5: $0.3759 (typical retest level after breakout)
If the price holds above this zone and forms a bullish confirmation candle, it strengthens the case for continued upward momentum.
---
Pattern and Market Structure:
Descending Triangle Breakout: The price has broken out of a long-standing descending triangle pattern, which is typically a bullish reversal signal — especially if supported by volume (not shown in chart but crucial).
Neckline Retest: The current move is retesting the breakout zone, a common behavior after significant breakouts.
---
Bullish Scenario:
If the price holds above the $0.34–$0.38 zone and forms bullish price action:
Potential targets based on Fibonacci levels:
Target 1: $0.5665
Target 2: $0.7254
Target 3: $0.9358
Major targets: $1.2247 and possibly $1.6029 if bullish momentum sustains
---
Bearish Scenario:
If the price fails to hold above $0.34 and breaks down below the support:
Potential downside towards $0.26 – $0.20 zone
If selling pressure intensifies, it may revisit the key support low around $0.1178
---
Conclusion:
POPCATUSDT is at a critical decision point. The breakout from the descending trendline is an early bullish signal, but confirmation from the $0.34–$0.38 retest zone is essential. If it holds, a strong bullish rally may follow. However, a failure to hold could signal a false breakout and resume the bearish trend.
#POPCAT #POPCATUSDT #CryptoBreakout #AltcoinAnalysis #ChartPatterns #TechnicalAnalysis #FibonacciLevels #CryptoTrading #BullishSetup #BearishScenario