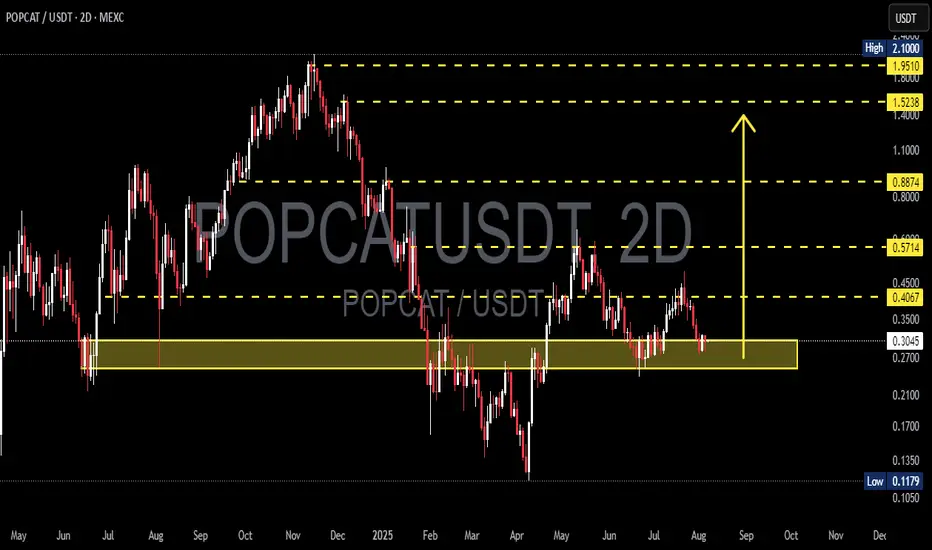
POPCAT/USDT – Testing Demand Zone: Reversal or Breakdown?POPCAT/USDT is currently retesting one of the most crucial demand zones in its mid-term price structure, located between $0.2700 – $0.3037. This area has historically acted as a strong support level and has triggered significant rebounds in the past. The market's reaction here will be key in determining whether POPCAT is ready for a bullish reversal or heading for a deeper correction.
---
🔍 Market Structure & Price Action
The price has entered a sideways consolidation phase after a steady decline from the $0.4067 region.
So far, the support zone at $0.2700 has been respected multiple times, indicating buying interest remains active.
However, no clear bullish reversal pattern has formed yet, making the next movement critical.
---
🟢 Bullish Scenario (Reversal / Bounce)
If the price manages to hold above this demand zone and forms a higher low along with a strong bullish candlestick confirmation, we could see a potential trend reversal.
🎯 Potential bullish targets:
TP1: $0.4067 – Minor resistance, top of the current range.
TP2: $0.5714 – Mid-range resistance, a previous breakdown zone.
TP3: $0.8874 – Major resistance, the last high before the steep drop.
TP4: $1.5238 – $1.9510 – Psychological resistance zone, possible medium-term swing targets if bullish momentum strengthens.
🔐 Key confirmations:
Bullish engulfing / hammer candlestick on the 2D chart.
Increase in volume + breakout above range resistance.
---
🔴 Bearish Scenario (Breakdown Continuation)
If the price fails to hold $0.2700 and we see a clear daily or 2D candle close below the demand zone, this would indicate loss of bullish strength and open room for further downside.
🎯 Bearish targets:
TP1: $0.2100 – Psychological support level.
TP2: $0.1179 – All-time low and historical bottom.
⚠️ Risk factors:
Strong bearish candle close + high volume breakdown would confirm sellers’ dominance.
---
🧩 Pattern & Formation Insights
A horizontal base / accumulation range is visible within the demand zone.
If the price rebounds, we could be forming a double bottom – a classic reversal signal.
However, if the zone breaks, the chart may develop into a descending channel or bearish continuation pattern.
---
🧠 Trading Strategy Outlook
Swing Traders: Consider long entries within the demand zone ($0.2700–$0.3037) with a tight stop-loss just below the zone. Aim for multiple resistance levels as take-profit targets.
Breakout Traders: Wait for confirmation above $0.4067 with increased volume.
Bearish Setup: Short entry upon breakdown below $0.2700 with targets towards the next support zones.
#POPCAT #AltcoinAnalysis #CryptoTechnicalAnalysis #DemandZone #BreakoutOrBreakdown #USDT #MEXC #SwingTrade #CryptoSetup #BullishReversal #BearishBreakdown #ChartAnalysis #TradingView
Popcatusdtsignal
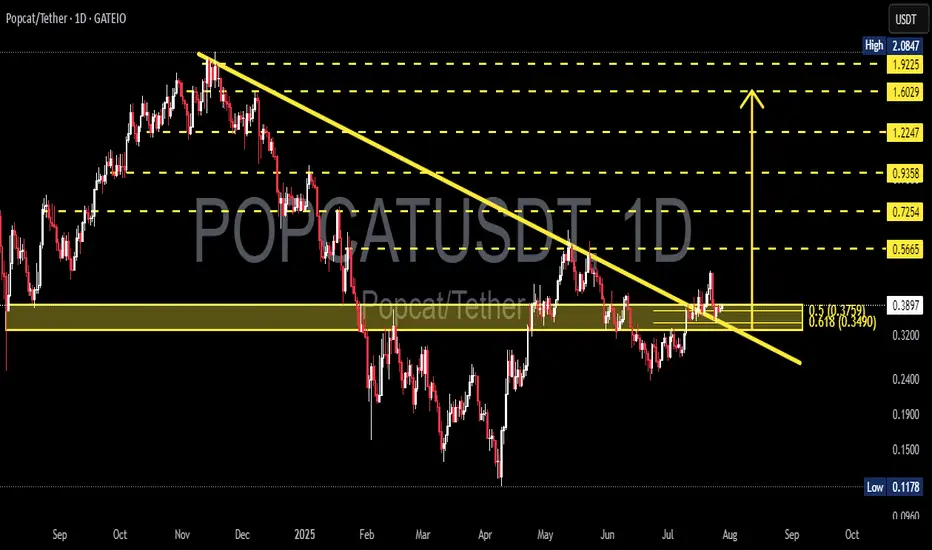
POPCATUSDT – Breakout Confirmation or False Signal?On the daily chart of POPCATUSDT, the price has recently broken out of a descending trendline that has been acting as resistance since December 2024. This breakout signals a potential trend reversal from bearish to bullish.
Currently, the price is in a retest phase, revisiting the breakout zone, which also aligns with a strong support and Fibonacci retracement area:
Support zone: $0.34 – $0.38
Fibonacci 0.618: $0.3490 (major technical support)
Fibonacci 0.5: $0.3759 (typical retest level after breakout)
If the price holds above this zone and forms a bullish confirmation candle, it strengthens the case for continued upward momentum.
---
Pattern and Market Structure:
Descending Triangle Breakout: The price has broken out of a long-standing descending triangle pattern, which is typically a bullish reversal signal — especially if supported by volume (not shown in chart but crucial).
Neckline Retest: The current move is retesting the breakout zone, a common behavior after significant breakouts.
---
Bullish Scenario:
If the price holds above the $0.34–$0.38 zone and forms bullish price action:
Potential targets based on Fibonacci levels:
Target 1: $0.5665
Target 2: $0.7254
Target 3: $0.9358
Major targets: $1.2247 and possibly $1.6029 if bullish momentum sustains
---
Bearish Scenario:
If the price fails to hold above $0.34 and breaks down below the support:
Potential downside towards $0.26 – $0.20 zone
If selling pressure intensifies, it may revisit the key support low around $0.1178
---
Conclusion:
POPCATUSDT is at a critical decision point. The breakout from the descending trendline is an early bullish signal, but confirmation from the $0.34–$0.38 retest zone is essential. If it holds, a strong bullish rally may follow. However, a failure to hold could signal a false breakout and resume the bearish trend.
#POPCAT #POPCATUSDT #CryptoBreakout #AltcoinAnalysis #ChartPatterns #TechnicalAnalysis #FibonacciLevels #CryptoTrading #BullishSetup #BearishScenario
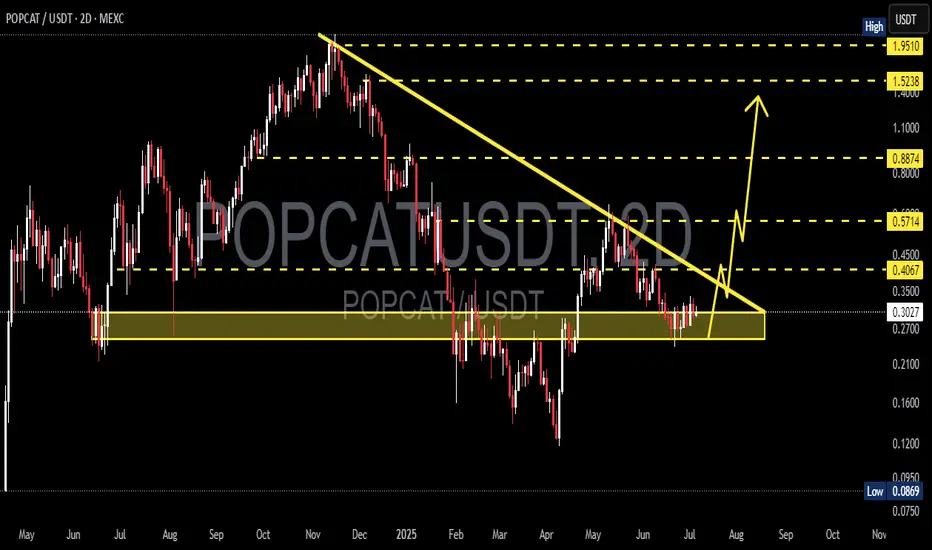
POPCAT/USDT — Major Reversal in Play? Strong Bounce
📌 Quick Summary:
Altcoins are starting to show signs of life, and POPCAT/USDT is now sitting at a critical price structure. After a long and painful downtrend since November 2024, the price is consolidating near a powerful support zone — potentially signaling the start of a reversal phase. Is this the calm before a major breakout? Let’s dive into the technical setup.
🔍 Pattern & Market Structure:
🟨 Descending Triangle Pattern – with Signs of Accumulation:
A clear descending triangle has formed, typically a continuation pattern — but in this context, paired with strong demand at the base, it can signal a reversal.
The horizontal support ($0.27–$0.30) has been tested multiple times, holding firm, which suggests large-scale accumulation by smart money.
A breakout above the descending trendline would invalidate the bearish bias and open the door to a bullish surge.
📐 Descending Trendline (Yellow Line):
This line has been acting as resistance since November 2024.
A clean breakout from this line would serve as a strong bullish signal, likely attracting new buyers and triggering FOMO.
🟩 Bullish Scenario (Reversal Potential):
If the price successfully breaks above the descending trendline and holds above the breakout level, the following targets are in play:
1. 🎯 Target 1: $0.4067 – Minor horizontal resistance
2. 🎯 Target 2: $0.5714 – Previous support turned resistance
3. 🎯 Target 3: $0.8874 – Strong psychological and structural zone
4. 🎯 Target 4: $1.5238 to $1.9510 – Possible macro target if the crypto cycle enters full bullish mode
🧠 Market Psychology Insight: This type of breakout from a long-term downtrend often leads to high-momentum moves, especially if backed by volume. Swing traders and mid-term holders may see this as a golden entry.
🟥 Bearish Scenario (Continuation Risk):
If the price fails to reclaim the descending trendline and breaks below the demand zone:
1. ❌ A breakdown below $0.27 opens room for:
Minor support: $0.20
Long-term low: $0.0869
2. 📉 This would confirm extended bearish control and possibly a deeper retracement phase.
🧭 Strategy Tips for Traders:
✅ Aggressive Approach: Begin accumulating around the $0.27–$0.30 zone with tight stop-losses below $0.26
✅ Conservative Approach: Wait for a confirmed breakout and successful retest before entering toward the next key resistance levels
⚠️ Always combine technical setups with proper risk management and volume confirmation
💬 Final Thoughts:
POPCAT/USDT is at a key decision point. The current support zone shows signs of strength and accumulation by buyers, offering a potential launchpad for a powerful breakout. If the descending triangle breaks to the upside, this could mark the beginning of a trend reversal — with potential gains of 100%+ on the horizon.
The chart is setting up for something big. Are you ready?
#POPCAT #CryptoBreakout #AltcoinReversal #POPCATUSDT #DescendingTriangle #CryptoTrading #ChartAnalysis #BullishSetup #CryptoSignals #BuyTheDip #CryptoTechnicalAnalysis
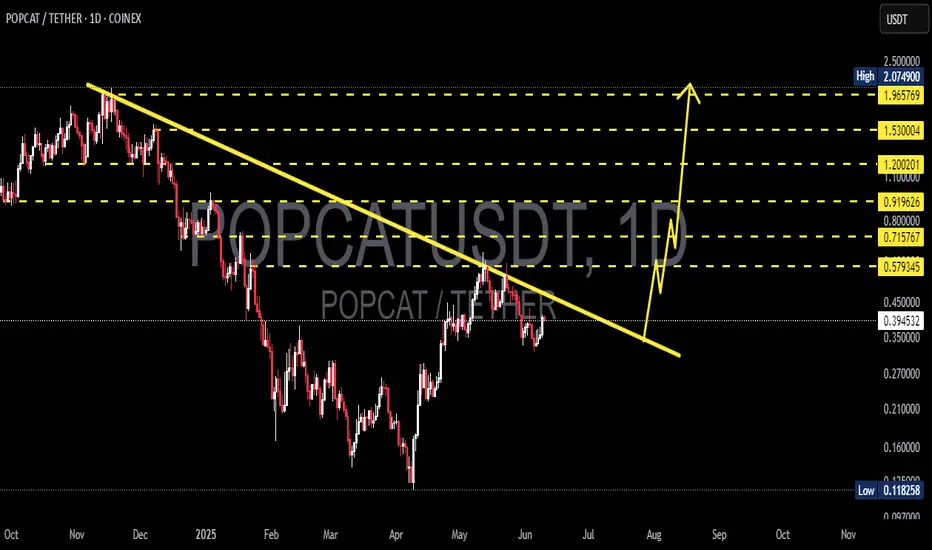
POPCATUSDT 1D AnalysisPOPCAT ~ 1D Analysis
#POPCAT Buy after successfully breaking this resistance line with a short term target of at least 15%+, Long term target $2
POPPOPOPOPCAT - Extended Cut!Okay so popcat's extend cut is here, please follow obvious old charts to understand what i said and what is going to happen on this!
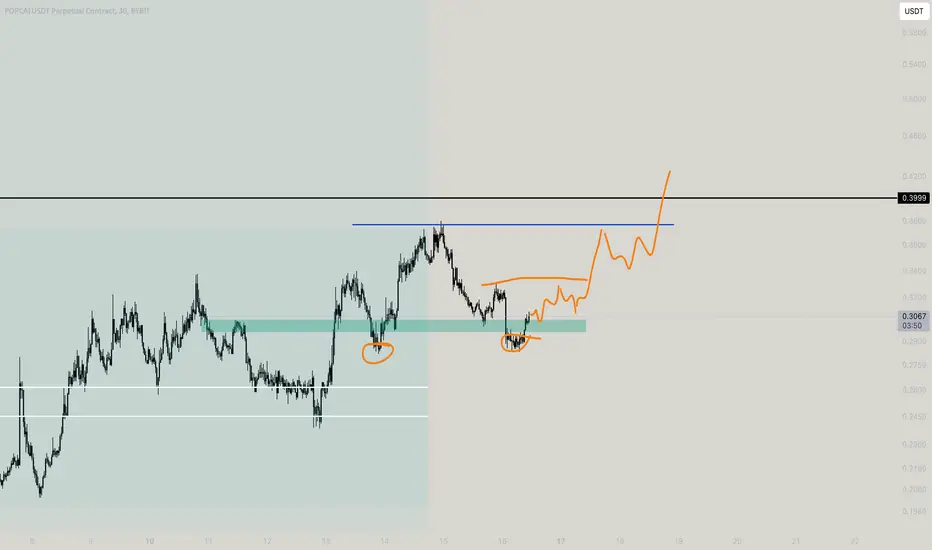
#POPCATUSDT Expecting further bullish continuation📈 LONG BYBIT:POPCATUSDT.P from $0.2850
🛡 Stop Loss: $0.2760
⏱ 1H Timeframe
✅ Overview:
➡️ BYBIT:POPCATUSDT.P is showing strong bullish movement, breaking above key resistance at $0.2778, confirming buying interest.
➡️ The $0.2778 - $0.2850 zone now acts as a support, and if the price holds above it, further upside is likely.
➡️ The first major resistance level is at $0.2900, followed by $0.2989 and $0.3100 if the momentum continues.
➡️ Volume remains high, indicating strong liquidity and potential for further growth.
⚡ Plan:
➡️ Enter LONG after confirming a breakout above $0.2850, reinforcing bullish momentum.
➡️ Risk management with Stop-Loss at $0.2760, below key support.
➡️ Key upside targets:
🎯 TP Targets:
💎 TP1: $0.2900 — first take-profit level.
🔥 TP2: $0.2989 — potential resistance.
⚡ TP3: $0.3100 — major upside target.
🚀 BYBIT:POPCATUSDT.P - Expecting further bullish continuation!
━━━━━━━━━━━━━━━━━━━━━━
📢 BYBIT:POPCATUSDT.P is maintaining bullish momentum, and a breakout above $0.2850 could confirm further upside movement.
📢 Watch for price action at $0.2900, as this level might act as short-term resistance.
📢 If the price holds above $0.2989, a strong push towards $0.3100 is possible. However, a drop below $0.2760 would invalidate the bullish setup.
