Warren Buffett's Approach to Long-Term Wealth BuildingUnderstanding Value Investing: Warren Buffett's Educational Approach to Long-Term Wealth Building
Learn the educational principles behind value investing and dollar-cost averaging strategies, based on historical market data and Warren Buffett's documented investment philosophy.
---
Introduction: The Million-Dollar Question Every Investor Asks
Warren Buffett—the Oracle of Omaha—has consistently advocated that index fund investing provides a simple, educational approach to long-term wealth building for most investors.
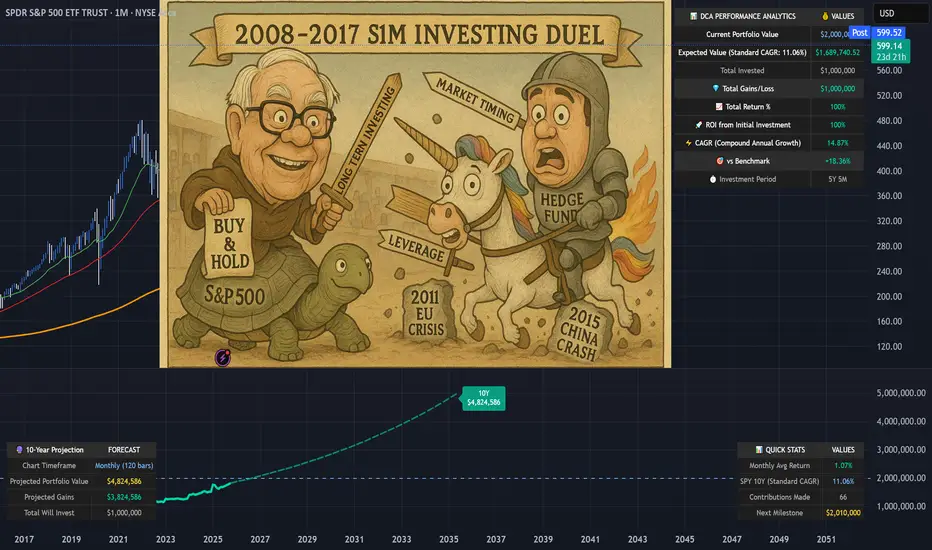
His famous 2007 bet against hedge funds proved this principle in dramatic fashion: Buffett wagered $1 million that a basic S&P 500 index fund would outperform a collection of hedge funds over 10 years. He crushed them. The S&P 500 returned 7.1% annually while the hedge funds averaged just 2.2%.
Today, we'll explore the educational principles behind this approach—examining historical data, mathematical concepts, and implementation strategies for learning purposes.
---
Part 1: Understanding Value Investing for Modern Markets
Value investing isn't about finding the next GameStop or Tesla. It's about buying quality assets at attractive prices and holding them for compound growth .
For beginners, this translates to:
Broad Market Exposure: Own a cross-section of businesses through low-cost index funds
Long-term Perspective: Think decades, not months
Disciplined Approach: Systematic investing regardless of market noise
"Time is the friend of the wonderful business, the enemy of the mediocre." - Warren Buffett
Real-World Application:
Instead of trying to pick between NASDAQ:AAPL , NASDAQ:MSFT , or NASDAQ:GOOGL , you simply buy AMEX:SPY (SPDR S&P 500 ETF) and own pieces of all 500 companies automatically.
---
Part 2: Dollar-Cost Averaging - Your Secret Weapon Against Market Timing
The Problem: Everyone tries to time the market. Studies show that even professional investors get this wrong 70% of the time.
The Solution: Dollar-Cost Averaging (DCA) eliminates timing risk entirely.
How DCA Works:
Decide on your total investment amount (e.g., $24,000)
Split it into equal parts (e.g., 12 months = $2,000/month)
Invest the same amount on the same day each month
Ignore market fluctuations completely
DCA in Action - Real Example:
Let's say you started DCA into AMEX:SPY in January 2022 (right before the bear market):
January 2022: AMEX:SPY at $450 → You buy $1,000 worth (2.22 shares)
June 2022: AMEX:SPY at $380 → You buy $1,000 worth (2.63 shares)
December 2022: AMEX:SPY at $385 → You buy $1,000 worth (2.60 shares)
Result: Your average cost per share was $405, significantly better than the $450 you would have paid with a lump sum in January.
---
Part 3: The Mathematics of Wealth Creation
Here's where value investing gets exciting. Let's run the actual numbers using historical S&P 500 returns:
Historical Performance:
- Average Annual Return: 10.3% (1957-2023)
- Inflation-Adjusted: ~6-7% real returns
- Conservative Estimate: 8% for planning purposes
Scenario 1: The $24K Start
Initial Investment: $24,000 | Annual Addition: $2,400 | Return: 8%
Calculation Summary:
- Initial Investment: $24,000
- Annual Contribution: $2,400 ($200/month)
- Expected Return: 8%
- Time Period: 20 years
Results:
- Year 10 Balance: $86,581
- Year 20 Balance: $221,692
- Total Contributed: $72,000
- Investment Gains: $149,692
Scenario 2: The Aggressive Investor
Initial Investment: $60,000 | Annual Addition: $6,000 | Return: 10%
Historical example after 20 years: $747,300
- Total Contributed: $180,000
- Calculated Investment Gains: $567,300
Educational Insight on Compound Returns:
This historical example illustrates how 2% higher returns (10% vs 8%) could dramatically impact long-term outcomes. This is why even small differences in return rates can create life-changing wealth over decades. The mathematics of compound growth are both simple and incredibly powerful.
---
Part 4: Investing vs. Savings - The Shocking Truth
Let's compare the same contributions invested in stocks vs. a high-yield savings account:
20-Year Comparison:
- Stock Investment (8% return): $221,692
- High-Yield Savings (5% return): $143,037
- Difference: $78,655 (55% more wealth!)
"Compound interest is the eighth wonder of the world. He who understands it, earns it... he who doesn't, pays it." - Often attributed to Einstein
Key Insight: That extra 3% annual return created an additional $78,655 over 20 years. Over 30-40 years, this difference becomes truly life-changing.
📍 Global Savings Reality - The Investment Advantage Worldwide:
The power of index fund investing becomes even more dramatic when we examine savings rates around the world. Here's how the same $24K initial + $2,400 annual investment compares globally:
🇯🇵 Japan (0.5% savings):
- Stock Investment: $221,692
- Savings Account: $76,868
- Advantage: $144,824 (188% more wealth)
🇪🇺 Western Europe Average (3% savings):
- Stock Investment: $221,692
- Savings Account: $107,834
- Advantage: $113,858 (106% more wealth)
🇬🇷 Greece/Southern Europe (2% savings):
- Stock Investment: $221,692
- Savings Account: $93,975
- Advantage: $127,717 (136% more wealth)
🇰🇷 South Korea (2.5% savings):
- Stock Investment: $221,692
- Savings Account: $100,634
- Advantage: $121,058 (120% more wealth)
💡 The Global Lesson:
The lower your country's savings rates, the MORE dramatic the advantage of global index fund investing becomes. For investors in countries with minimal savings returns, staying in cash is essentially guaranteed wealth destruction when compared to broad market investing.
This is exactly why Warren Buffett's advice transcends borders - mathematical principles of compound growth work the same whether you're in New York, London, or Athens.
Note: Savings rates shown are approximate regional averages and may vary by institution and current market conditions. Always check current rates in your specific market for precise calculations.
---
Part 5: Building Your Value Investing Portfolio
Core Holdings (80% of portfolio):
AMEX:SPY - S&P 500 ETF (Large-cap US stocks)
AMEX:VTI - Total Stock Market ETF (Broader US exposure)
LSE:VUAA - S&P 500 UCITS Accumulating (Tax-efficient for international investors)
Satellite Holdings (20% of portfolio):
NASDAQ:QQQ - Technology-focused (Higher growth potential)
AMEX:VYM - Dividend-focused (Income generation)
NYSE:BRK.B - Berkshire Hathaway (Value investing & diversification)
---
Part 6: Implementation Strategy - Your Action Plan
Month 1: Foundation
Open a brokerage account (research low-cost brokers available in your region)
Set up automatic transfers from your bank
Buy your first AMEX:SPY shares
💡 Broker Selection Considerations:
Traditional Brokers: Interactive Brokers, Fidelity, Vanguard, Schwab
Digital Platforms: Revolut, Trading 212, eToro (check availability in your country)
Key Factors: Low fees, ETF access, automatic investing features, regulatory protection
Research: Compare costs and features for your specific location/needs
Month 2-12: Execution
Invest the same amount on the same day each month
Ignore market news and volatility
Track your progress in a simple spreadsheet
Year 2+: Optimization
Increase contributions with salary increases
Consider additional core holdings like LSE:VUAA for tax efficiency
Consider tax-loss harvesting opportunities
Visualizing Your DCA Strategy
Understanding DCA concepts is easier when you can visualize the results. TradingView offers various tools to help you understand investment strategies, including DCA tracking indicators like the DCA Investment Tracker Pro which help visualize long-term investment concepts.
🎯 Key Visualization Features:
These types of tools typically help visualize:
Historical Analysis: How your strategy would have performed using real market data
Growth Projections: Educational scenarios showing potential long-term outcomes
Performance Comparison: Comparing actual vs theoretical DCA performance
Volatility Understanding: How different stocks behave with DCA over time
📊 Real-World Examples from Live Users:
Stable Index Investing Success:
AMEX:SPY (S&P 500) Example: $60K initial + $500/month starting 2020. The indicator shows SPY's historical 10%+ returns, demonstrating how consistent broad market investing builds wealth over time. Notice the smooth theoretical growth line vs actual performance tracking.
Value Investing Approach:
NYSE:BRK.B (Berkshire Hathaway): Warren Buffett's legendary performance through DCA lens. The indicator demonstrates how quality value companies compound wealth over decades. Lower volatility = standard CAGR calculations used.
High-Volatility Stock Management:
NASDAQ:NVDA (NVIDIA): Shows smart volatility detection in action. NVIDIA's explosive AI boom creates extreme years that trigger automatic switch to "Median (High Vol): 50%" calculations for conservative projections, protecting against unrealistic future estimates.
Tech Stock Long-Term Analysis:
NASDAQ:META (Meta Platforms): Despite being a tech stock and experiencing the 2022 crash, META's 10-year history shows consistent enough performance (23.98% CAGR) that volatility detection doesn't trigger. Standard CAGR calculations demonstrate stable long-term growth.
⚡ Educational Application:
When using visualization tools on TradingView:
Select Your Asset: Choose the stock/ETF you want to analyze (like AMEX:SPY )
Input Parameters: Enter your investment amounts and time periods
Study Historical Data: See how your strategy would have performed in real markets
Understand Projections: Learn from educational growth scenarios
🎓 Educational Benefits:
This tool helps you understand:
- How compound growth actually works in real markets
- The difference between volatile and stable investment returns
- Why consistent DCA often outperforms timing strategies
- How your current performance compares to historical market patterns
- The visual power of long-term wealth building
As Warren Buffett said: "Someone's sitting in the shade today because someone planted a tree a long time ago." This tool helps you visualize your financial tree growing over time through actual market data and educational projections.
---
Part 7: Common Mistakes to Avoid
The "Perfect Timing" Trap
Waiting for the "perfect" entry point often means missing years of compound growth. Time in the market beats timing the market.
The "Hot Stock" Temptation
Chasing individual stocks like NASDAQ:NVDA or NASDAQ:TSLA might seem exciting, but it introduces unnecessary risk for beginners.
The "Market Crash" Panic
Every bear market feels like "this time is different." Historical data shows that patient investors who continued their DCA through 2008, 2020, and other crashes were handsomely rewarded.
---
Conclusion: Your Path to Financial Freedom
Value investing through broad index funds and dollar-cost averaging isn't glamorous. You won't get rich overnight, and you won't have exciting stories about your latest trade.
But here's what you will have:
Proven strategy backed by decades of data
Peace of mind during market volatility
Compound growth working in your favor 24/7
A realistic path to serious wealth creation
The Bottom Line: Warren Buffett's approach works because it's simple, sustainable, and based on fundamental economic principles. Start today, stay consistent, and let compound growth do the heavy lifting.
"Someone's sitting in the shade today because someone planted a tree a long time ago." - Warren Buffett
Educational Summary:
Understanding these principles provides a foundation for informed decision-making. As Warren Buffett noted: "The best time to plant a tree was 20 years ago. The second-best time is now" - emphasizing the educational value of understanding long-term investment principles early.
---
🙏 Personal Note & Acknowledgment
This article was not entirely my own work, but the result of artificial intelligence in-depth research and information gathering. I fine-tuned and brought it to my own vision and ideas. While working with AI, I found this research so valuable for myself that I could not avoid sharing it with all of you.
I hope this perspective gives you a different approach to long-term investing. It completely changed my style of thinking and my approach to the markets. As a father of 3 kids, I'm always seeking the best investment strategies for our future. While I was aware of the power of compound interest, I could never truly visualize its actual power.
That's exactly why I also created the open-source DCA Investment Tracker Pro indicator - so everyone can see and visualize the benefits of choosing a long, steady investment approach. Being able to see compound growth in action makes all the difference in staying committed to a strategy.
As someone truly said: compound interest is the 8th wonder of the world.
---
Disclaimer: This article is for educational purposes only and does not constitute financial advice. Past performance does not guarantee future results. Always consult with a qualified financial advisor before making investment decisions.
Portofolio
Capital Distribution by Time and Portfolio - CryptoHey traders,
In this post, I'll be sharing a simple capital distribution strategy that I use for my crypto portfolio. This strategy is designed to help you allocate your capital across different timeframes and asset types in order to maximize your potential returns while minimizing your risk.
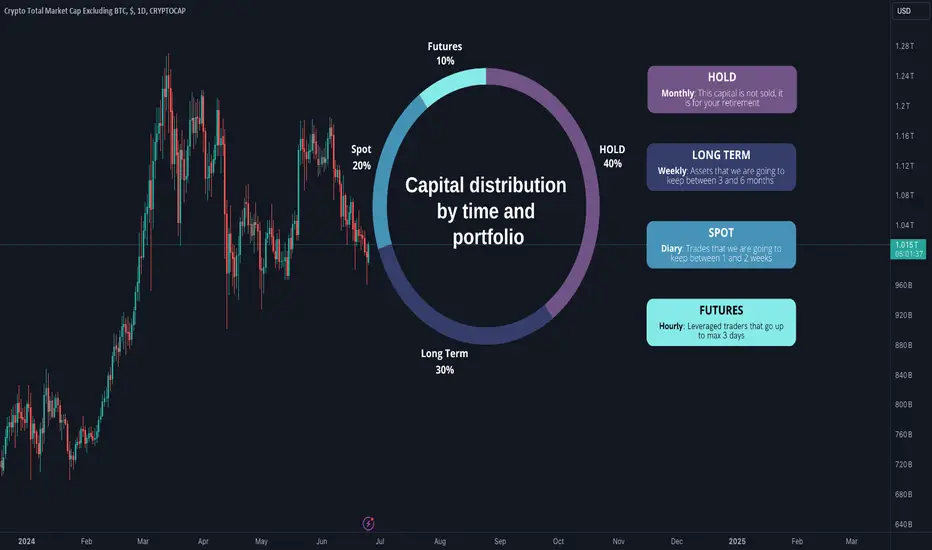
Capital Distribution Strategy
Here's how I break down my capital:
40% - HOLD (Monthly chart): This capital is allocated to long-term investments that I believe have the potential to appreciate significantly over time ( BITSTAMP:BTCUSD mostly). I typically enter these positions based on a combination of fundamental and technical analysis.
30% - Long Term (Weekly chart): This capital is allocated to assets that I plan to hold for a period of 3 to 6 months. I typically enter these positions based on technical analysis and market sentiment.
20% - Spot (Daily chart): This capital is allocated to short-term trades that I plan to hold for 1 to 2 weeks. I typically enter these positions based on technical analysis and market momentum.
10% - Futures (1-4 hourly chart): This capital is allocated to leveraged trades that I plan to keep for up to 3 days. I use futures trading to amplify my potential returns, but I also recognize that it comes with increased risk. I typically enter these positions based on technical analysis and market volatility.
Choosing Entry Points
As you can see, the entry points for my different capital allocations vary depending on the timeframe and asset type. This is because the risk tolerance and potential rewards associated with each type of trading are different.
HOLD and Long Term : For these long-term investments, I take a more conservative approach and focus on fundamental analysis to identify projects with strong potential. I also use technical analysis to confirm my entry points and manage my risk.
Spot and Futures : For short-term trades, I rely more heavily on technical analysis to identify trading opportunities. I use a variety of indicators and chart patterns to spot potential entry and exit points.
Benefits of this Strategy
This capital distribution strategy has several benefits:
Diversification: It helps to diversify your portfolio across different timeframes and asset types, which can help to reduce your overall risk.
Flexibility: It allows you to adjust your capital allocation based on your market outlook and risk tolerance.
Potential for Growth: It has the potential to generate significant returns over time, as you can benefit from both long-term and short-term trading opportunities.
Disclaimer
Please remember that this is just a general strategy, and it may not be suitable for everyone. It's important to do your own research and understand the risks involved before making any trading decisions.
Additional Tips for New Traders
Start small: Don't risk more money than you can afford to lose.
Learn the basics: Take the time to learn about technical analysis and fundamental analysis.
Practice on a demo account: Before you start trading with real money, practice on a demo account to get a feel for the market.
Manage your risk: Use stop-loss orders and other risk management techniques to protect your capital.
Be patient: Trading is a marathon, not a sprint. Don't get discouraged if you don't see results immediately.
I hope this post has been helpful. If you have any questions, please feel free to leave a comment below.
Happy trading!