Position
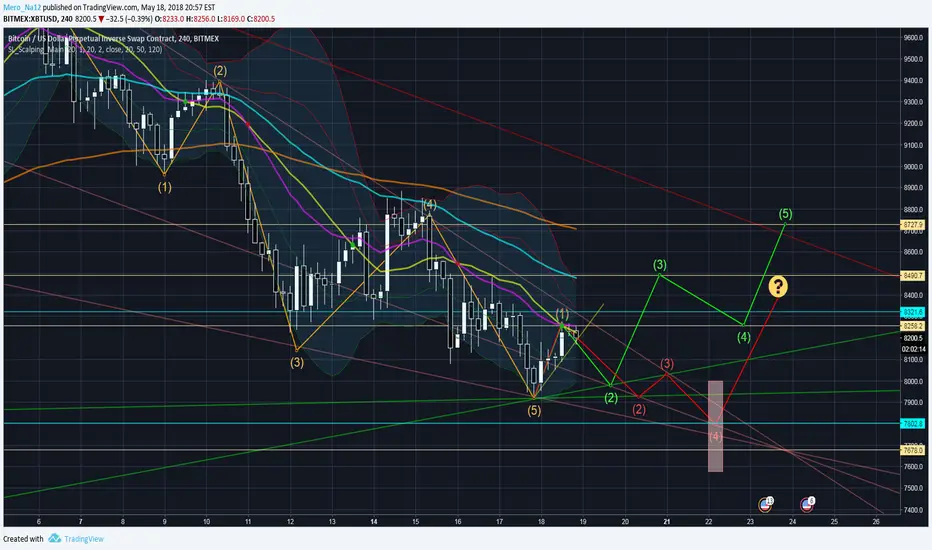
[May 18th/BITMEX] Bitcoin Trend Analysis $7683 - $8270/8500/8700Hello, guys.
Sorry to postpone to upload it.
In the morning, I wrote down it but I accidentally close the chrome.
I was just mad XD. That is why I upload it now.
1. As you can see, the chart shows that it is still bearish .
Today, I assume that it gonna be dropped til below 8050/7670
2. However, so far, I would say
60% confirmed below 8100
20% confirmed below 8000
15% confirmed below 7900
less than 5% confirmed below 7800
3. Long position; open orders $8050/7950/7850/7600 (~x15)
Short position; Closed once
Previous position $8270 and close $8181
Current position open orders $8230 and will close $8100/8050/8000
4. Reasons;
20/50/120 EMA lines are now resistance line.
BB avg line, +1 line, +2 line are now resistance line as well.
Need to push up to at least $8321. If it won't happen, it gonna dropping more.
So far, this chart is working properly and my friends make a profit (a little of profit; maybe more ;) )
They told me that they won't trade today anymore and gonna go to pub XD
If you like this post, please comment or push the like button
If you wanna play on BITMEX, register through it; www.bitmex.com
Thank you so much!
P.S. If you do not disagree, please comment it. I like listening all kinds of opinions.
Have a great day!
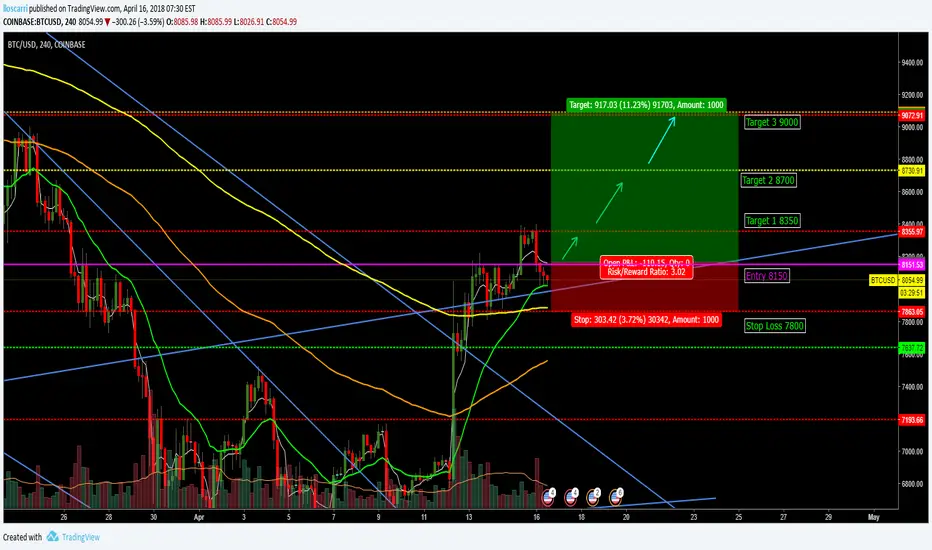
BTC to bounce back UP above Overall Trendline?After the last Up squeeze, BTC/USD is currently moving on a relief (retracement) movement.
It respected perfectly 8355 pivot level (resistance) to bounce down and now is about to face the Overall trendline which can be considered now a support level (was a resistance).
If it can bounce back up from the Support level (around 8150) I would definitively take a long position with a tight stop Loss. (Manage risk before all)
If it never reaches back 8150 level, then no trade
Timeframe 4 hours
MT Alberto
BTC Analysis - Some Advice on Trading Risk/Position SizingG'Day Cobbers,
Bitcoin is looking strong this morning and even opened outside the top of the rising wedge, we hit $9700 before
it stalled and people started to take some profits, we should see some correction but with FOMO, it wouldn't surprise me if it continued on unabated. For the first time since near the ALT we have had a decent crossover back above zero on the TSI, last time it skimmed but fell was the last trap at 11500. RSI is sitting at 68 but still has plenty of room to rise and MACD is looking positive. We have broken into the cloud in the ichimoko cloud.
We can look at 9521, 9282 and 9082 as support and 12945 is the top of the cloud, if we are to play a complete cross through the cloud as a trade.
A little note for those new to this,
The biggest problem I find is that new traders with little to no experience come on tot TV looking for trades or signals and not to learn. They don't seem to understand that important lesson, of having a trading plan. Wins and Losses are all part of success and when we trade it is within defined risk limits and position size. That way win or lose it does not matter, it is all a matter of probabilities and if you believe in your strategy and have a well-managed trading plan, even if your odds of winning are 5.1/10 trades you can profit. I always tell people who come to me looking for advice, don't blindly follow anyone on TV or Twitter, never trade on anyone else's calls with prior research and always trade within your plan and most importantly invest your time in study before trading.
Feel free to come to me for advice, that is why I post here, but don't come looking to blame anyone on TV if you trade on a post and you lose money.
Plan Example:
Equity Size: $10 000
Risk: 1% - 2% max per trade (Risk does not equal position size on each trade but how much you are can lose on each trade)
Reward Potential (Entry and exit )
Placing Entry (support)
Exiting (Resistance)
Placing Stop (this is what defines your risk)
Now once you have found you trade deciding your position size will be defined on where you can set the stop, it needs to be in a place that will not get stopped out too easily, if it is a long term trade it will need to be set wider and crypto is very volitile, you want to also set it in a place that you can say to yourself, okay I got that trade wrong and move on, otherwise you end up just setting the stop again and you will continue to lose the trade.
So your risk is $100- $200 maximum, if you want to place a $1000 position, you need to get your stop at a spot no further away than a $200 loss, if it needs to be set further away than that, you will need to lower the position until it fits your risk %.
I read in Trading in the Zone a perfect analogy, think of your position size as a bridge over the grand canyon, a small position is like a freeway bridge, nice and wide and safe, with plenty of room for error. A large position size is like a tightrope, with no room at all for error and the slightest swing could have you tumbling to your death.
I hope this helps a little,

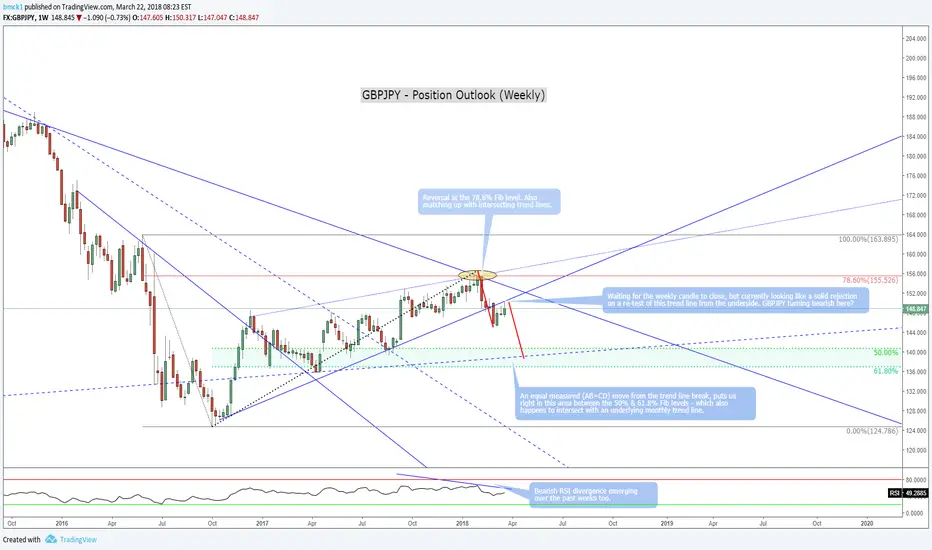
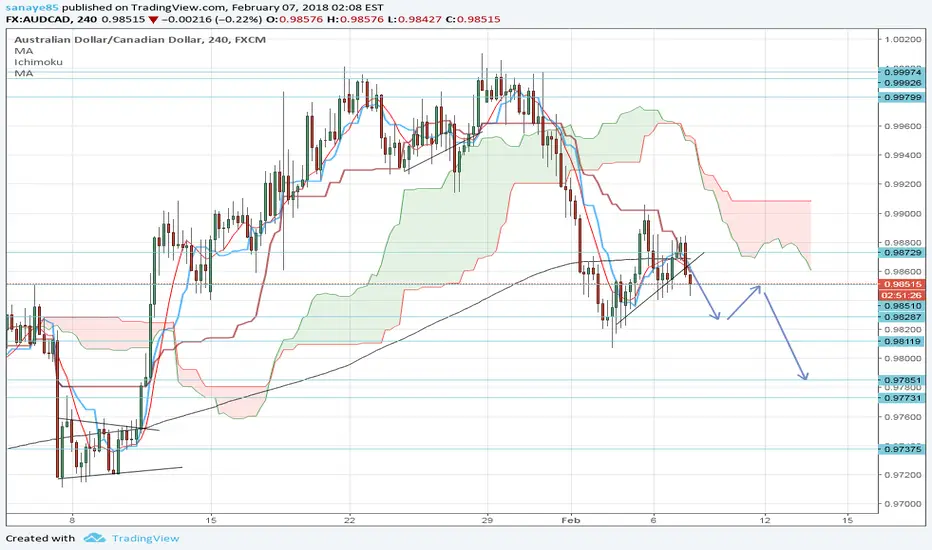
GBPJPY - Position Outlook - Bears on the prowl again?Taking a step back from the intraday/intraweek stuff here and looking at a longer term position idea on the GBPJPY. If we close out this weekly candle below the trendline then I would be looking for this pair to continue on a bearish move towards the potential target area on the chart between the 50% & 61.8% fib levels. Righ where we intersect with a monthly trendline as well. Pair this with the recent bearish divergence on the RSI and I'm liking the short side of this pair over the coming weeks/months.
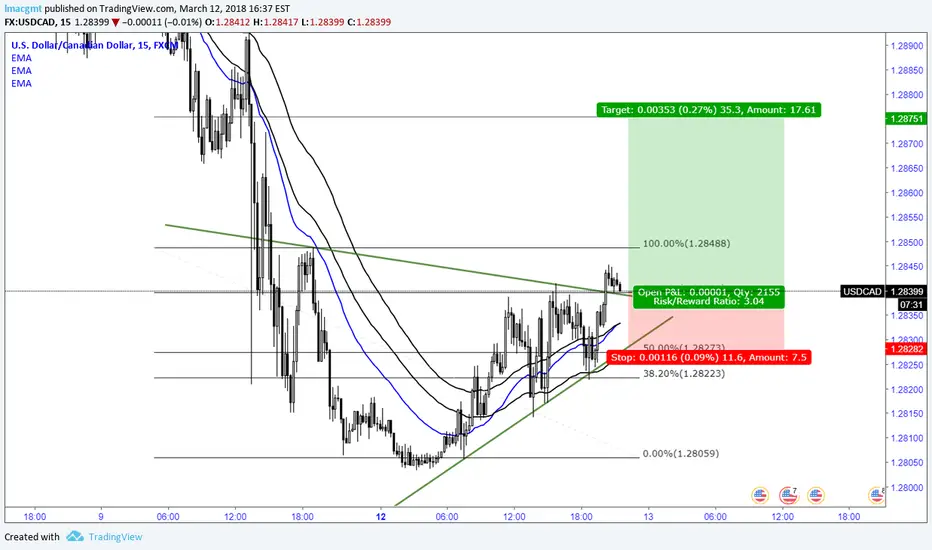
USDCADNot a fan of this choppy ridiculous pair. But here's a break and retest of both a wedge and 78.6 on the fib.
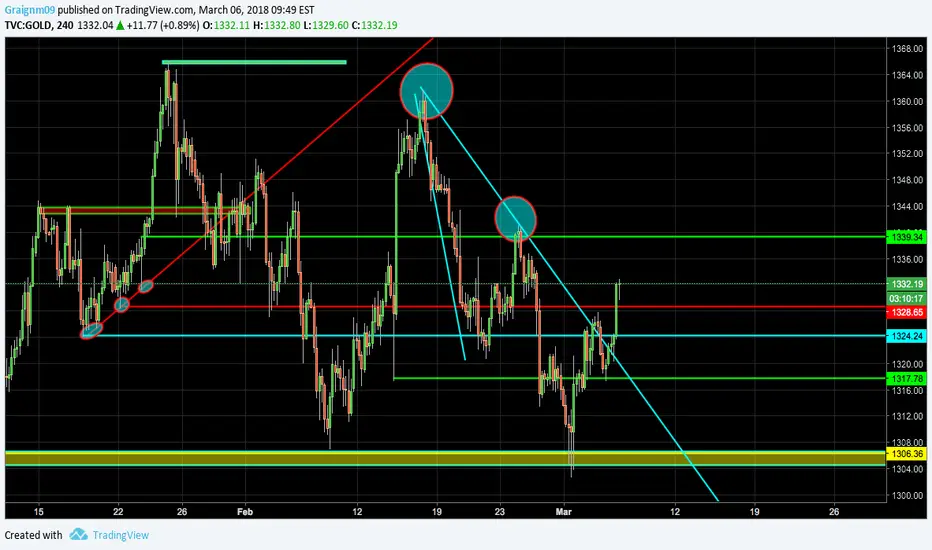
REVERSAL ON GOLD GOING LONG, I REPEAT LONG ON GOLD!Change in trend?
Well as prices have surpasses our prior resistance zone at 1328.00 , I believe that a lucrative trade is on the table.
We could be able to long on this up to highs of 1344.00 and also 1352.00 .
TP:1344.00/1352.00
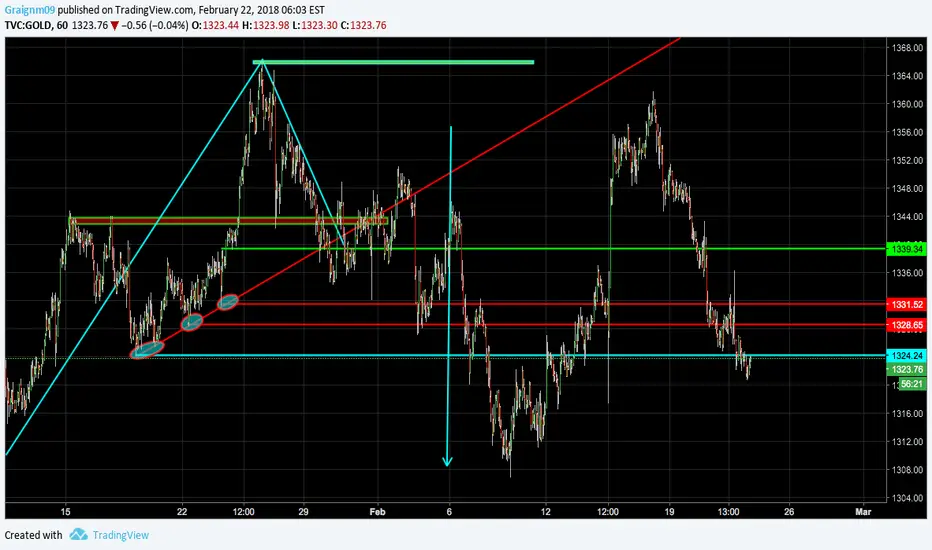
GOLD SHORT! Was Successful!I knew prices would hit my TP however I knew that we were in for a very choppy ride.
My original TP was 1324.24, however I think that if you managed to hold onto this trade you would of known that prices would eventually swing in your favour. Congrats to those who held their position!
Also another Congrats to those who bought back their short positions!
Well Done Guys!
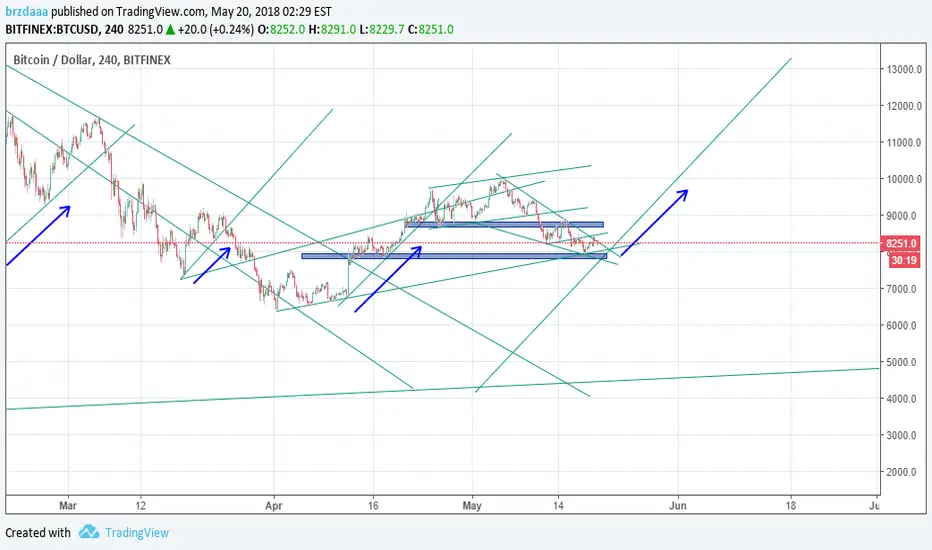
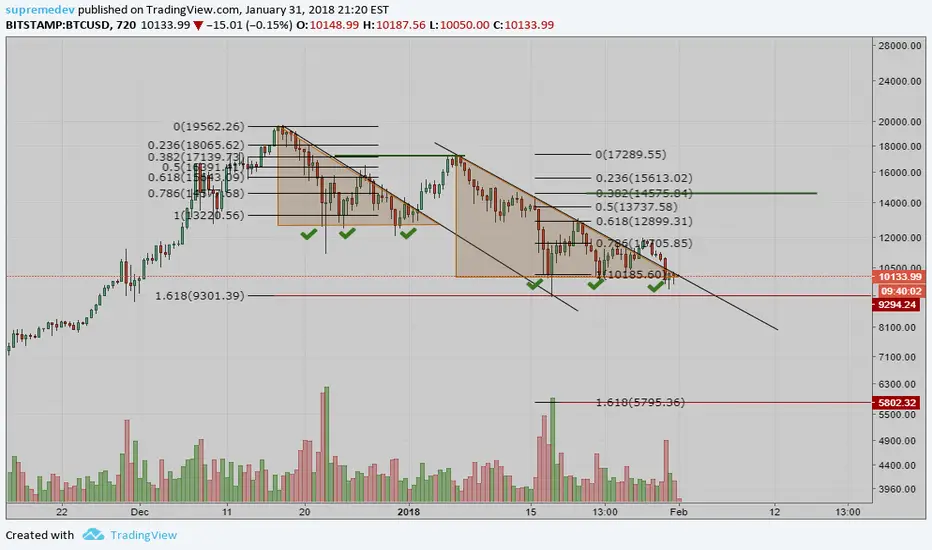
Pure Price Action Analysis on Bitcoin and Possible BreakoutTo determine how the Market Maker has been playing in the market, I've decided to use pure price action analysis. The triangle used is just for a visual representation on levels for breakout. What I want to emphasize on here is the price action; you can see that during the previous downside from 20k to 11k, there was a lot of squeezes and a battle between the shorts and longs. A lot of stops were being hunted by the MMs (you can check this out for an even clearer illustration on the Bitfinex chart where most of this happened).
During the previous downside, the extreme stops (12,500 range) were targeted two times until it opened the possibility a momentum breakout trade. In this downside, Bitcoin just experienced a similar move where the extreme stops were hunted two times. (10,000 range)
What can you do?
- Be very patient, a breakout should always be confirmed by a retracement so you guys can confirm an entry position.
- If the breakout fails, an even stronger down move may occur where you can put stop losses at the 9285 level (the lowest price level it got to/the wick). Downside target could be the 1.618 level just like how the the first downward move played out.
Follow me so you get notified for more updates from me. I focus on market cycles of cryptoassets, position and momentum trading.
Good luck! Contact me at www.twitter.com
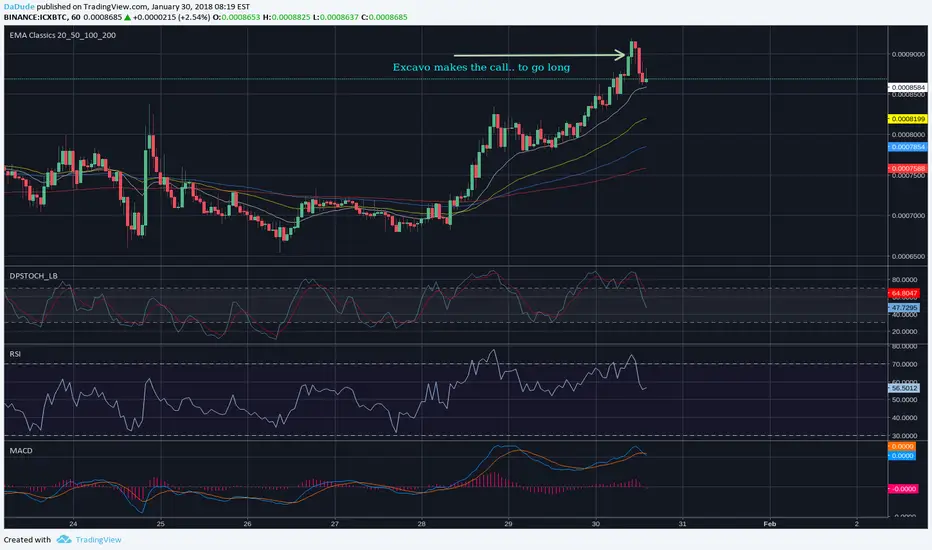
for the excavo icxbtc followerssome of excavo's follower were asking me why it was suicidal to buy at the time he made the call here is why. People learn better when they see a picture
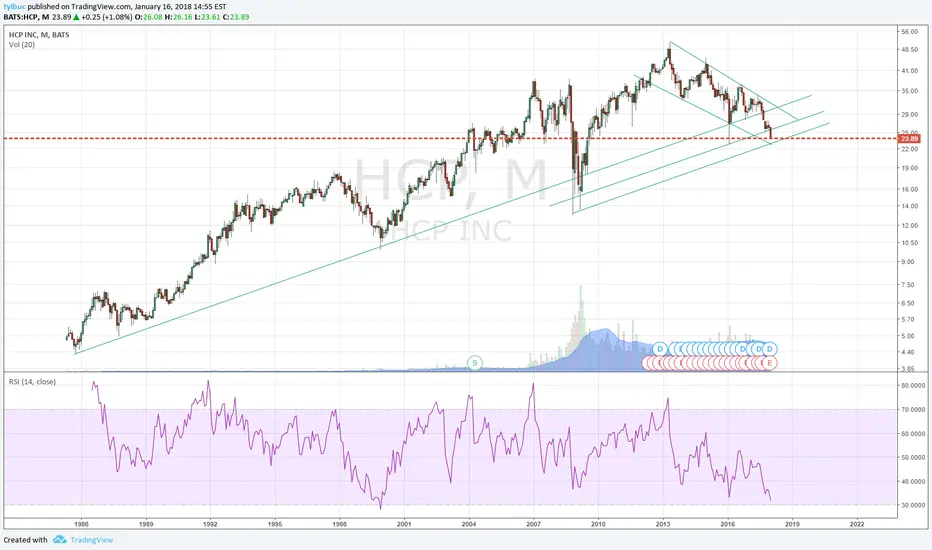
Position Trade: HCP Entry @ 23-23.50Lined up for oversold conditions. Looking for a target around psychological level of $30.
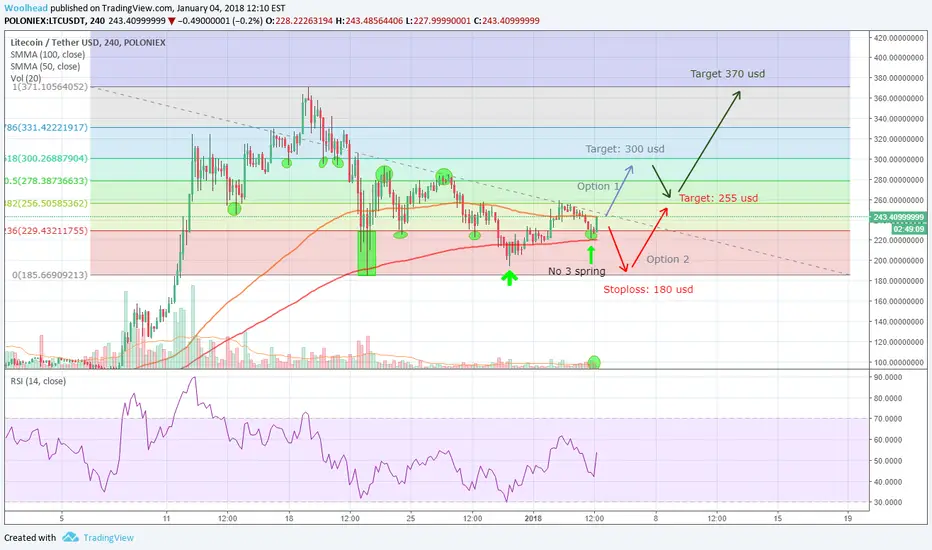
LTCUSDT analysis: Long positionOption 1 goes from here to the blue target: 300 usd. Option 2 goes from here to support, to either stoploss: 180 usd and below, or to the red target: 255 usd. Option green is an extension of option 1 and goes from the blue target of 300 usd to 255 usd as a correction, then to 370 usd as final target in this analysis.
I used Fibonacci retracements, support and resistance and springs and upthrusts in this analysis.
You can read about springs and upthrusts here: www.financial-spread-betting.com
If I made you some money, please consider buying me a beer:
LTC: LfbKuDHZaDTRUV9pXJuWCUcG14XLrGtBcs
USDJPY Big Picture - Breakout Pressure Building The YEN is currently the most bearish held position against an otherwise weak USD (Net Speculators currently 78.4% bearish). 14 period Standard Deviation of Open Interest suggests there is room for more short Yen positions to be added. Open Interest has been building within this significant monthly triangle (shown here on weekly chart) suggesting building steam for a possible breakout.
I am looking to get long on the side of sentiment as the current trendline (purple) seems to be holding to be prepared for a potential long breakout. I will open half my risk here on LTF, and prepare for another long entry around 112 if the purple trendline breaks and retests bottom of current range.
Long will be strongly tested at confluence of blue support levels and monthly upper trendline (black). I'll be adding a short hedge at this level as I expect some bounce or even perhaps more range trading in the blue triangle. On bounce at 113.6-114 zone both long entry and hedge entry Stop Losses will be moved to BE to be safely positioned for movement in either direction.
All published ideas are for educational and informational purposes only. Note specific entry ideas posted here may be part of a larger position and/or portfolio held by the author. Trading foreign exchange on margin carries a high level of risk, and may not be suitable for all investors. The high degree of leverage can work against you as well as for you. Before deciding to trade foreign exchange you should carefully consider your investment objectives, level of experience, and risk appetite. The possibility exists that you could sustain a loss of some or all of your initial investment and therefore you should not invest money that you cannot afford to lose. You should be aware of all the risks associated with foreign exchange trading, and seek advice from an independent financial advisor if you have any doubts.

TRXBTC - Cup and Handle (LONG)It appears that TRX is in the process of forming the "handle" after a "cup" that's been formed from over a decently long period of time.
Given the apparent consistency with the normal characteristics of this charting pattern, I would recommend those who are looking to place long positions on TRX to wait until we hit the bottom of the handle formation, which I expect to be as low as 387 satoshis (previous resistance became new support).
Happy trading!

XEMBTC Long XEMBTC (Positional Trade)
• I am holding this trade for a period of 3 Months. I can see a clear HH sequence forming (Green Dotted trend line). I see price is reacting right above the support and price is challenging the guy who started the move. But I presume that there would be some bearish sign on the trend line If that happens then I would be likely to do hedging as I could sense price is not willing to go Lower Low and it will take a turn to hit the target.
• But here the main point is buyers are strong in this case, it took 6 weekly candles to reach that highest point and sellers are so week it took nearly 29 weekly candles to come to the recent support area that tells strength of the buyers coming in and sellers are so weak. I also presume that I will not see the sign of LL. If this case happens to be safe I am using a wider stop loss and reducing my position size.
• I will be updating this trade once in a week.
Risk Management:
Entry: 0.0000325
TP: 0.000058
Stop loss: 0.00000444
Position Size: 1% Risk on your capital/15.5
Risk/Reward: 1:3 So, HH RR.
If TP is hit then we will be at 44% profit.
Buy from Sellers and Sell from Buyers.

>>EURUSD<< >>December Week 1<< Long SetupW.W Wave rider
Long @1.18500
Sl @1.17700
Tp1 @1.19450
Tp2 @1.20200
Happy about every feedback or Idea :)
W.W

S$P500 index: Short Position Update, lower stopS&P 500 SPX500 Short Position Update
Lowering stop to 2588.7 on short to 2588.9 (to break even if
this trade goes wrong from here), but still looking for 22-23
points downside to 2578-2576 from 2589 entry point if right.

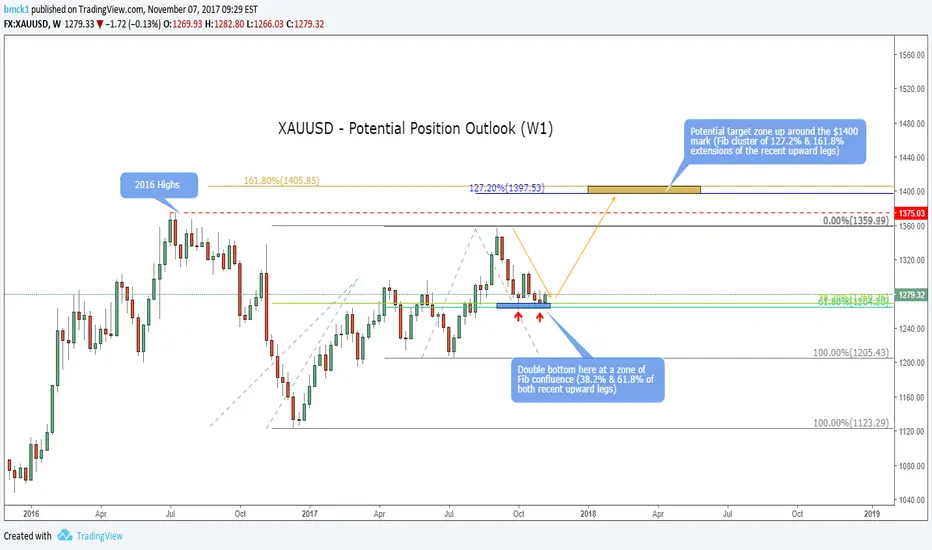
Longer term position outlook for XAUUSDLooking at a potential scenario here over a position trading timeframe (weekly) on XAUUSD
We seem to be holding a relatively key Fib 'area' on the W1 chart at the moment (38.2% & 61.8% of the recent upwards moves) - with this in mind I'd like to see a continued rally in this metal to hopefully re-test the highs of last year and if we can break above then potentially an extended move up to the 'golden' zone on the chart here where we have a cluster of Fib extension levels from the recent moves (127.2% & 161.8%)
I don't usually trade these longer term trades as I don't currently have the patience to hold a position for months on end! :) But have been becoming increasingly more interested in position trades simply as a more 'hassle free' addition to the old trading arsenal.
Let see where it takes us!
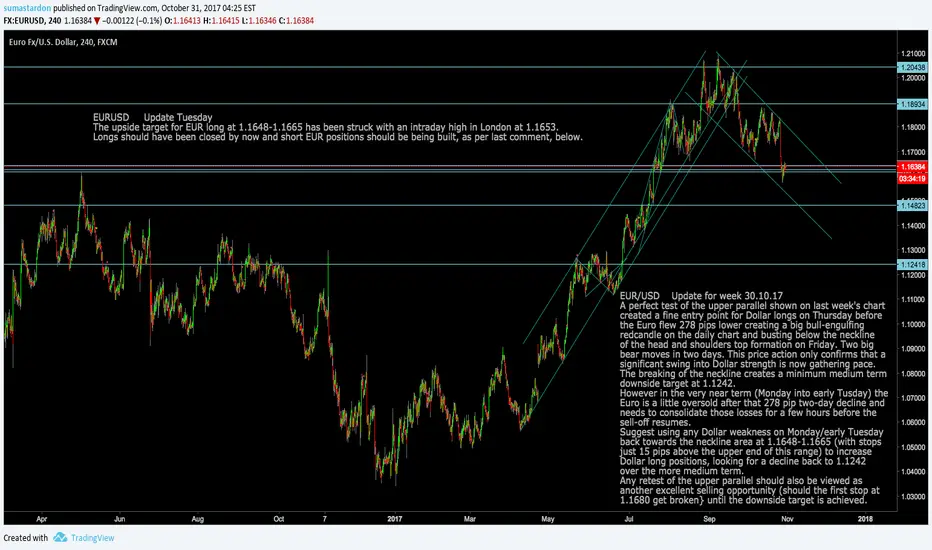
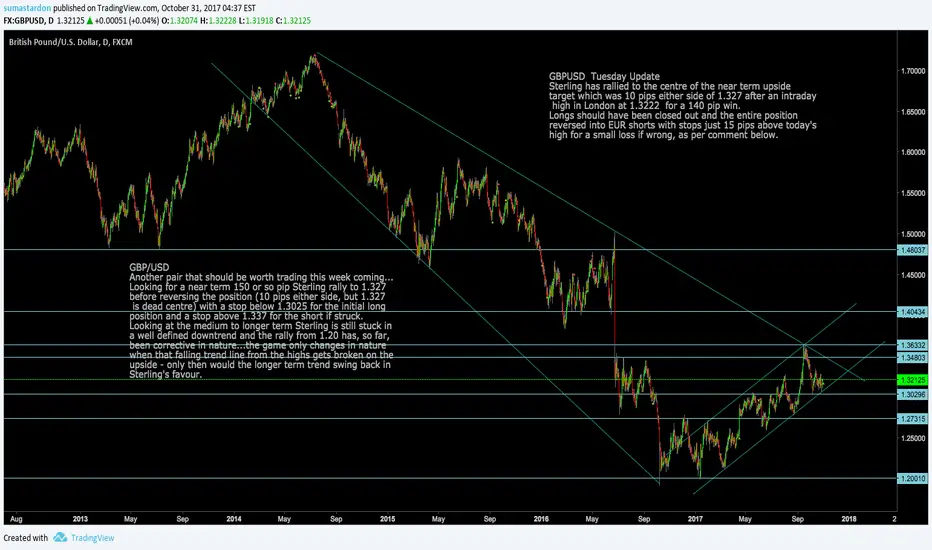
GBPUSD: Upside target achieved for 140 pip win. Time to reverseGBPUSD Tuesday Update
Sterling has rallied to the centre of the near term upside
target which was 10 pips either side of 1.327 after an intraday
high in London at 1.3222 for a 140 pip win.
Longs should have been closed out and the entire position
reversed into EUR shorts with stops just 15 pips above today's
high for a small loss if wrong, as per comment below.
EURUSD: Upside target hit, now short EUR EURUSD The upside target for EUR has been hit at 1.1648-1.1665 after an intraday high in London at 1.1653 for a 140 pip win. Now it's time to reverse the position, as per comment.