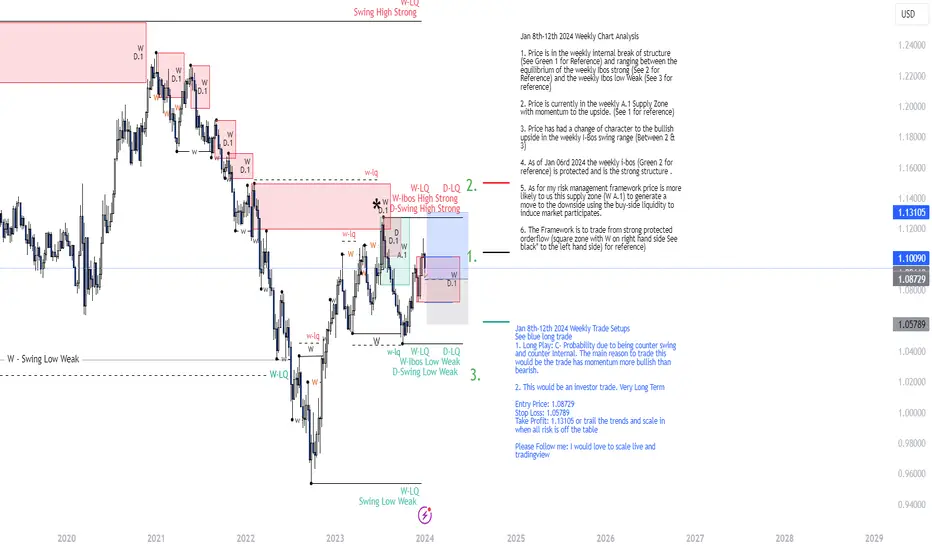
EURUSD Jan 8th-12th 2024 Weekly Trade Setup-LONGJan 8th-12th 2024 Weekly Trade Setups
See blue long trade
1. Long Play: C- Probability due to being counter swing and counter Internal. The main reason to trade this would be the trade has momentum more bullish than bearish.
2. This would be an investor trade. Very Long Term
Entry Price: 1.08729
Stop Loss: 1.05789
Take Profit: 1.13105 or trail the trends and scale in when all risk is off the table
Please Follow me: I would love to scalp live on tradingview
Jan 8th-12th 2024 Weekly Chart Analysis
1. Price is in the weekly internal break of structure (See Green 1 for Reference) and ranging between the equilibrium of the weekly Ibos strong (See 2 for Reference) and the weekly Ibos low Weak (See 3 for reference)
2. Price is currently in the weekly A.1 Supply Zone with momentum to the upside. (See 1 for reference)
3. Price has had a change of character to the bullish upside in the weekly I-Bos swing range (Between 2 & 3)
4. As of Jan 06rd 2024 the weekly i-bos (Green 2 for reference) is protected and is the strong structure .
5. As for my risk management framework price is more likely to us this supply zone (W A.1) to generate a move to the downside using the buy-side liquidity to induce market participates.
6. The Framework is to trade from strong protected orderflow (square zone with W on right hand side See black* to the left hand side) for reference)
Position

Cross-Checking Gold’s Supertrend Adaptively on MTFAGreetings Esteemed Investors,
I've received numerous inquiries regarding my gold (XAU) long position. Some of you have even suggested that I might be mistaken and consider XAU to be bearish. While I cannot assess your individual trades, I can provide a more detailed explanation of my rationale.
Comparing Indicators
Top Chart: Supertrend
This chart displays XAUUSD daily candles. I prefer daily candles to analyze gold over a year or more, as this helps filter out noise and reduce false signals. Additionally, I've applied TradingView's built-in Supertrend indicator, which often proves profitable over long timeframes. Observe the 2023 yearly chart of XAUUSD; buying when the Supertrend was positive (green) and selling when it was negative (red) would have been profitable.
Bottom Chart: Advanced Dynamic Threshold RSI
The bottom chart also displays XAUUSD daily candles for 2023, but here, multiple timeframes are considered using the Advanced Dynamic Threshold RSI indicator. This indicator generates weighted buy and sell signals based on RSI analysis, dynamic threshold calculation, and optional Bollinger Bands. Note the different RSIs under the candles (blue, green, and orange). The selling signals appear as red triangles and the buy signals are green triangles.
Comparison: Supertrend vs Advanced Dynamic Threshold RSI
Timelines
In 2023's XAUUSD market, I observed that Supertrend tends to indicate bullish trends earlier than my RSI, while my RSI might indicate bearish trends sooner than Supertrend. The dotted lines on both charts show the timeline of the detected trend. The sooner the trend was detected, the earlier the timeline started. This difference in timelines highlights the potential trading advantage of using both indicators together.
Exclusive & Inclusive Cross-Checking Methods
Inclusive Cross-Checking Principle
My Advanced Dynamic Threshold RSI indicator uses an inclusive cross-checking method, where RSI signals from different timeframes must align for a signal to be displayed. This ensures that all RSI indications are in consensus. However, this method makes the indicator slower to react on bullish shifts.
Exclusive Cross-Checking Principle
I used two charts and two indicators to demonstrate the potential of exclusive cross-checking. In this method, a long signal (Buy sticker) is generated if at least one of the indicators shows bullishness. In this case, one exclusive buy signal is sufficient to display the sticker. This method allows for quicker action on bullish trends.
Selective Cross-Checking Principle
Selective cross-checking combines exclusive and inclusive methods. The key is to understand which indicators tend to predict certain developments sooner. In 2023, for XAUUSD, Supertrend was faster for bullish trends and my indicator was faster for bearish trends. So, I wrote rules like the RSI signals of multiple timeframes must align, but I don't require the agreement of Supertrend and MFT RSI to open a position.
Latest Position
I opened a long position on XAUUSD on November 12th. The original stop loss was $1925, and the potential target is $2072. However, I'm using trailing profit, so the risk-reward ratio has changed. I currently wouldn't open a long position, but I'll keep the existing long position until the trail profit activates or the RSI indicator generates a sell signal.
Disclaimer:
This is not investment advice. Conduct your own research. This publication explains only one aspect of my approach, not my comprehensive strategy. The idea focuses on observations around the price action; reading the indicator descriptions is recommended for understanding of the calculations.
Sincerely,
Ely

Kelly Criterion and other common position-sizing methodsWhat is position sizing & why is it important?
Position size refers to the amount of risk - money, contracts, equity, etc. - that a trader uses when entering a position on the financial market.
We assume, for ease, that traders expect a 100% profit or loss as a result of the profit lost.
Common ways to size positions are:
Using a set amount of capital per trade . A trader enters with $100 for example, every time. This means that no matter what the position is, the maximum risk of it will be that set capital.
It is the most straight-forward way to size positions, and it aims at producing linear growth in their portfolio.
Using a set amount of contracts per trade . A trader enters with 1 contract of the given asset per trade. When trading Bitcoin, for example, this would mean 1 contract is equal to 1 Bitcoin.
This approach can be tricky to backtest and analyse, since the contract’s dollar value changes over time. A trade that has been placed at a given time when the dollar price is high may show as a bigger win or loss, and a trade at a time when the dollar price of the contract is less, can be shown as a smaller win or loss.
Percentage of total equity - this method is used by traders who decide to enter with a given percentage of their total equity on each position.
It is commonly used in an attempt to achieve ‘exponential growth’ of the portfolio size.
However, the following fictional scenario will show how luck plays a major role in the outcome of such a sizing method.
Let’s assume that the trader has chosen to enter with 50% of their total capital per position.
This would mean that with an equity of $1000, a trader would enter with $500 the first time.
This could lead to two situations for the first trade:
- The position is profitable, and the total equity now is $1500
- The position is losing, and the total equity now is $500.
When we look at these two cases, we can then go deeper into the trading process, looking at the second and third positions they enter.
If the first trade is losing, and we assume that the second two are winning:
a) 500 * 0.5 = 250 entry, total capital when profitable is 750
b) 750 * 0.5 = 375 entry, total capital when profitable is $1125
On the other hand, If the first trade is winning, and we assume that the second two are winning too:
a) 1500 * 0.5 = 750 entry, total capital when profitable is $2250
b) 2250 * 0.5 = 1125 entry, total capital when profitable is $3375
Let’s recap: The trader enters with 50% of the capital and, based on the outcome of the first trade, even if the following two trades are profitable, the difference between the final equity is:
a) First trade lost: $1125
b) First trade won: $3375
This extreme difference of $2250 comes from the single first trade, and whether it’s profitable or not. This goes to show that luck is extremely important when trading with percentage of equity, since that first trade can go any way.
Traders often do not take into account the luck factor that they need to have to reach exponential growth . This leads to very unrealistic expectations of performance of their trading strategy.
What is the Kelly Criterion?
The percentage of equity strategy, as we saw, is dependent on luck and is very tricky. The Kelly Criterion builds on top of that method, however it takes into account factors of the trader’s strategy and historical performance to create a new way of sizing positions.
This mathematical formula is employed by investors seeking to enhance their capital growth objectives. It presupposes that investors are willing to reinvest their profits and expose them to potential risks in subsequent trades. The primary aim of this formula is to ascertain the optimal allocation of capital for each individual trade.
The Kelly criterion encompasses two pivotal components:
Winning Probability Factor (W) : This factor represents the likelihood of a trade yielding a positive return. In the context of TradingView strategies, this refers to the Percent Profitable.
Win/Loss Ratio (R) : This ratio is calculated by the maximum winning potential divided by the maximum loss potential. It could be taken as the Take Profit / Stop-Loss ratio. It can also be taken as the Largest Winning Trade / Largest Losing Trade ratio from the backtesting tab.
The outcome of this formula furnishes investors with guidance on the proportion of their total capital to allocate to each investment endeavour.
Commonly referred to as the Kelly strategy, Kelly formula, or Kelly bet, the formula can be expressed as follows:
Kelly % = W - (1 - W) / R
Where:
Kelly % = Percent of equity that the trader should put in a single trade
W = Winning Probability Factor
R = Win/Loss Ratio
This Kelly % is the suggested percentage of equity a trader should put into their position, based on this sizing formula. With the change of Winning Probability and Win/Loss ratio, traders are able to re-apply the formula to adjust their position size.
Let’s see an example of this formula.
Let’s assume our Win/Loss Ration (R) is the Ratio Avg Win / Avg Loss from the TradingView backtesting statistics. Let’s say the Win/Loss ratio is 0.965.
Also, let’s assume that the Winning Probability Factor is the Percent Profitable statistics from TradingView’s backtesting window. Let’s assume that it is 70%.
With this data, our Kelly % would be:
Kelly % = 0.7 - (1 - 0.7) / 0.965 = 0.38912 = 38.9%
Therefore, based on this fictional example, the trader should allocate around 38.9% of their equity and not more, in order to have an optimal position size according to the Kelly Criterion.
The Kelly formula, in essence, aims to answer the question of “What percent of my equity should I use in a trade, so that it will be optimal”. While any method it is not perfect, it is widely used in the industry as a way to more accurately size positions that use percent of equity for entries.
Caution disclaimer
Although adherents of the Kelly Criterion may choose to apply the formula in its conventional manner, it is essential to acknowledge the potential downsides associated with allocating an excessively substantial portion of one's portfolio into a solitary asset. In the pursuit of diversification, investors would be prudent to exercise caution when considering investments that surpass 20% of their overall equity, even if the Kelly Criterion advocates a more substantial allocation.
Source about information on Kelly Criterion
www.investopedia.com
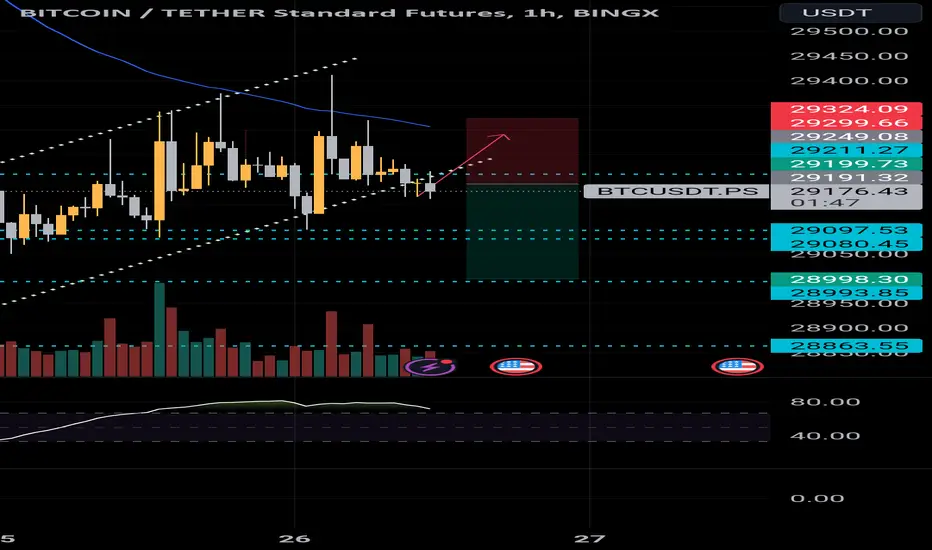
Short BTCUSDTOne of the best positions in channel failure,
One of the best exchanges that I work with and introduce to you.
Log in with the link below and get a bonus every week :
Bingx and this code :
3YQOOI
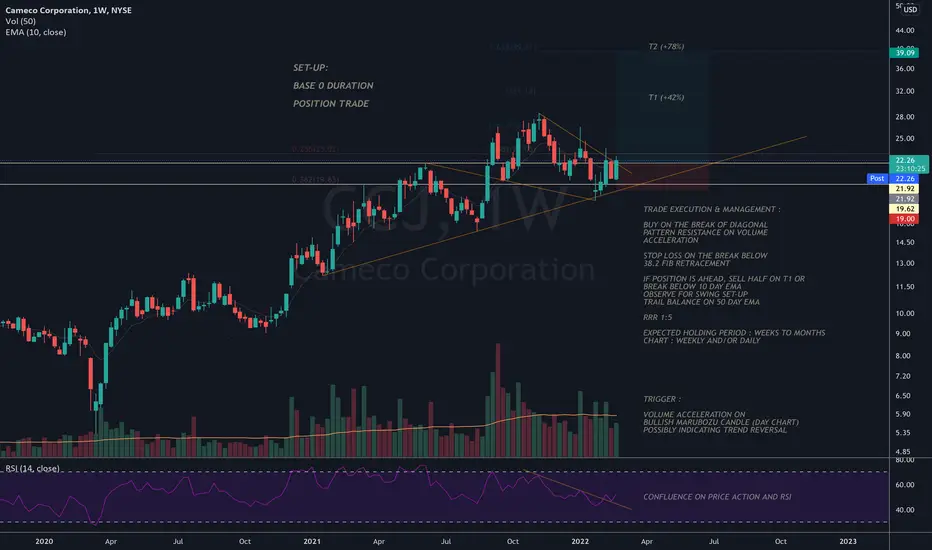
CCJ : BASE 0 DURATION / POSITION TRADECameco (NYSE:CCJ) released a strong print ahead of market open, and followed up with a strong call, as the market leader points towards a narrowing supply/demand gap and increased willingness for utilities to contract at higher prices:
CATALYSTS :
McArthur River - CEO Gitzel indicated that there's no change to the Company's strategy of pre-selling future production; there's a home for the additional supply from McArthur's restart, and they will not be growing production to build inventory or sell into an oversupplied spot market.
Contracting - the company added 40m lbs to the contract book in the first month of 2022, as the fundamental backdrop for demand improved; additionally, the pandemic and depletion in Kazakhstan has brought security of supply challenges for customers; "contracting begets contracting" and Cameco expects continued opportunities to lock in favorable, long-term contracts throughout 2022.
Sprott - The emergence of a "financial market" buyer in late 2021, namely Sprott (OTCPK:SRUUF) soaked up a lot of spot-market supply and pushed up spot prices; however, spot buying also removed customer complacency and pushed longer-term contract prices higher.
Kazakhstan - both trade policy concerns and instability in Kazakhstan have focused buyers on the origin of supply and helped Cameco take market share.
Having struggled with an oversupplied market since Fukushima, it appears the uranium market is finally coming around for low-cost, long-lived producers in secure jurisdictions, like Cameco. With favorable policy likely to come out of the European Taxonomy proposals, the sector (NYSEARCA:URA) appears well positioned for a strong 2022.
SOURCE:
CCJ after the call -- after a decade, the market looks to be turning, shares up ~15%, Nathan Allen, Seeking Alpha, Feb. 09, 2022
seekingalpha.com
Uranium: Potential Trade Of The Decade, Gain Exposure With SRUUF, URNM, Live Hard Investing, Seeking Alpha, Feb. 10, 2022
seekingalpha.com
THREE positions for BTCGreetings everyone,
I apologize for my absence as I was on vacation. In Iran, we celebrate the festival of Nowruz which revolves around the appreciation of nature and the earth's rotation.
Now, let's shift our focus back to analyzing this magnificent coin!
________________________________________________________
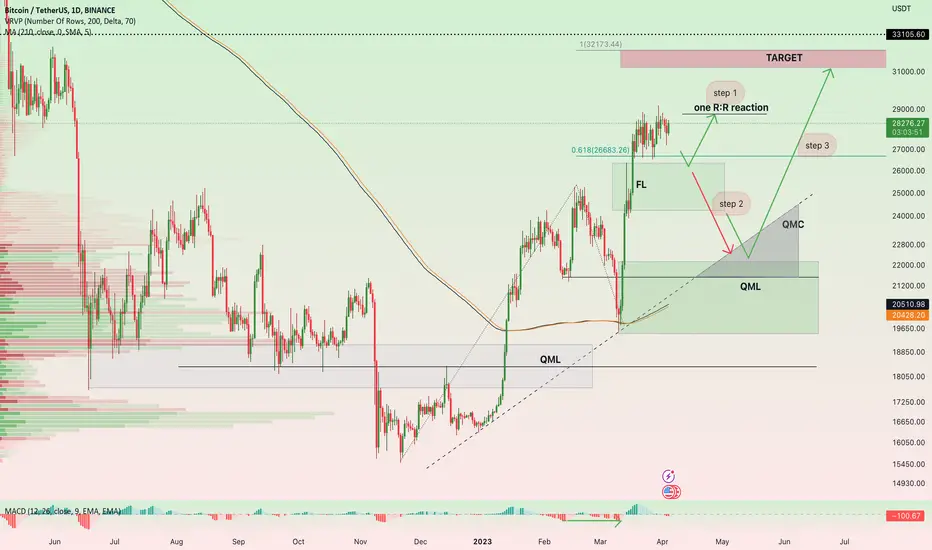
What happened to BTC before?
It reached the QML.
It started a sharp upward movement after a divergence on the MACD.
It exited the ascending channel, however, not very convincingly.
________________________________________________________
What should we do now? (My prediction)
Step 1: It will touch the FL area and create a long position there. This will involve minimal movement and will only be based on the stop loss.
Entry: $26680
Target: $28200
Step 2: After this, it is expected to reach the trendline as shown on the chart. The target will be dynamic and will depend on following the price and trendline at the moment.
Step 3: Once it touches the QMC and QML, it will initiate a long movement until it reaches the target that I have shown.
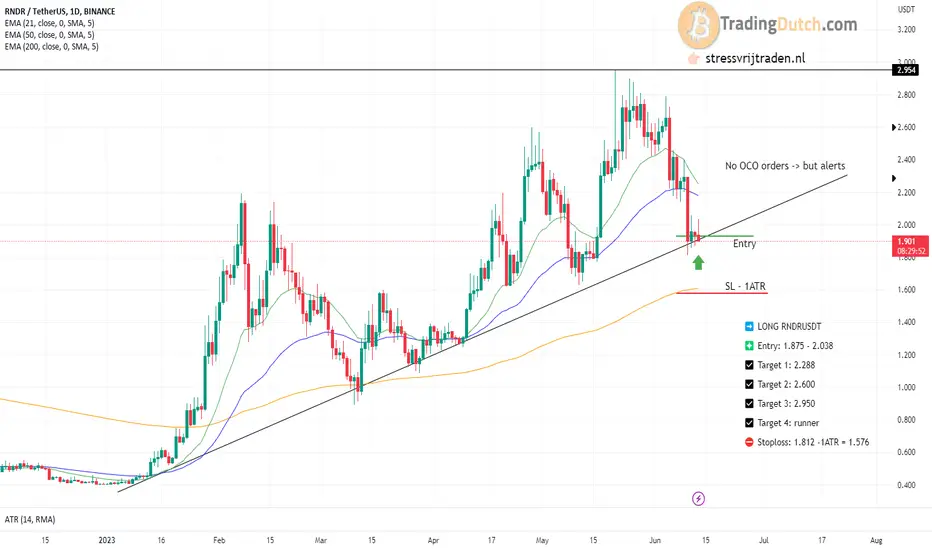
LONG RNDRUSDTTrendline is holding nicely since January 2023. Als long as BTC holds above 25.350 I keep this position according to the following settings:
➡️ LONG RNDRUSDT
❇️ Entry: 1.875 - 2.038
☑️ Target 1: 2.288
☑️ Target 2: 2.600
☑️ Target 3: 2.950
☑️ Target 4: runner
⛔️ Stoploss: 1.812 -1ATR = 1.576
GOLD on 4h timeframeHi Guys,
Are you wondering what's next on gold ? here you go :
Gold is definitly for sell for next period up to next september on a long run which means we're buying sometimes from some good supports but our vision will be more bearish we'll start selling gold now until it breaks the supporting trend line then we'll buy for a retest with precaution after the retest is done around 1955 we'll start shorting again until 1880 levels where we expect the gold to change the trend so we'll buy until a second retest at 1991 LEVELS then that will be the best huge move down where we'll be 100% bearish big bears we'll then focus on selling gold until next september ! i hope this analysis will help you and guide your for this period ! follow our chart and make good profits !
trade safe !

CADPLN bearish outlook weekly 3/8 trap looks like we could be heading to the downside if my alert gets triggered i will consider executing a trade to the downside for big profits.

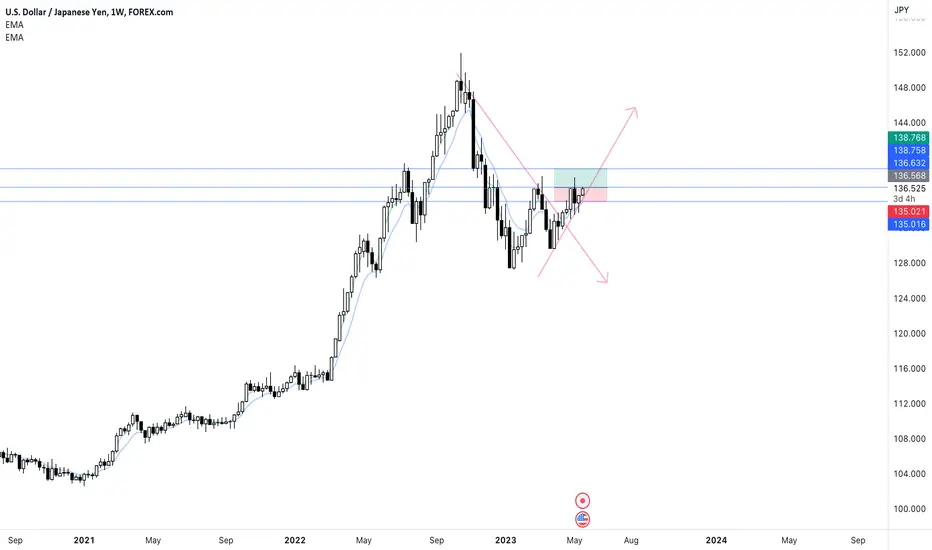
usdjpy position trade weekly bullish outlookpattern look good. could potentially head to the upside in next couple days . we considered executing a trade for big prfits.
GBPSEK LONG WEEKLY OUTLOOK 3/8 TRAPlooks like price is moving up. my alert went off and considered to execute a trade for potential big gains on weekly chart for longer term position.

EURMXN bearsh out look weekly chartlooking good if it continues to the downside we will consider executing a trade for big profits

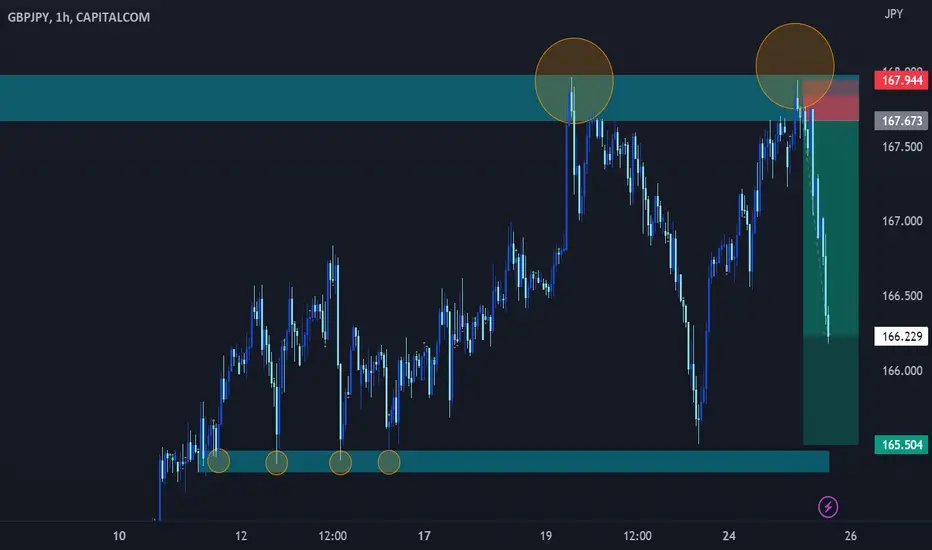
GBPJPY SHORTIn GBP/JPY there is a supply since December. I used this supply to look for a potential entry point. I opened a short position this morning with a 1:8 risk-reward ratio target.
Let me know in the comments what you think.
Happy trading everyone.
BTC possible entry point with at least 1:10 risk reward ratio ! If you want to take a 1:10 risk-reward ratio do what I showed on the chart, but note that this method will have a lower success rate but with a higher profit. so, If you are an aggressive trader set the positions as I showed, but If you want to take a lower risk and lower profit with a higher success rate you can do what I wrote on the right side of the chart.

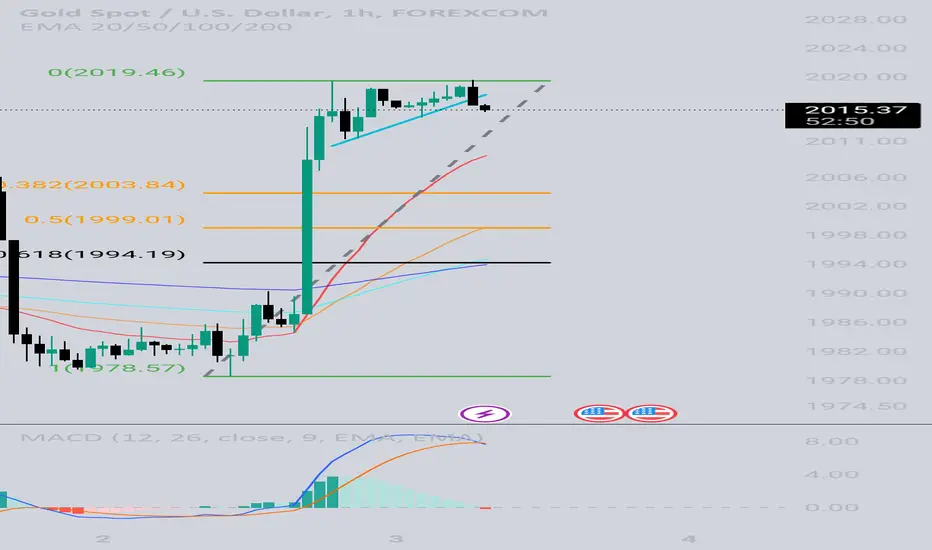
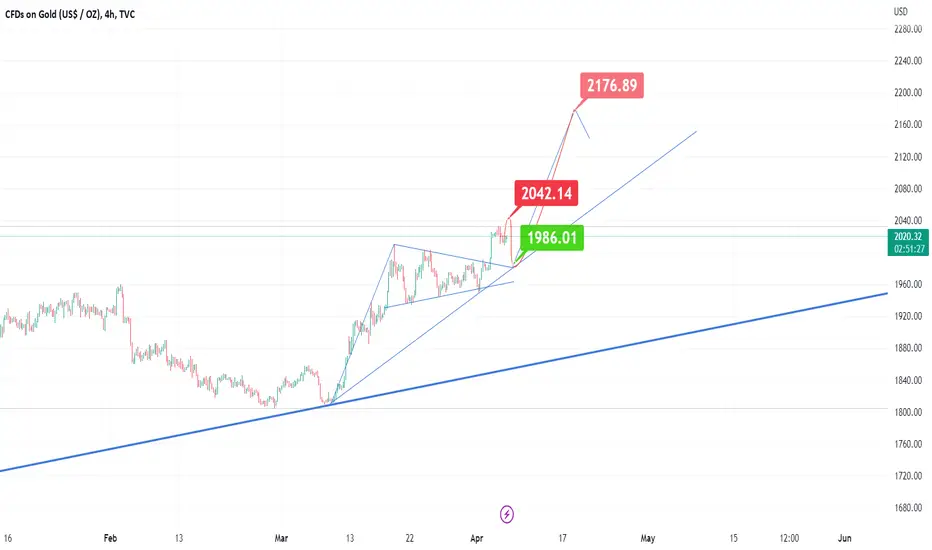
GOLD trading ideaHI.
Here's the next days Gold Map :
after the big move up we're expecting the gold to continue with a smal wave until 2042 levels then start shorting gold until 1986 where it is going to retest our broken triangle
then start big buys operations pay attention to the quick moves down to hit your Stops ! make sure you have good stop lossat least 5 dollars.
we expect the gold to respect the secondary up trend lineuntil 2176 it may accelerate and it may also goes slow it will depend on the market conditions but one thing is sure the gold is not yet to sell for the upcoming days.
trade safe and good luck to everyone!
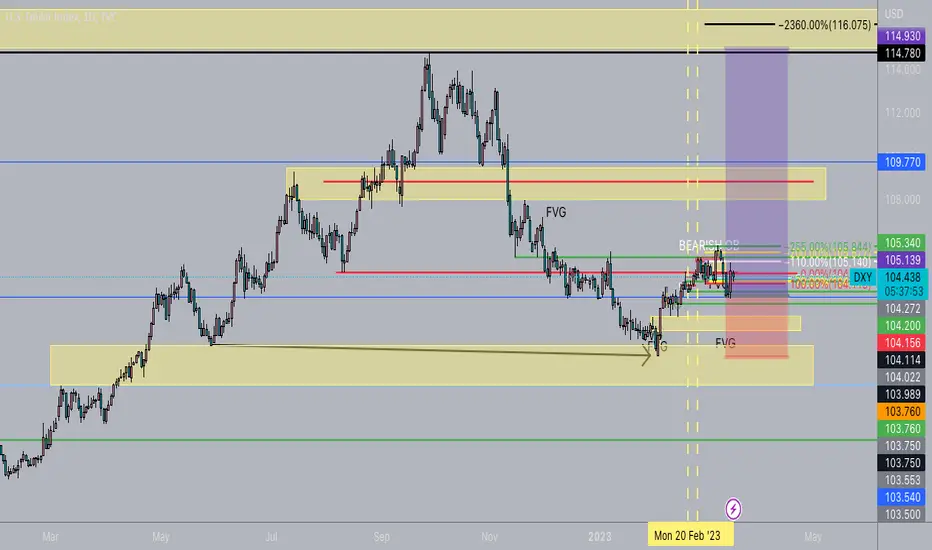
P2P | DXY - Anybody Else Feeling Like This?Hey family sorry I've been a bit MIA this week, things happen so we gotta get through and keep pushing!
Take a look into this #DXY mark up and see if you see what I'm seeing (/0.0\)
Trade well gang and keep moving that stop loss into profit!
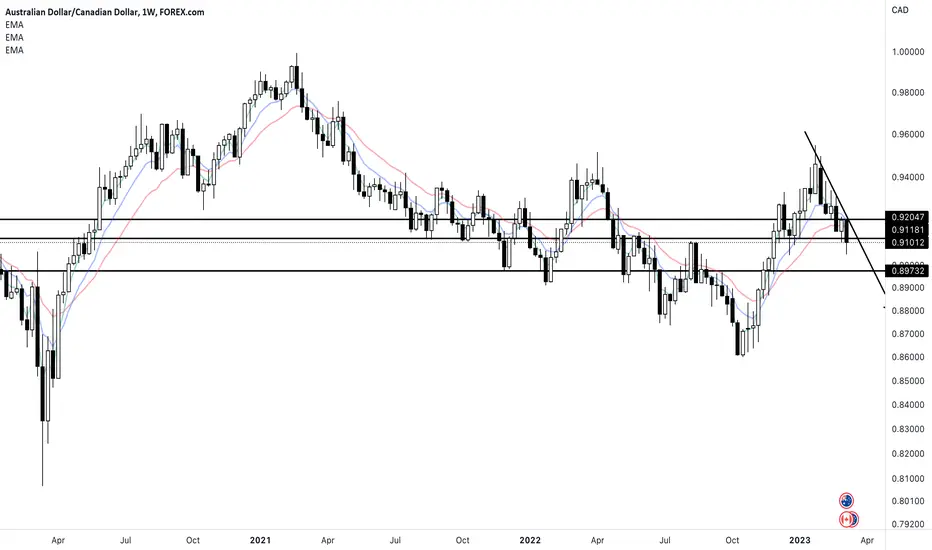
AUDCAD SHORT POSITION OUTLOOKlooks like audcad could be heading to the downside if so we will consider initiating a short long term position.
🟩 $MSI - buying pilot positionGrabbing a pilot position into MSI (telco)
RS rating is lower 84/100
Industry group is lower 125/197

🟨 AAON - on the watchlistLooking for the stock to consolidate at the alert level (cyan color). If it breaks out of there I think this would be a good stock (around the red arrow).
This is what Jessie Livermore called the Line of Least Resistance

3/8 Trap Set Up Short GBPJPY Outlook Weekly Chartlooks like GBPJPY tested resistance level and closed with bearish engulfing pattern.
if currency continues to the downside we will consider opening a trade and target support levels for big profits.
