Positional
GUJARAT SIDHEE CEMENT:Cement sector stock-6Sl-29
Stocks for the week-4
Hello everyone, this week we are going to invest in many different sectors.
One of which is CEMENT SECTOR(from infrastructure sector).
I will be posting best stocks of cement sector and the % allocation that stock should take in your portfolio.
STOCKS ALLOCATIONS
Stock 1: AMBUJA CEMENTS LTD 25%
Stock 2: ACC LTD 15%
Stock 3: INDIA CEMENTS 15%
Stock 4: JK LAKSHMI CEMENT 15%
Stock 5: SANGHI INDUSTRIES 10%
Stock 6: GUJARAT SIDHEE CEM 15%
Stock 7: BURNPUR CEMENT LTD 5% (penny stock)
So folks feel free to DM or comment.

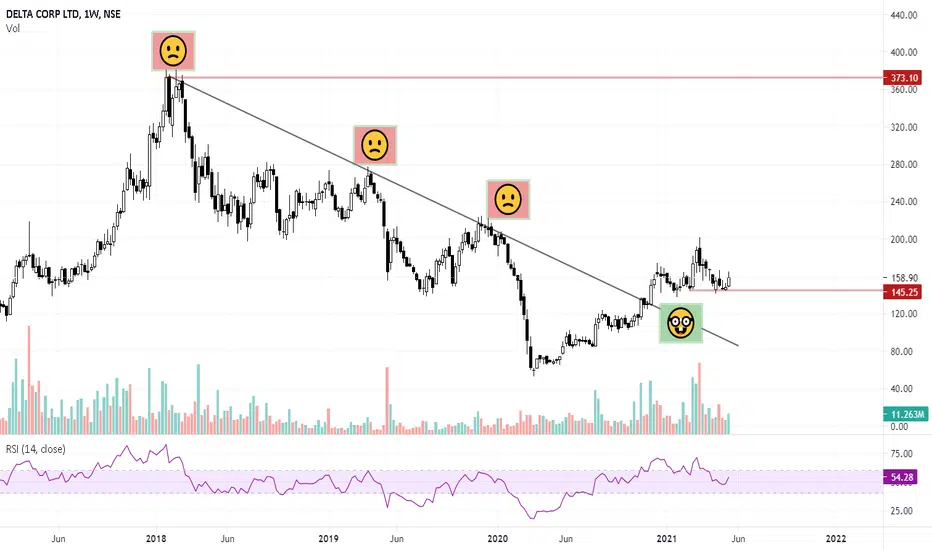
DELTA CORP LTD Long term trendline BreakThe stock has broken its 3 years downtrend trendline in Dec 2020 and has been able to sustain above it and consolidating in the range of 200- 150.
Currently, prices are trading at and taking support at the lower range.
And it is likely that it might bounce and move towards the upper side of the range at the minimum.
One more positive thing to notice here is the higher high and higher lows structure of this recent rally that started in March 2020.
This could be traded with a stop below 140 levels for an initial target of 200 and if the stock reaches its initial target, it could be trailed for higher targets.
Type of Trade: Positional
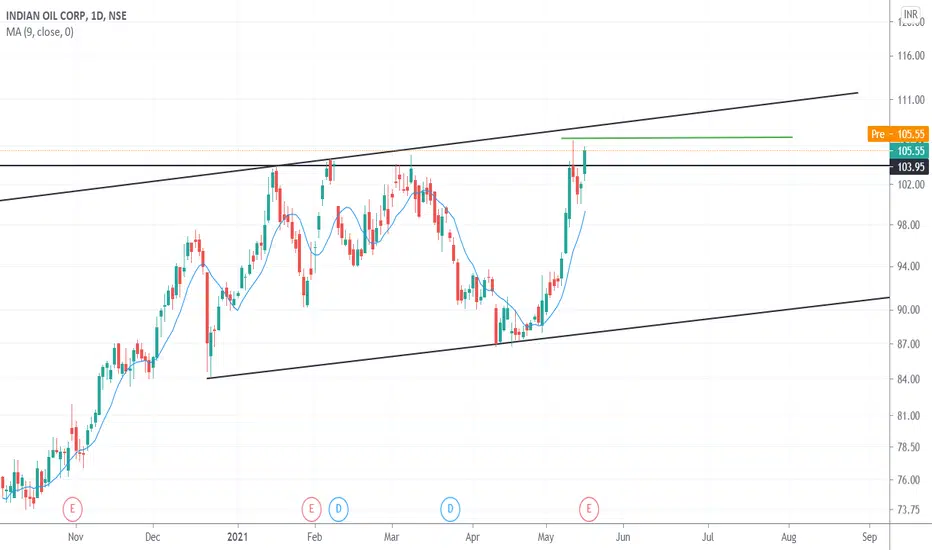
Buy and hold IOC for good ReturnsA breakout happens after a month. It can move further if today's results are positive. So one can enter after the results.
Is Powergrid a good buy? I was scanning the stocks through the gainers and losers list today, and the stock that took most of my attention is the Powwergrid.
Why? Let me tell you, the first and foremost reason was: the stock went above its all-time high today, though couldn't close above it, but it did make a new high today.
Second: Price Action on All timeframes are in alignment, all pointing in one direction.
Third: RSI is above 60 on daily weekly and monthly charts.
All these parameters, suggesting that we could see a good move in the upside in the stock..
The range i could see for the short term is 225-210, in which stock could consolidate.
Conclusion : Sustaining above 210 levels, stock could see 270 levels in the coming weeks/months.
Type of Trade : Positional, Breakout

Technical View: Hold for Target of 725,770 and 880Technical View: Breakout on Weekly Chart with Increasing Volume, Hold Motilal Oswal Finance for Target of 725, 770, and 880 respectively.
Current Price: 657.50
Keep Stop Loss: 572
Disclaimer: Not a buying/selling recommendation. Please consult your financial advisor before any investment in equity.

M_MFIN 15 DAYS POSITIONAL VIEW FOR 15-25% RETURNBUY ABOVE 156 TGT1 180 TGT2 188 TGT3 195 SL 148 CLOSING BASIS
HOLD FOR 15 DAYS

Enter after the breakout - BirlacorpnIf the Birlacorpn cross above 1070 there is a chance to move further.

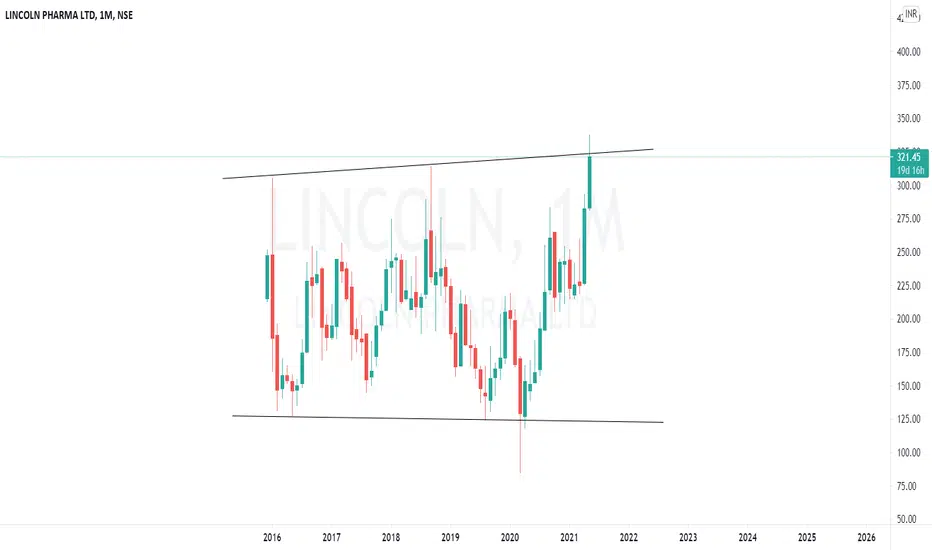
Lincoln Pharma: Time for medicines (Pharma Sector)Sl - 285
Pharma stocks are defensive and best to balance portfolio. As Nifty may remain in consolidation for one more week.
Chart is clear and clean.
If you have any query use comment or mssg me.
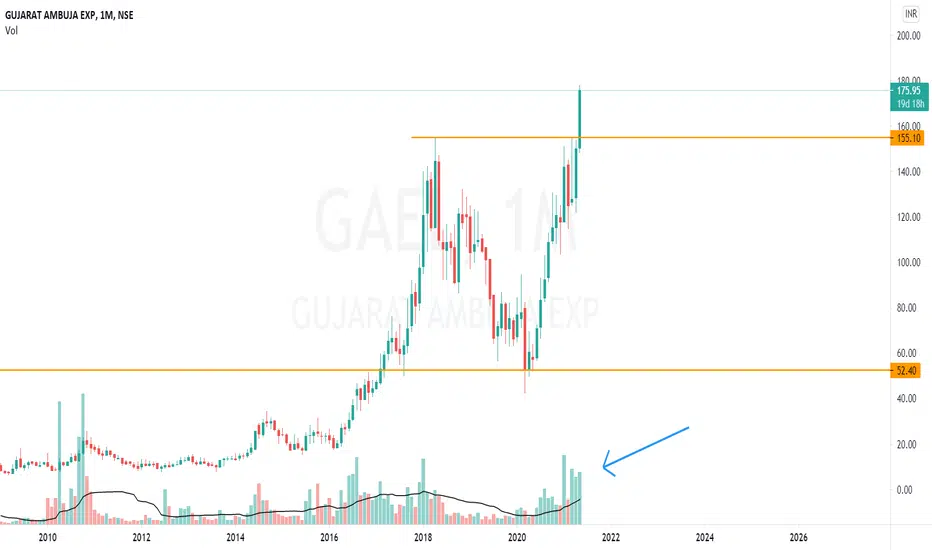
Gujarat ambuja exports: Stock for short termSl - 148
Can we bought half quantity now and the other half after the retracement.
Volume are increasing on breakout which is a good sign .
Fundamentally good stock to focus on.
Only quality stocks are shared here. I focus on quality ONLY.
Shoot up your queries in comment section.
GOLD COMEX IS BULLISHGOLD COMEX FORMING A DOUBLE BOTTOM PATTERN AND BREAK OUT OF A TREND LINE UPSIDE GIVES A BULLISH DIRECTION WHCH INDICATES A TARGET OF 1961


BHEL - Swing Trade - Weekly chartThis analysis is done purely on basis of price action and chart patterns.
The analysis is done on weekly TF hence it can take couple of days to couple of weeks/months to reach the target.
The image is self explanatory.
Range for entry, SL and Target is shown in image itself.
Since this is a stock of NIFTY ENERGY index, one can refer the weekly chart of NIFTY ENERGY as well.
This analysis is for study purpose.
Traders must do their own study before entering into any trade. Traders should trade with their own risk capacity and money management.
Feel Free to comment for any query or suggestion regarding this stock or Price Action Analysis/Chart Study
Check out my previous analysis on this stock. Idea is linked below.

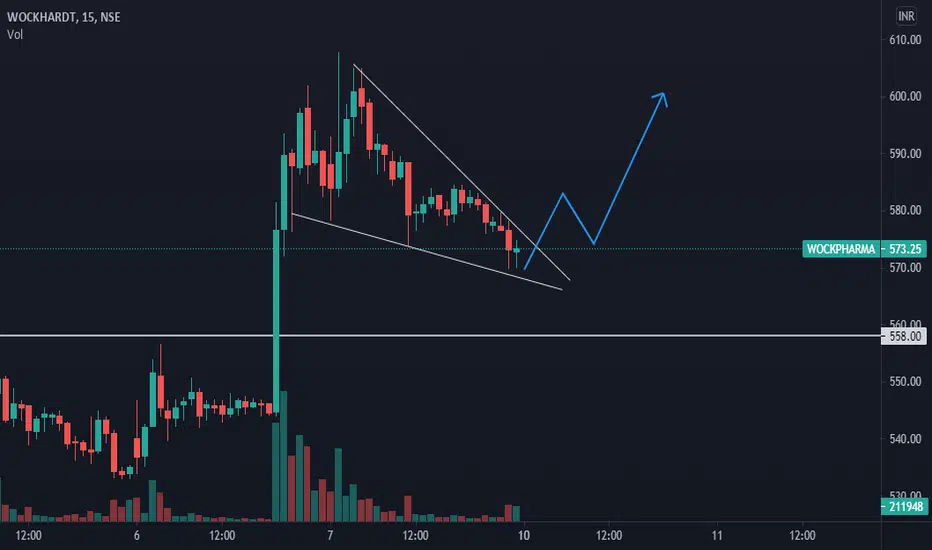
wockpharma short term Wockpharma breakout happened in daily chart, and now retracing , In 15 min time frame falling wedge pattern in forming. once the falling wegde brokes it will go above

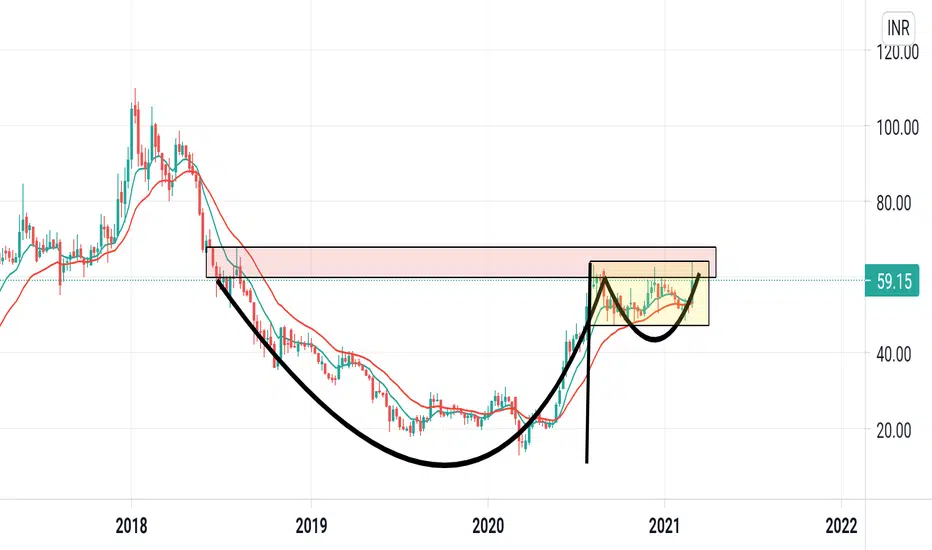
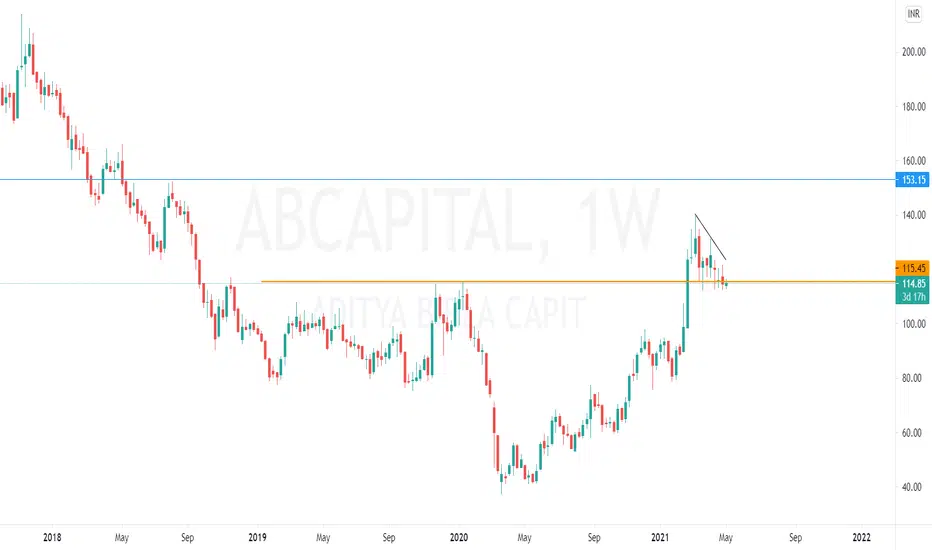
ADITYA BIRLA CAPITAL:Rouding bottom pattern(Mutual Fund Company)Breakout and retest Done PERFECTLY
Buy 105-115-120
Target - 140,150,180
SL - 99
POST YOUR QUERY IN COMMENT SECTION
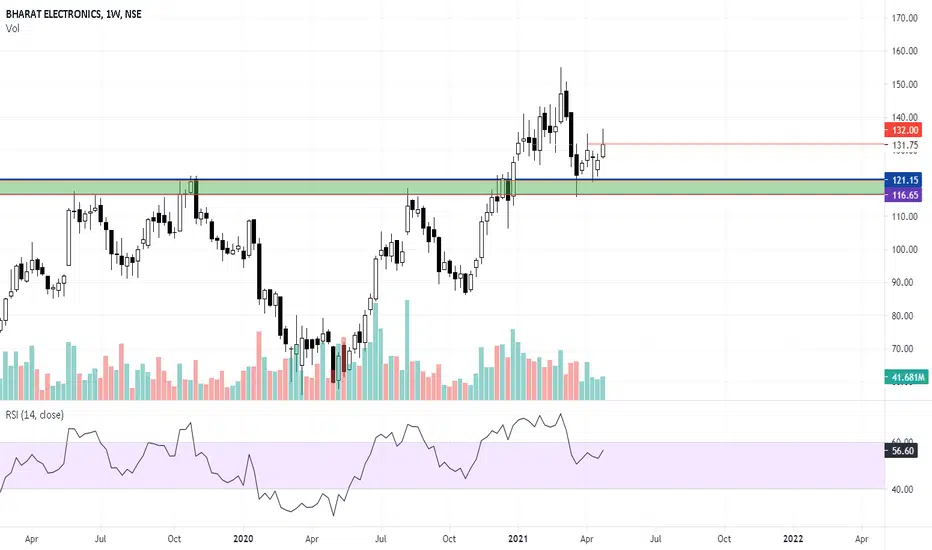
BEL - Pullback TradeBel has formed good support around 115 -120 levels, sustaining the same levels can see a good rally in the stock.
TWLOO looks good for a long positionInverted H&S breakout after a downtrend. Look good for a positional trade. Levels mentioned in the chart.
The Inverse Head-And-Shoulder pattern is an example of a bullish reversal pattern.The inverse head-and-shoulder pattern often shows up at the bottom of a move in the market.

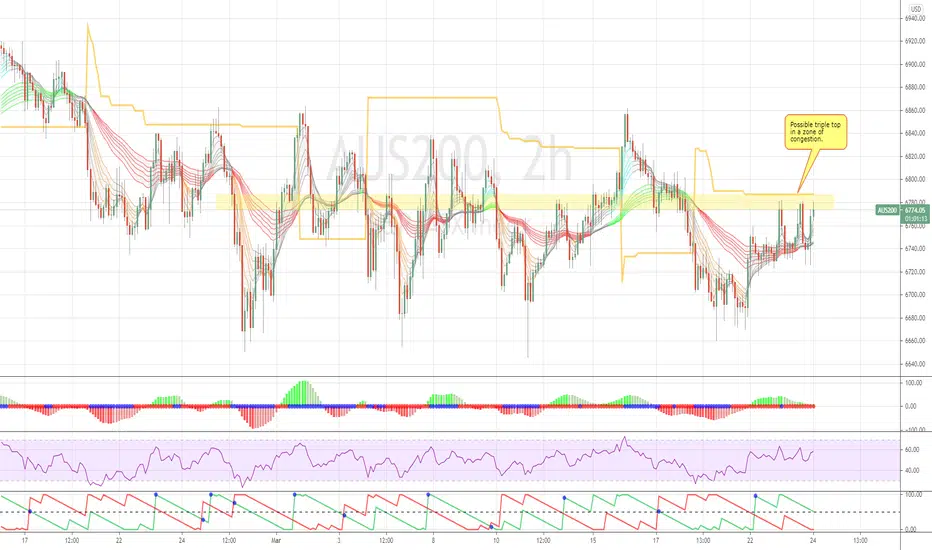
AUS200: Possible triple topThis one to watch. For new traders its a nice one to try out on a Tradingview paper trading account.
The possible triple top is into a zone of congestion. Price may go up or it may go down - only two directions here.
All you can do is take a controlled affordable loss (aka stoploss).
This is positional play for finding a trend south on a lower time frame.
Disclaimers : This is not advice or encouragement to trade securities on live accounts. Chart positions shown are not suggestions and not intended to assure you of an advantage. No predictions and no guarantees are supplied or implied. The author trades mostly trend following set ups which has a low win rate of approximately 40%. Heavy losses can be expected if trading live accounts. Any previous advantageous performance shown in other scenarios, is not indicative of future performance. If you make decisions based on opinion expressed here or on my profile and you lose your money, kindly sue yourself.
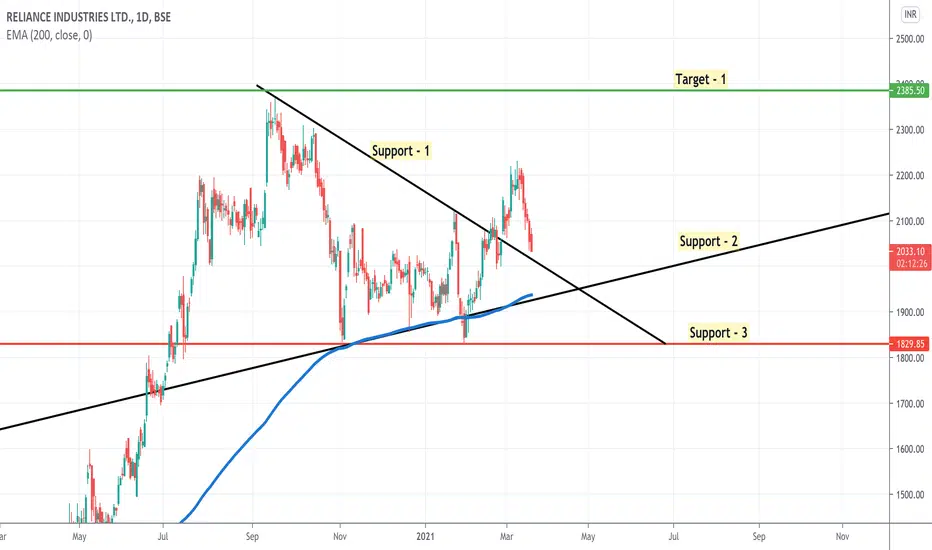
Reliance - Positional ViewTaking support in 200 EMA
Buy on dips
good support at 2000, as maximum put sellers
Daawat Daawat formed Cup and Handle + Pole and Flag pattern in weekly chart.. buy above 69 for the target of 80/90/100/106.. #Positional
Note : Before entry ask your the great sebi Registered Advisor 👍 😀