CONCORHi guys,
In this chart i Found a Demand Zone in CONCOR CHART for Positional entry,
Observed these Levels based on price action and Demand & Supply.
*Don't Take any trades based on this Picture.
... because this chart is for educational purpose only not for Buy or Sell Recommendation..
Thank you
Positional

ASTRALi Observed these Levels based on Price Action and Demand & Supply which is my own Concept "PENDAM CONCEPTS"... Please don't take any trades based on this chart/post... Because this chart is for educational purpose only not for Buy or Sell Recommendation... Thank Q

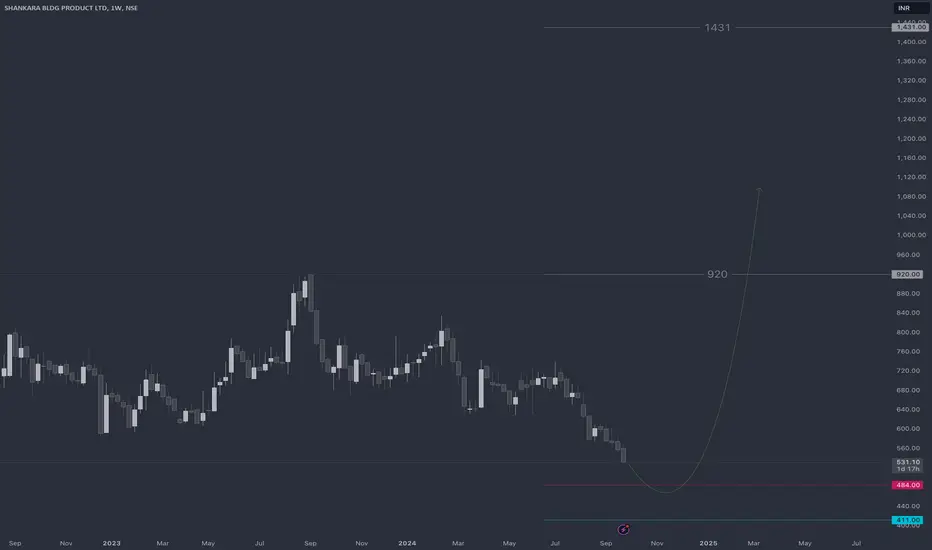
SHANKARAHi guys,
In this chart i Found a Demand Zone in SHANKARA CHART for Positional entry,
Observed these Levels based on price action and Demand & Supply.
*Don't Take any trades based on this Picture.
... because this chart is for educational purpose only not for Buy or Sell Recommendation..
Thank you
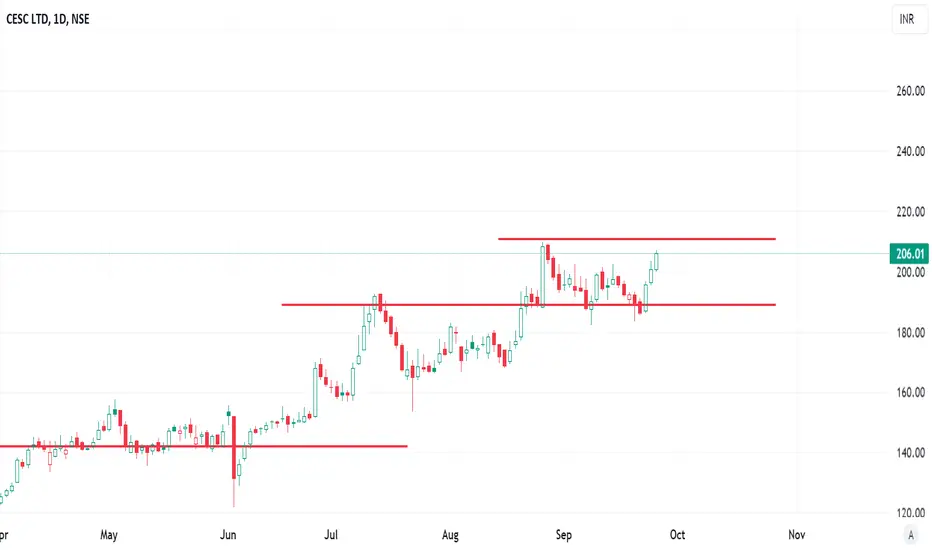
Positional trade setup for CescObservations:
Resistance Breakout: CESC has broken above the horizontal resistance zone around ₹200-206, which it tested multiple times in the past. This breakout indicates bullish momentum.
Strong Volume: The price increase is accompanied by strong buying pressure, suggesting that the breakout may be sustained.
Trade Setup:
Entry:
Aggressive Entry: Buy around the current price of ₹206-208, as the stock has already broken the resistance.
Conservative Entry: Wait for a pullback to the ₹200-205 range, where the stock might retest the breakout zone before resuming its upward move.
Target:
First Target (T1): ₹225-230, based on the previous swing highs and projected move after the breakout.
Second Target (T2): ₹250-260, if the momentum continues and the broader market remains supportive.
Stop Loss:
Place a stop loss at ₹185, below the previous consolidation zone, to avoid being caught in a false breakout.
For a more conservative approach, you can place the stop loss slightly below ₹190, just below a recent low point.
Timeframe:
This is a positional trade, so it could take several weeks to months for the targets to be achieved, depending on the market conditions.
Risk Management:
Position Size: Keep the position size moderate to account for volatility. Use proper risk management, limiting losses if the breakout fails.
Trailing Stop Loss: Once the stock reaches ₹220, consider moving your stop loss to ₹200-205 to lock in some gains. Similarly, if the stock reaches ₹230, move the stop to ₹210.
Summary:
Entry: Buy around ₹206-208 (aggressive) or wait for a pullback to ₹200-205 (conservative).
Stop Loss: ₹185 (aggressive) or ₹190 (conservative).
Targets: ₹225-230 (T1) and ₹250-260 (T2).
This trade idea capitalizes on the breakout above a major resistance level, indicating further upside potential if the trend holds.
Positional trade setup for Astral LtdThe chart for Astral Ltd. shows a potential reversal pattern after a prolonged downtrend, where the price has bounced off a key support level near ₹1850-1900. This level acted as strong support, and the stock is showing signs of recovery with recent bullish candles indicating renewed buying interest.
Observations:
Support Zone: The stock has tested and respected a strong support zone near ₹1850, which coincides with a recent bottom formation.
Recovery Signal: A bullish momentum is visible as the stock has crossed back above the ₹2000 level, with a notable upward move.
Positional Trade Setup:
Entry:
Aggressive Entry: Buy at the current levels of ₹2025 since the stock is in an upward trend from the support zone.
Conservative Entry: Wait for a slight pullback towards the ₹1950-2000 range for a better entry after a potential retest of the breakout level.
Target:
First Target (T1): ₹2250-2300, based on previous swing highs and resistance levels.
Second Target (T2): ₹2450-2500, if the stock continues its upward momentum.
Stop Loss:
Place a stop loss just below the recent support at ₹1850, which would invalidate the bullish setup if broken.
Timeframe:
This is a positional trade setup, so it could take a few weeks to a couple of months for the targets to be achieved, depending on market momentum.
Risk Management:
Position Size: Use moderate position sizing considering the stop loss is around ₹170 below the current price, offering a decent risk-to-reward ratio.
Trailing Stop Loss: Once the stock reaches ₹2200, you can move your stop loss to ₹2000 to lock in some gains.
Summary:
Entry: Buy at ₹2025 (current level) or on a pullback to ₹1950-2000.
Stop Loss: ₹1850.
Targets: ₹2250-2300 (T1) and ₹2450-2500 (T2).
This trade setup takes advantage of the bounce from key support, with the potential for a continued upside if the overall market remains bullish.

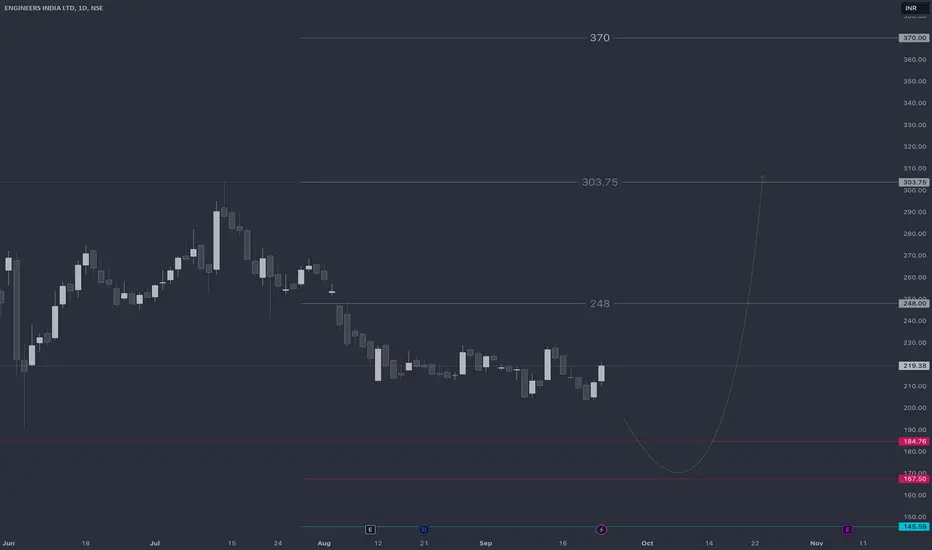
ENGINERSINHi guys,
In this chart i Found a Demand Zone in ENGINERSIN CHART for Positional entry,
Observed these Levels based on price action and Demand & Supply.
*Don't Take any trades based on this Picture.
... because this chart is for educational purpose only not for Buy or Sell Recommendation..
Thank you
PRAKASHHi guys,
In this chart i Found a Demand Zone in PRAKASH CHART for Positional entry,
Observed these Levels based on price action and Demand & Supply.
*Don't Take any trades based on this Picture.
... because this chart is for educational purpose only not for Buy or Sell Recommendation..
Thank you

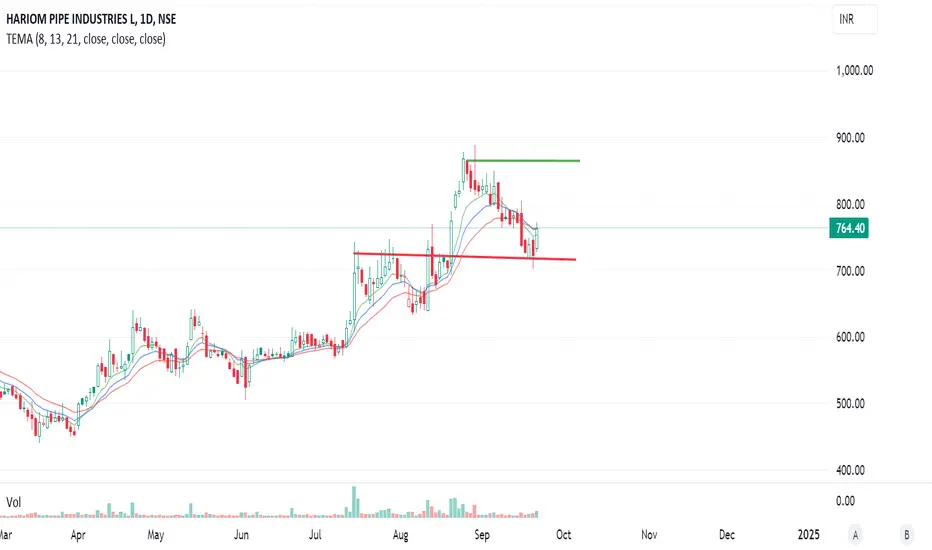
Hariom Pipe Industries Ltd. (NSE) Positional trade IdeaObservations:
Current Price: ₹764.40, with a 5.77% increase on the day.
Resistance and Support Levels:
Resistance near ₹800 (marked by the green horizontal line).
Support near ₹715 (marked by the red horizontal line).
Trend: The stock has been in an uptrend but appears to have corrected recently and is now bouncing off a support level.
Indicators:
The stock is trading close to its TEMA (Triple Exponential Moving Average) lines (TEMA 8, 13, 21).
The price has bounced near the support and may retest resistance levels soon.
Trade Ideas:
1. Long Position (Bullish Strategy):
Entry: If the stock sustains above ₹765 (current price), one can consider entering with the expectation of an upward move towards ₹800 and beyond.
Stop Loss: Place a stop loss around ₹715 (below the recent support line).
Target: First target at ₹800. If broken, the next resistance could be around ₹850-₹875, which may offer further upside potential.
2. Short Position (Bearish Strategy) if Support Breaks:
Entry: If the stock breaks below ₹715 and sustains, one can consider a short position.
Stop Loss: Place a stop loss around ₹765.
Target: First target near ₹680, with a potential further downside toward ₹650 if the bearish trend continues.
3. Wait for Breakout/Breakdown (Neutral Strategy):
If you prefer confirmation, you could wait for a clear breakout above ₹800 or a breakdown below ₹715 to initiate a trade.
Breakout Trade: Enter long above ₹800 for a target of ₹850+.
Breakdown Trade: Enter short below ₹715 for a target of ₹680 or lower.
Risk Management:
Keep your risk-to-reward ratio favorable, at least 1:2.
Stay alert for any macroeconomic news or sector-specific developments that might impact the stock’s price action.
Ritco Logistics Ltd. presents a potential positional trade.Key Elements:
Entry: Around ₹330.50.
Stop Loss: Around ₹307.65.
Target: Around ₹374.70 (upper range of the highlighted green box).
Pattern:
The price appears to be in a descending triangle pattern, which typically indicates consolidation with potential for a breakout. Given the price action and narrowing range, a breakout to either side could be expected.
Trade Idea:
Buy Entry around ₹330.50, if there is a breakout above the triangle.
Stop Loss should be placed just below ₹307.65.
Target is set at ₹374.70, giving a good risk-to-reward ratio if the trade moves in the anticipated direction.
Indicators:
The chart also includes Exponential Moving Averages (EMA) for periods 8, 13, and 21, which seem to be flat, indicating sideways momentum, but could signal the start of a trend after the breakout.
Notes:
Ensure to monitor volume during the breakout for confirmation. A significant increase in volume could reinforce the breakout’s credibility.
As this is a positional trade, it may take some time for the price to reach the target level.
This is just an idea based on technical analysis, and you should consider risk management and other factors before making the trade.

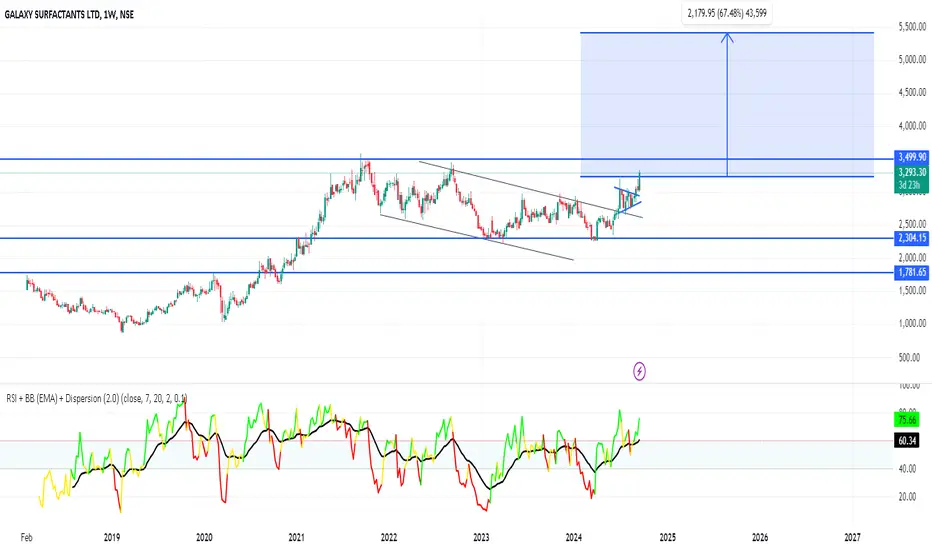
GALAXY SURFACTANTS - 70% ROI Potential Stock Mid Term Idea A Fresh stage 2 Multiyear Flag breakout move.
Why I consider this attractive ?
1) The stock has broken out of a 3 year old consolidation zone - Flag Breakout. June 2021-Aug 2024
2) The stock as compressed for 2 months at the breakout level.
3) Overhead supply is very minimal.
4) Daily has broken out of the compression at Flag Breakout level, retested and given a good breakout again, indicating solid buyers strength.
Flag targets at about 5400.
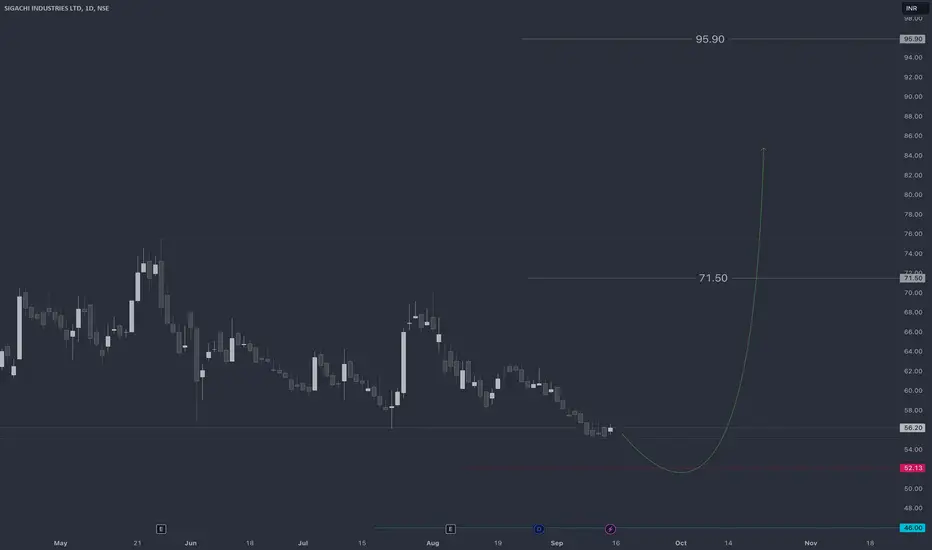
SIGACHIHi guys,
In this chart i Found a Demand Zone in SIGACHI CHART for Positional entry,
Observed these Levels based on price action and Demand & Supply.
*Don't Take any trades based on this Picture.
... because this chart is for educational purpose only not for Buy or Sell Recommendation..
Thank you
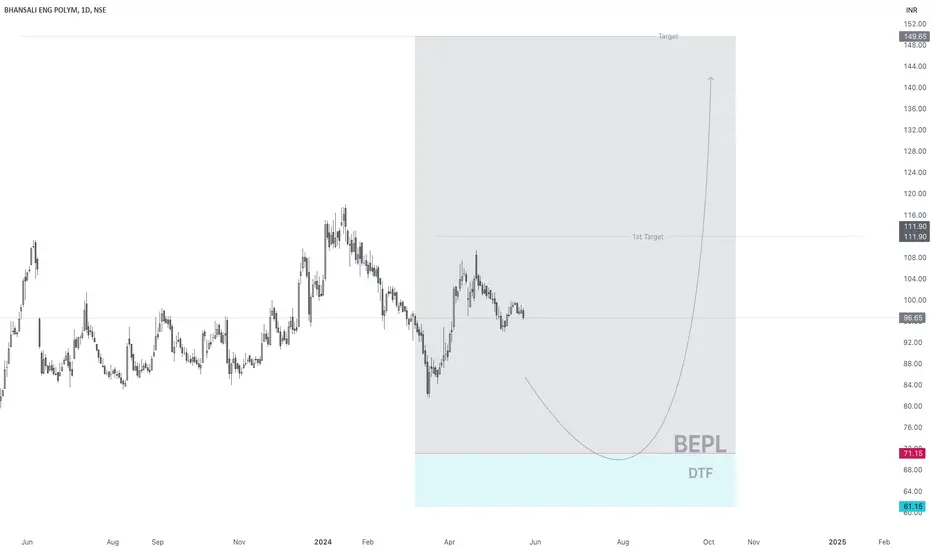
BEPL LONG ENTRYHi guys, In this chart i Found a Demand Zone in BEPL CHART for Positional entry, Observed these Levels based on price action and Demand & Supply.
*Don't Take any trades based on this Picture.
... because this chart is for educational purpose only not for Buy or Sell Recommendation..
Thank you
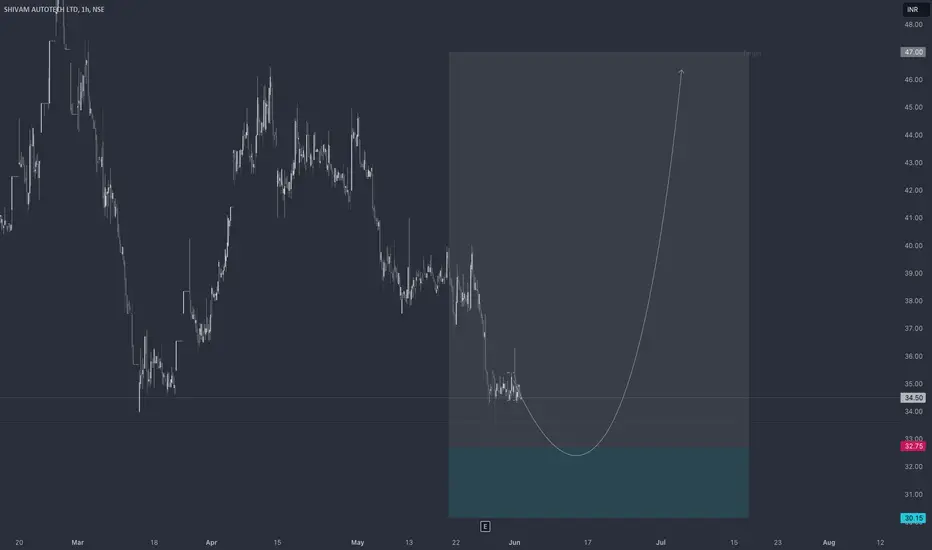
SHIVAMAUTOHi guys, In this chart i Found a Demand Zone in SHIVAMAUTO CHART for LONG entry,
Observed these Levels based on price action and Demand & Supply.
*Don't Take any trades based on this Picture.
... because this chart is for educational purpose only not for Buy or Sell Recommendation..
Thank you
VINATIORGAHi guys, In this chart i Found a Demand Zone in VINATIORGA CHART for Positional entry,
Observed these Levels based on price action and Demand & Supply.
*Don't Take any trades based on this Picture.
... because this chart is for educational purpose only not for Buy or Sell Recommendation..
Thank you

CYIENTHi guys,
In this chart i Found a Demand Zone in CYIENT CHART for Positional entry,
Observed these Levels based on price action and Demand & Supply.
*Don't Take any trades based on this Picture.
... because this chart is for educational purpose only not for Buy or Sell Recommendation..
Thank you

RAMASTEELHi guys,
In this chart i Found a Demand Zone in RAMASTEEL CHART for Positional entry,
Observed these Levels based on price action and Demand & Supply.
*Don't Take any trades based on this Picture.
... because this chart is for educational purpose only not for Buy or Sell Recommendation..
Thank you

EDELWEISSHi guys,
In this chart i Found a Demand Zone in EDELWEISS CHART for Positional entry,
Observed these Levels based on price action and Demand & Supply.
*Don't Take any trades based on this Picture.
... because this chart is for educational purpose only not for Buy or Sell Recommendation..
Thank you

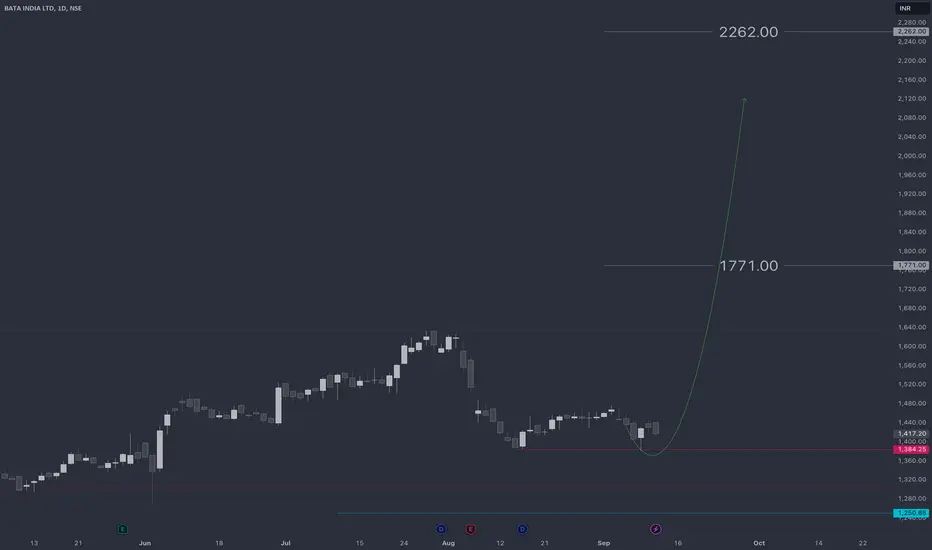
BATAINDIAHi guys,
In this chart i Found a Demand Zone in BATAINDIA CHART for Positional entry,
Observed these Levels based on price action and Demand & Supply.
*Don't Take any trades based on this Picture.
... because this chart is for educational purpose only not for Buy or Sell Recommendation..
Thank you
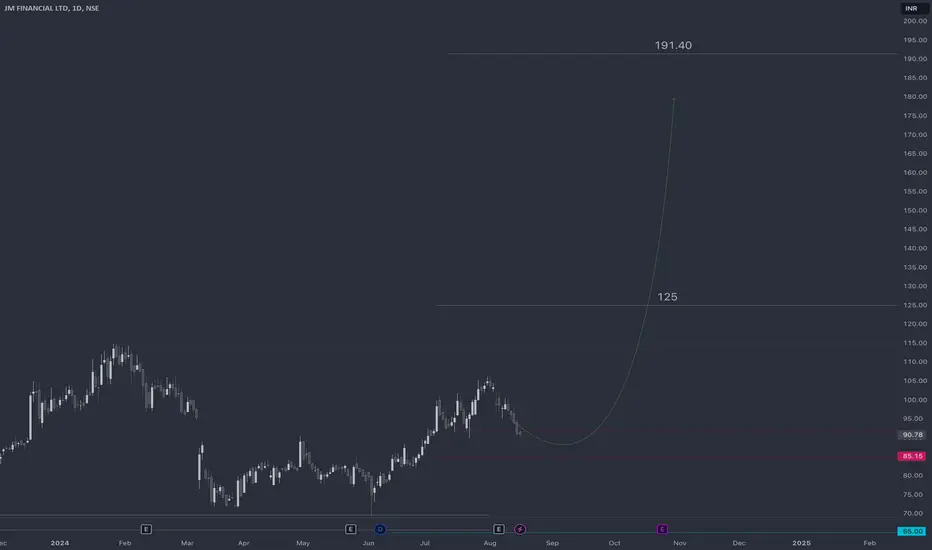
JMFINANCIALHi guys,
In this chart i Found a Demand Zone in JMFINANCIAL CHART for Positional entry,
Observed these Levels based on price action and Demand & Supply.
*Don't Take any trades based on this Picture.
... because this chart is for educational purpose only not for Buy or Sell Recommendation..
Thank you
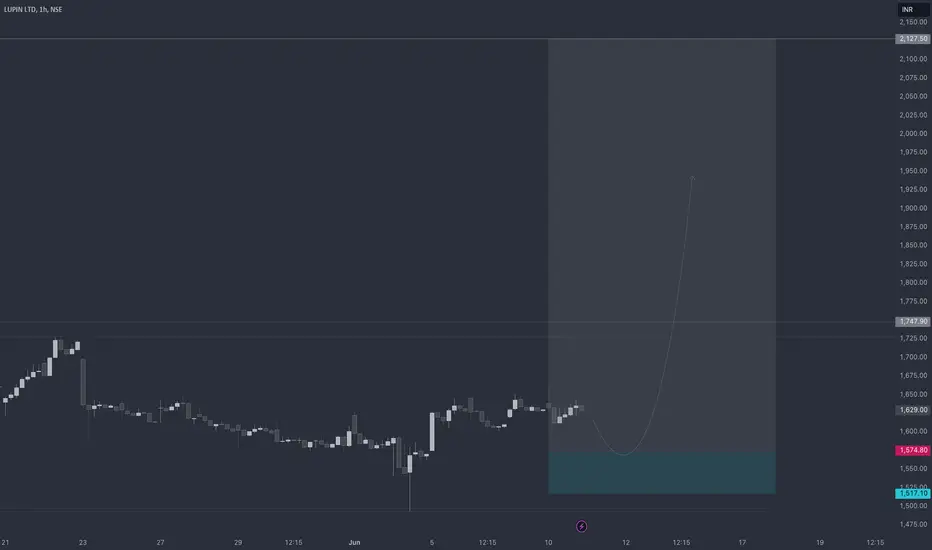
LUPINHi guys, In this chart i Found a Demand Zone in LUPIN CHART for Positional entry,
Observed these Levels based on price action and Demand & Supply.
*Don't Take any trades based on this Picture.
... because this chart is for educational purpose only not for Buy or Sell Recommendation..
Thank you
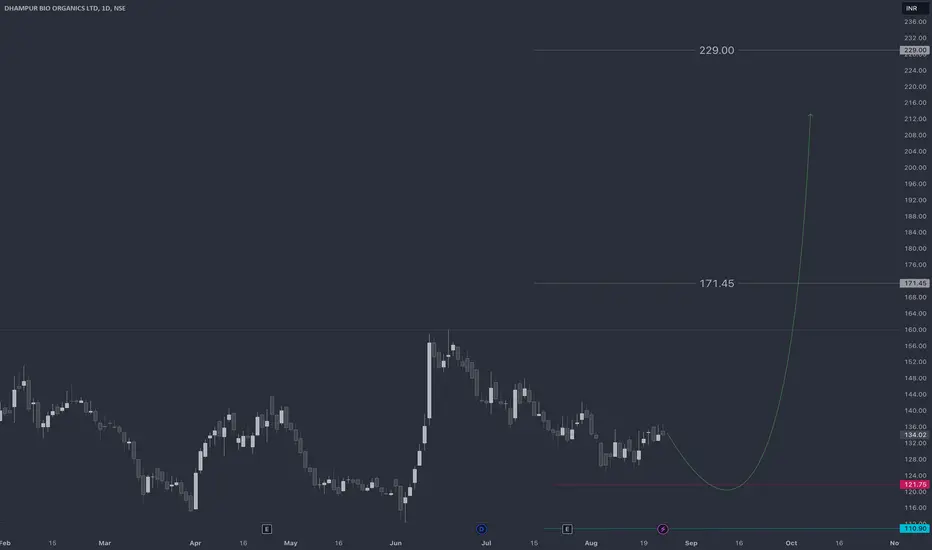
DBOLHi guys,
In this chart i Found a Demand Zone in DBOL CHART for Positional entry,
Observed these Levels based on price action and Demand & Supply.
*Don't Take any trades based on this Picture.
... because this chart is for educational purpose only not for Buy or Sell Recommendation..
Thank you
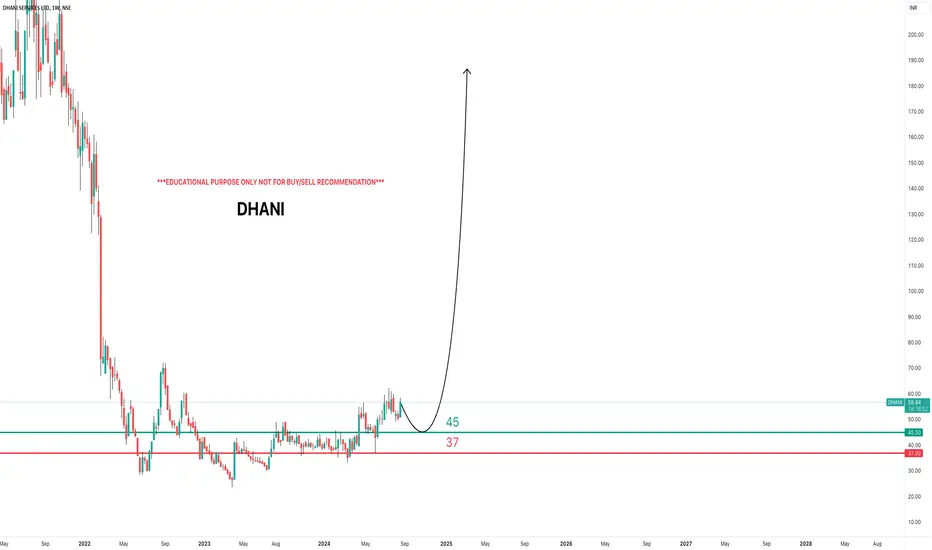
DHANIi Observed these Levels based on Price Action and Demand & Supply which is my own Concept "PENDAM CONCEPTS"... Please don't take any trades based on this chart/post... Because this chart is for educational purpose only not for Buy or Sell Recommendation... Thank Q
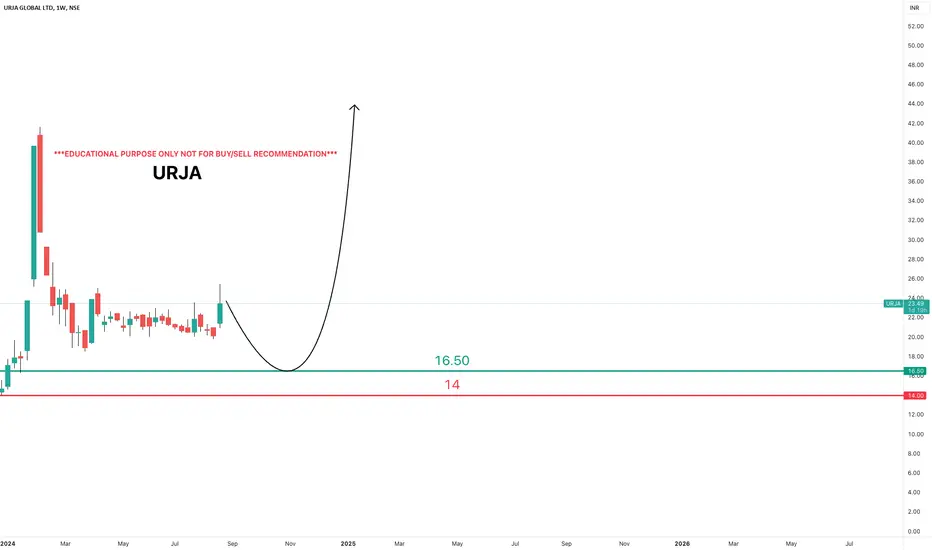
URJAi Observed these Levels based on Price Action and Demand & Supply which is my own Concept "PENDAM CONCEPTS"... Please don't take any trades based on this chart/post... Because this chart is for educational purpose only not for Buy or Sell Recommendation... Thank Q