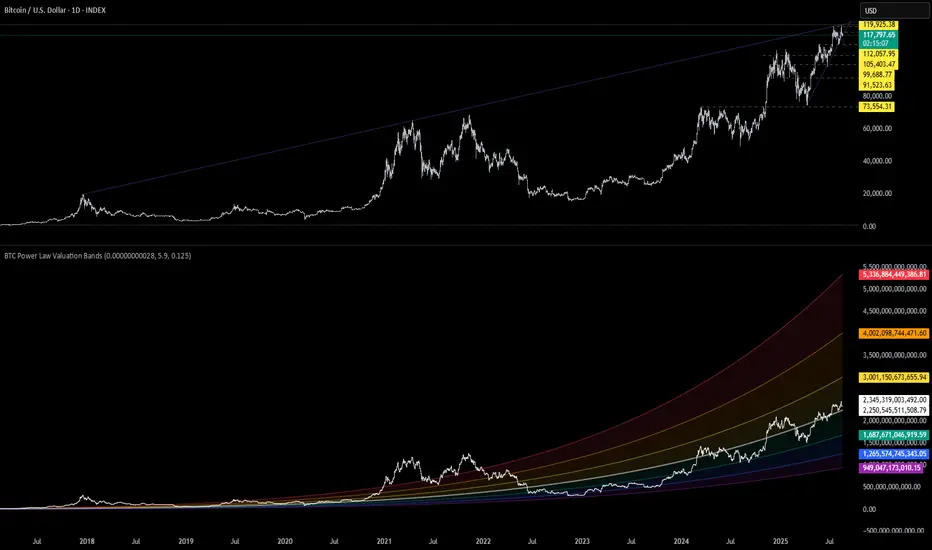
Bitcoin’s Power Law Curve — Fairly Valued With Room to RunThis chart applies a Power Law Rainbow Model to Bitcoin using a long-term logarithmic regression fitted to BTC's historical price action. Power laws are mathematical relationships often found in nature, science, and network systems — and Bitcoin is no exception.
Rather than relying on arbitrary trendlines, this model fits a curve based on the equation:
Price = a × t^b
Where:
t is the number of days since inception
a and b are constants optimized to Bitcoin's growth
Bands represent log-scaled standard deviation zones from the curve
🌈 Interpreting the Chart
The center white curve reflects Bitcoin's "fair value" according to its adoption-based trajectory.
Colored bands represent ±1σ, ±2σ, ±3σ from the model, creating a "valuation rainbow."
Historically, Bitcoin's cycle bottoms have touched the lower bands (blue/purple), while euphoria tops align with the upper bands (orange/red).
✅ Current Outlook
BTC is trading just under the fair value curve , suggesting it's fairly valued or slightly undervalued from a long-term perspective.
This position has historically preceded major upside moves, especially in post-halving environments.
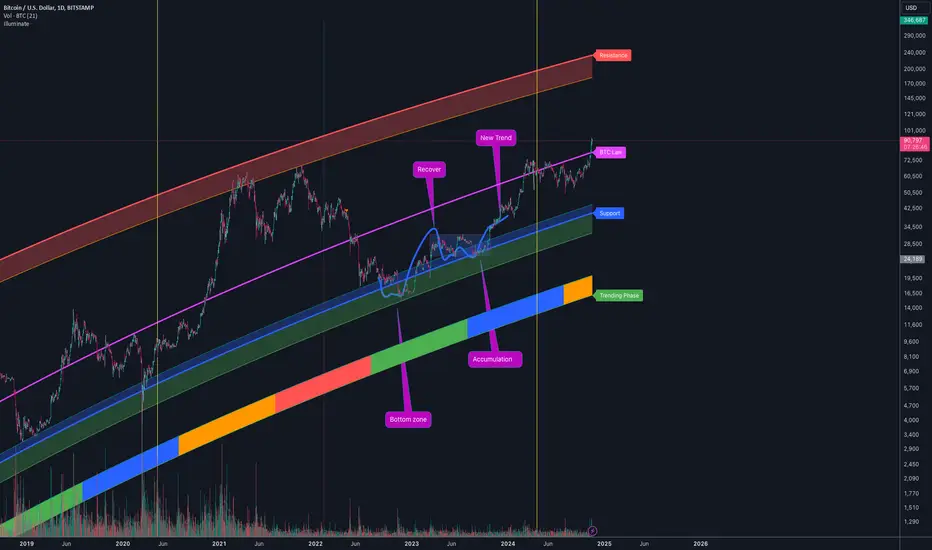
From a Smart Money Concepts angle, we're in a potential accumulation or markup phase , with institutional and informed capital likely already positioning.
🧠 Why Power Laws Work for BTC
Bitcoin adoption follows network effects — more users = more value — which naturally follows a power law.
Unlike linear trends, power law curves scale with time , making them ideal for modeling exponential assets.
They offer a more objective long-term valuation framework , avoiding emotional cycle chasing.
⚠️ Disclaimer
This is not financial advice . The model reflects historical behavior and is a tool to support long-term perspective — not short-term prediction. Always do your own research and risk management.
Powerlaw
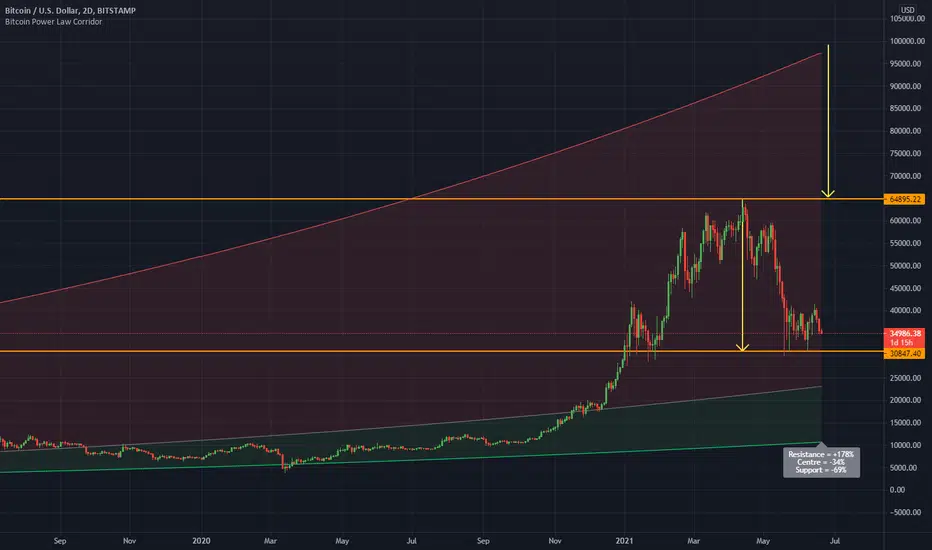
So You're Saying There Is A Chance....Bitcoin Head & Shoulders rejection target would line up with the Bitcoin Power Law Corridor resistance line at about 100k....
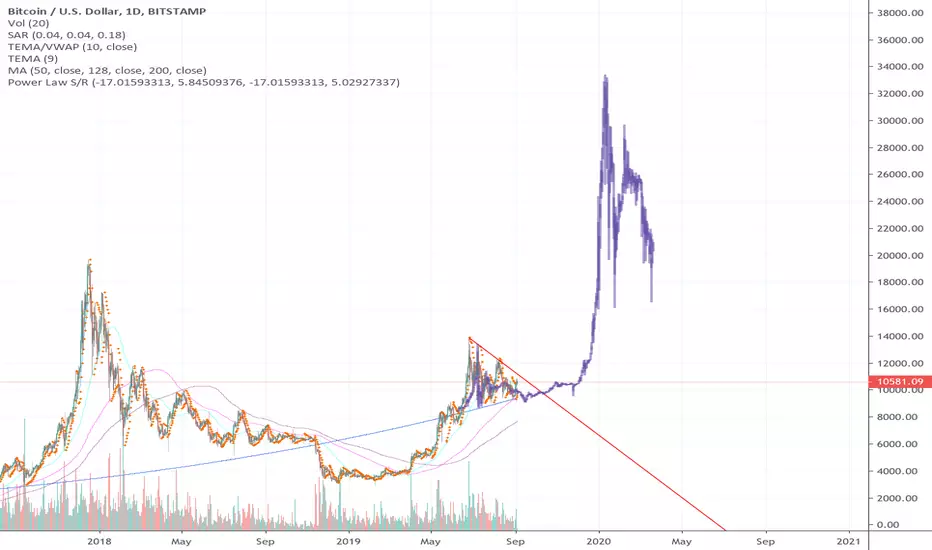
Power Law midline acts as support, like 2014?Berger's article on the Power Law Model for Bitcoin is compelling: medium.com
When you apply this to previous bull runs in Bitcoin, there are a number of times that the power law midline acts as a strong support for further rallies (both successful and unsuccessful). The one that bears the closest relation I found was the 2013-2014 rally.
What is interesting is that the drop in volume since the annual high, the resurgence the last few days, and the large wedge BTC is still inside, are all very similar to 2014. Looking at the previous rally at that time, we can expect to trade more or less sideways out of the wedge with a few attempts higher, until early 2020. This coincides with the May 2020 halvening, which is regularly followed by another ATH and the power law midline would push it above $13000. So there is some value in seeing it this way as the worst case scenario.
The power law model is the best argument I've seen so far against the Hyperwave/Consensio and other bearish predictions of a $1000 or sub $6000 price point. That is rapidly diminishing as possible unless BTC invalidates the power law model for the first time in 10 years AND flies in the face of positive macro events.
Now this may be an unpopular prediction and I am not myself holding to it either. It isn't a prediction, but more soliciting others for ideas on how they see the 2014 fractal and power law midline in relation to today's market.
I hope you all find it as interesting as I have.