Huge market deficit, speculation, and investment appealSilver is a precious metal that has long been valued for its versatility, beauty, and rarity. Its unique properties have made it an important material for both monetary and industrial uses. While silver is often overshadowed by gold in terms of investment appeal, it has its own unique investment potential that should not be overlooked. Based on the data from The Silver Institute and Metals Focus, there are several developments in this space that may make silver an attractive option for investment or speculation in the coming months.
To better understand this opportunity, it is important to be acquainted with the driving forces in the silver market. Silver is produced by mining and recycling. On the demand side, silver has a variety of uses, including in jewelry, silverware, investment, and industrial applications. In 2022, the total supply stood at 31,250 metric tonnes. Meanwhile, total demand reached 38,643 metric tonnes.
The mining activity accounted for 81.84% (25,578 metric tonnes) of the supply in 2022, with recycling contributing the remaining 18.16% (5,618 metric tonnes). Mining output dropped by approximately 1% YoY, and recycling grew by about 3% YoY.
As for the demand in 2022, industrial use accounted for 44.79% (17,309 metric tonnes), jewelry for 18.83% (7,280 metric tonnes), silverware for 5.91% (2,286 metric tonnes), photography for 2.21% (855 metric tonnes), and physical investment for 26.79% (10,356 metric tonnes); the remaining 1.47% of the demand relates to the other uses.
The investment demand for silver doubled from 4,884 metric tonnes in 2017 to 10,356 metric tonnes in 2022. Furthermore, jewelry demand fully recovered from a slump during the Covid-19 epidemic, rising from 4,680 metric tonnes in 2020 to 7,280 metric tonnes in 2022. In fact, the total demand for silver returned stronger from the 2020 disruption, resulting in the market being undersupplied by 7,393 metric tonnes in 2022.
As the World Silver Survey 2023 expects the total output to grow only by 2% in 2023, the market deficit represents an interesting dynamic that might prove to be impactful to the price of silver in the future. However, with the current weakness in the precious metals sector, we think it would be reasonable to either wait a little bit longer before entering a trade or start with very small purchases in multiple transactions (leaving more capital on the side for later). Our goal would be to get the entry closest to the $20 price tag and wait for silver to rise above $26.
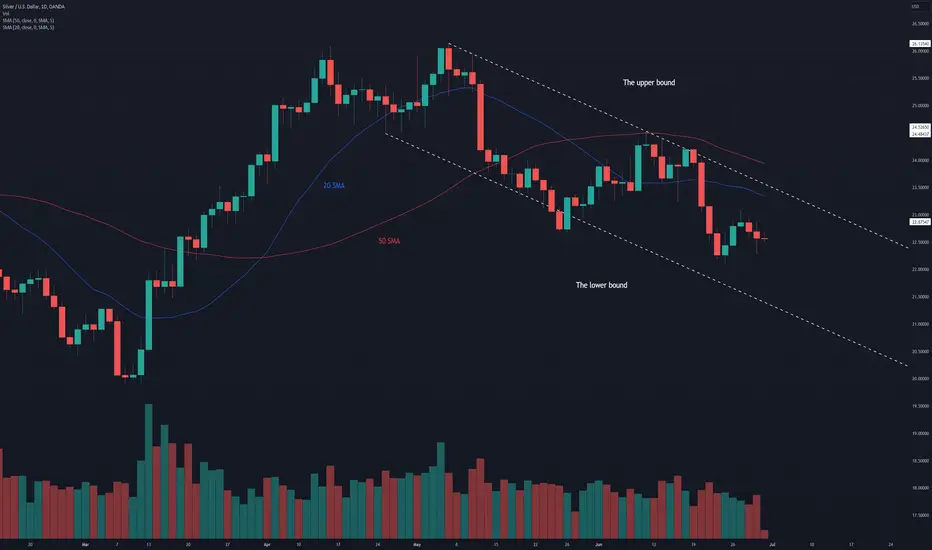
Illustration 1.01
Illustration 1.01 shows the daily chart of XAGUSD. One red arrow indicates the declining price from 5th May 2023 until yesterday; the other red arrow hints at volume, which started to decline more recently. Normally, such a relationship between the price and volume suggests that selling pressure is losing steam, and reversal can be impending.
Technical analysis
Daily = Bearish
Weekly = Bearish
Please feel free to express your ideas and thoughts in the comment section.
DISCLAIMER: This analysis is not intended to encourage any buying or selling of any particular securities. Furthermore, it should not be a basis for taking any trade action by an individual investor. Therefore, your own due diligence is highly advised before entering a trade.
Preciousmetals
✅SILVER SHORT FROM RESISTANCE🔥
✅SILVER surged again to retest the resistance at 24.87$
But it is a strong key level
So I think that there is a high chance
That we will see a bearish pullback and a move down
SHORT🔥
✅Like and subscribe to never miss a new idea!✅

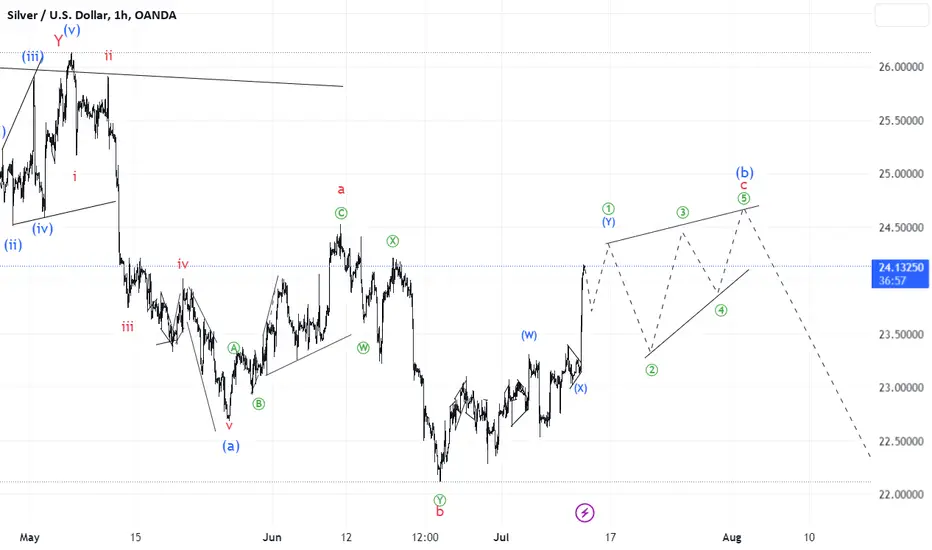
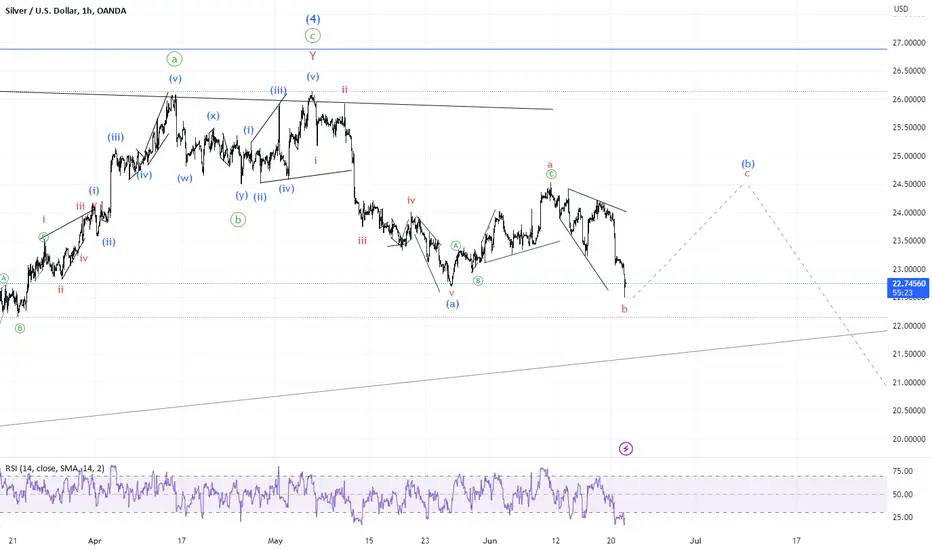
#Silver Update Just like with gold the chances are that we are in a rising wedge which is ending diagonal in wave c. Very speculative at this point though.
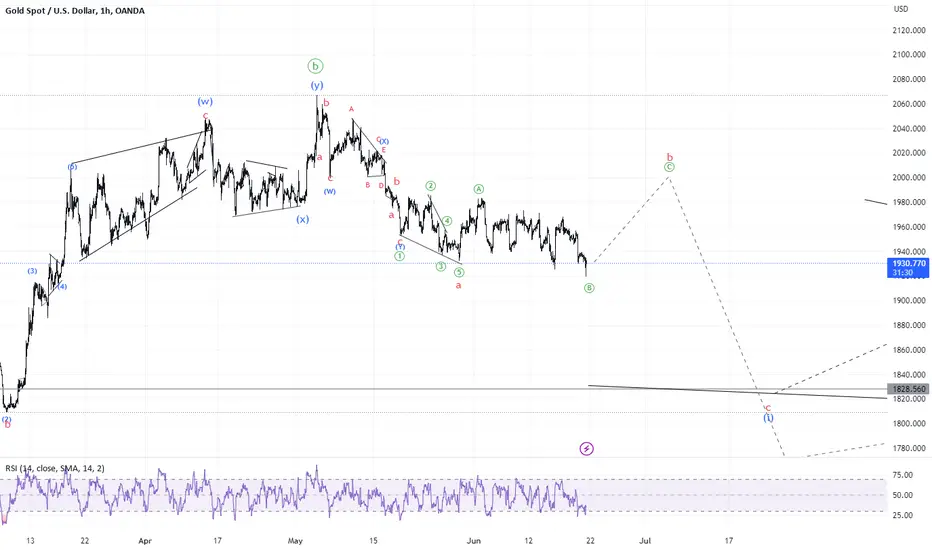
#Gold Update Given the low timeframe waves the chances are we are in a scenario with ABC flat where C is an ending diagonal

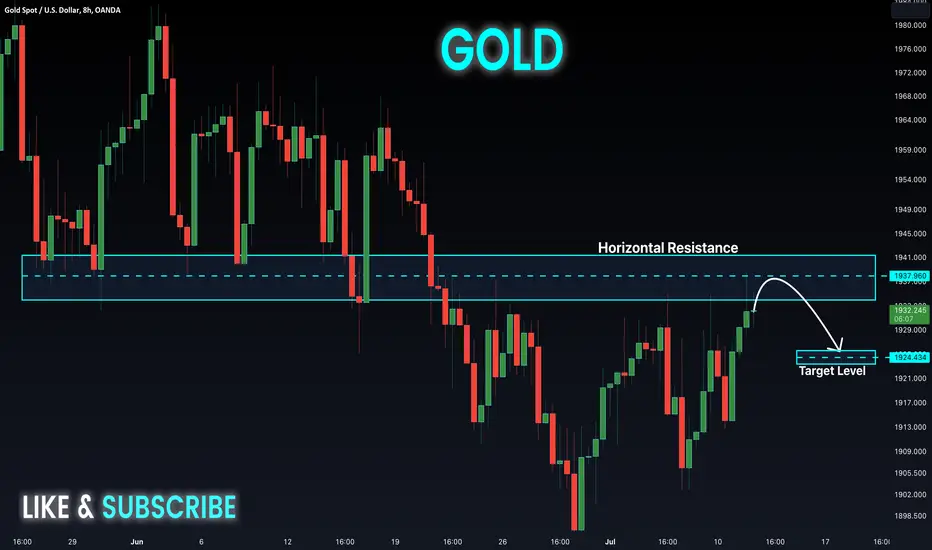
GOLD Local Short From Resistance! Sell!
Hello,Traders!
GOLD has again reached
The wide horizontal resistance
Of 1941$ so naturally we
Will be expecting a local
Pullback to the downside
Sell!
Like, comment and subscribe to help us grow!
Check out other forecasts below too!
BEFORE 1971 u could acquire 1 #Gold Oz for 10 hours of labourThe erosion of wealth via #fiat debasement is clear for you to see on this chart
With the price of gold denominated us avg salary per hour
* The BLS actually has a higher number of $32 ... but the data on that price has less historical data.
NOW it takes nearly two weeks of labour to acquire 1 oz
(pre tax and living expenses obviously)
But this chart also perilously points how painful the end of US dollar dominance could be.
Pointing to an astronomical level of over 500 hours of work to get one gold ounce.
Clearly adding #PreciousMetals to your portfolio could be one the great wealth builders in the coming years.

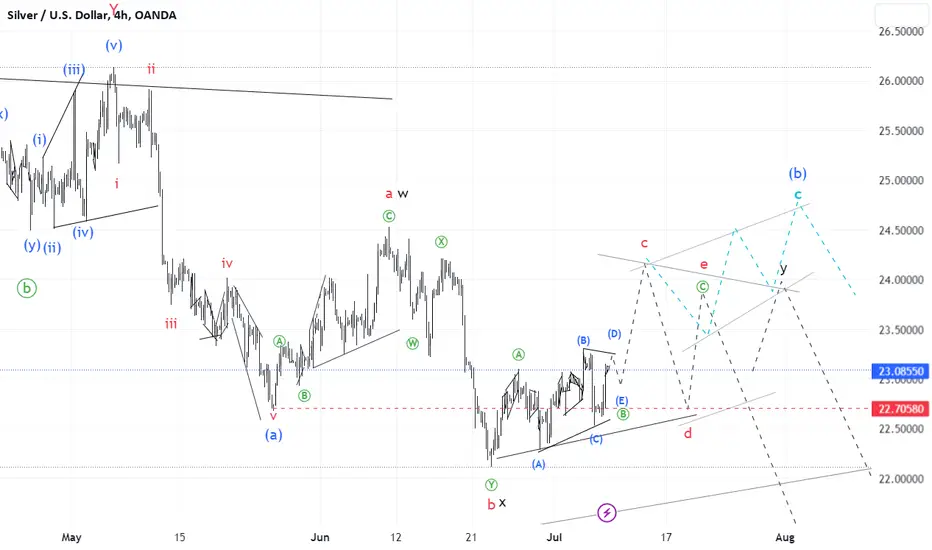
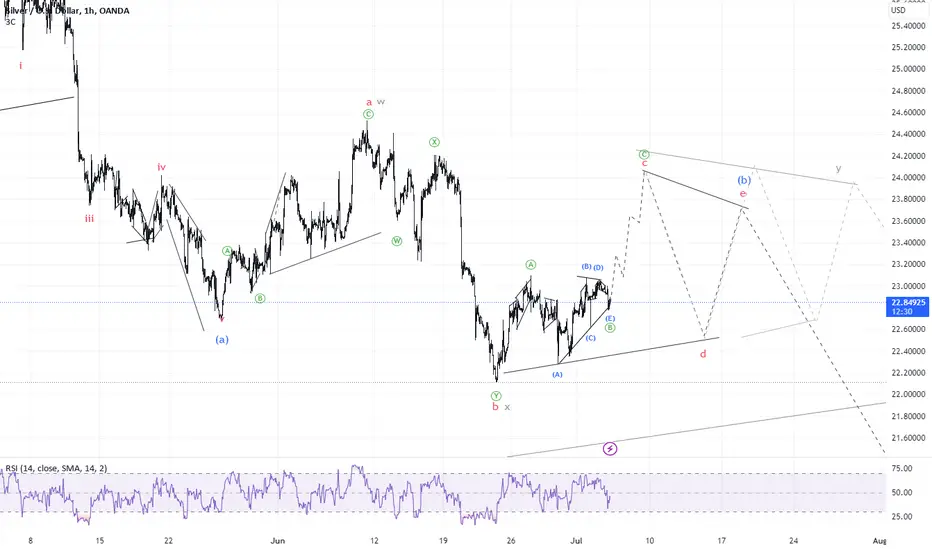
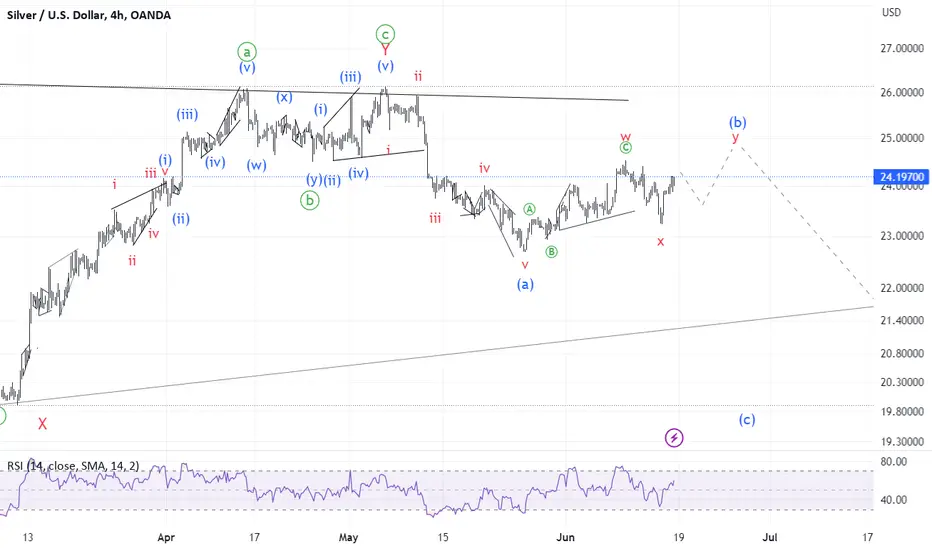
#Silver UpdateWhile Silver did not follow Gold closely, it also shaped the first two steps of the upward move within a corrective structure. Since Silver revealed what increasingly looks like an incomplete symmetrical triangle (A)(B)(C)(D)(E), I am inclined to think that the structure in the making is a bigger triangle (unlike in Gold) or a triangle as wave y. The reason - triangles consist of simple zigzags ABC. Only one complex wave is allowed - double zigzag or another nested triangle.
Another possibility is an ending diagonal or impulse wave c labelled in teal. That would nicely match the base case scenario in Gold.
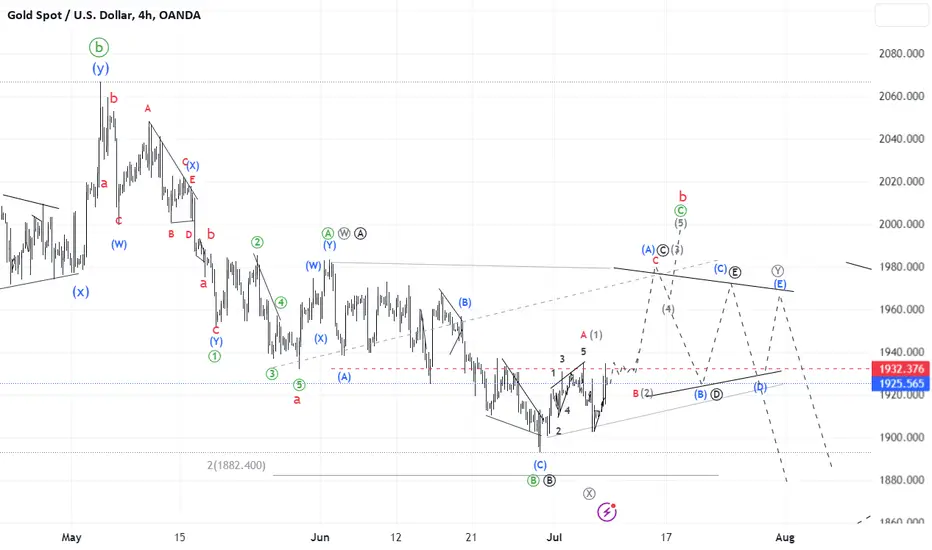
#GOLD Update In the previous week's update, I highlighted enough certainty to go long because of the ending diagonal (C) of in the chart below.
We spent the entire week creating the opening move, which I've labelled wave A or (1) below. There is no preferred structure at this moment, and the complexity of the scenarios should remain on the chart. However, I can somewhat discount the larger running triangle labelled in black circles ABCDE. Given that wave is a clear (W)(X)(Y), and wave is nearly 2x of , the running triangle is less likely but not ruled out.
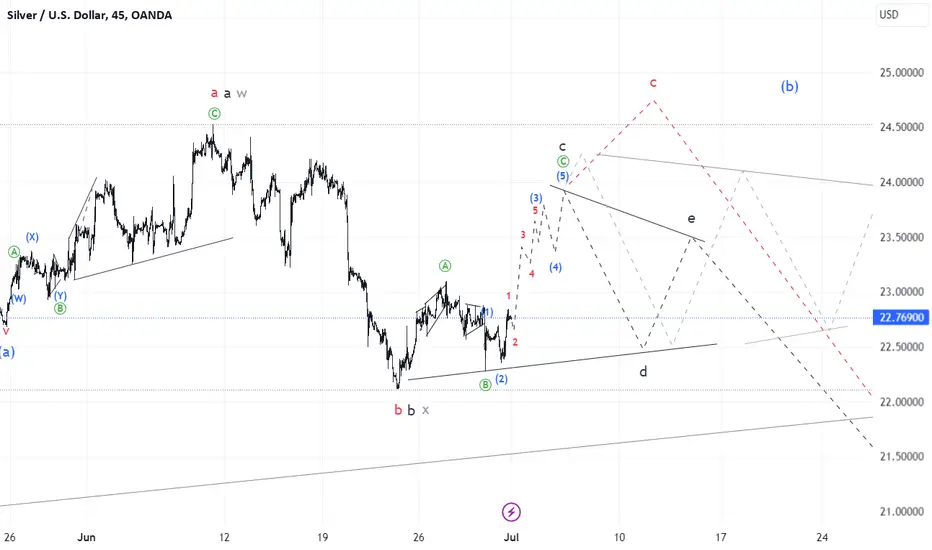
#Silver XAGUSD Update Okay, it appears that we can exclude the abc flat scenario (since the price formed what appears to be a symmetrical triangle) and maintain the bigger triangle and wxy combo as wave (b) options.
#Litecoin Part 2 -- explosive move versus #silverWe have an upside #HVF for #LTC against #Si !!!
Watch this video to see what that ratio could be!
At some point we will see a precious metals bull market return with a fury
will investors favour the #digital #commodity instead?

#Silver Update #XAGUSD Silver has followed the scenario framework. So far there is no reason to drop any of the options. I am expecting a minor correction and then a surge in prices to $24
Local Bottom In #Gold #XAUUSD It seems that gold has has just made a local bottom! I maintain a couple of scenarios at this point.

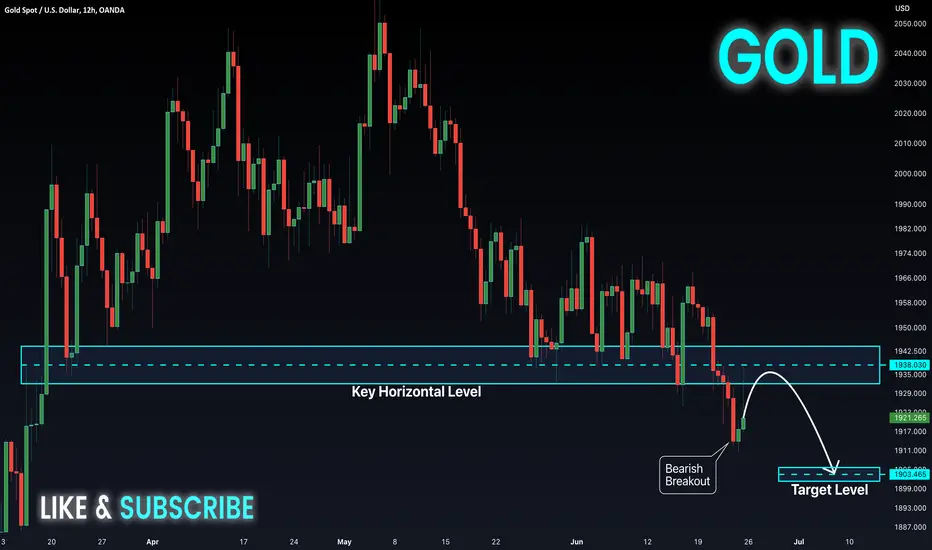
GOLD Strong Bearish Breakout! Sell!
Hello,Traders!
GOLD is now making
A pullback to retest
The broken key horizontal
Level of 1942 which is
Now a resistance so
As we are bearish biased
A further move down
Is to be expected
After the retest
Sell!
Like, comment and subscribe to help us grow!
Check out other forecasts below too!
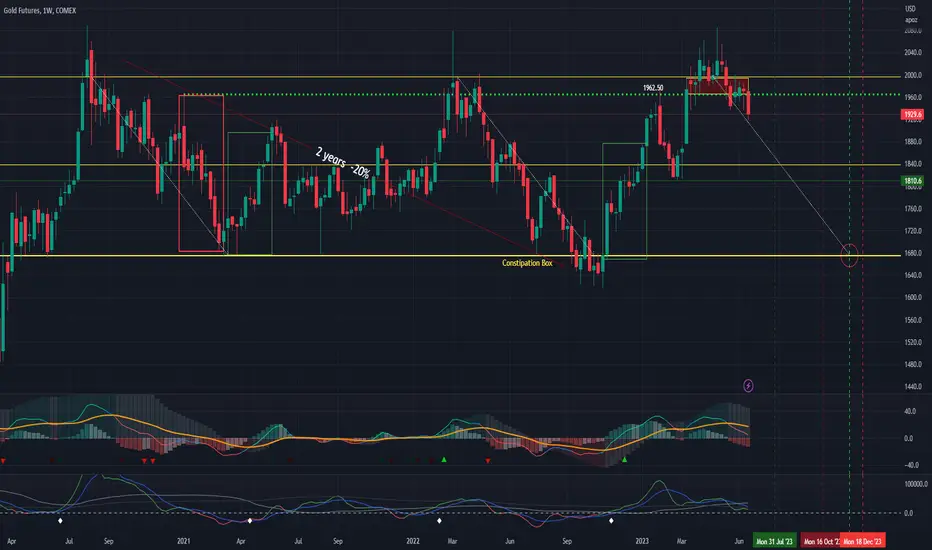
The Gold Odyssey - Here we go again!Someone mentioned to me that Gold is an asset that never loses money. I took the effort to show previously that Gold can very well do a 20% drop over a slow bleed (months) before it travels back up months later too. I also warned that Gold appears not to be able to keep properly and well above 2000-2080. Since 2020 (the Gold Odyssey series started in 2019), there is a multiyear consolidation range between 1650 to 2050, roughly.
Having pointed all that out, it appears that Gold had given up the cling to 2000. Here is why:
1. There are lower lows and lower highs (clearer in Daily chart);
2. a clear breakdown of small consolidation range at 1960 support;
3. Technical indicators MACD and VolDiv have crossed under their lagging signal lines; and
4. The TDST (Green dotted line) was broken out of and with long upper tailed candlesticks reversed back to break down of that TDST. When prices are above, the primary trend is bullish. Now it reverted back to a bearish primary trend. (This is part of TD Sequential rules).
Given the above, we can project that the most likely trajectory in the following months is down to 1680 (4Q2023), in a repeated pattern, for the third time, since 2020. There should be a stalling consolidation about 1800 too, so expect that.
Now, for this to happen, a few fundamental things need to align...
a. the USD should be rallying hard upwards;
b. the interest rates should be rising too;
c. inflation moderates; and
d. Possibly in alignment, can expect the equity markets to be bearish.
Heads up and take care!
ps. some dates projecting forward are marked. :)
Update on #Silver #XAGUSDSame as gold. Silver appears to be bouncing in wave c of abc flat. Not a trading signal at this point.
Update on #Gold #XAUUSD Despite heavy selling I think there is a good chance of a bounce in ABC flat. Once ABC is complete this would be the moment to consider shorts.
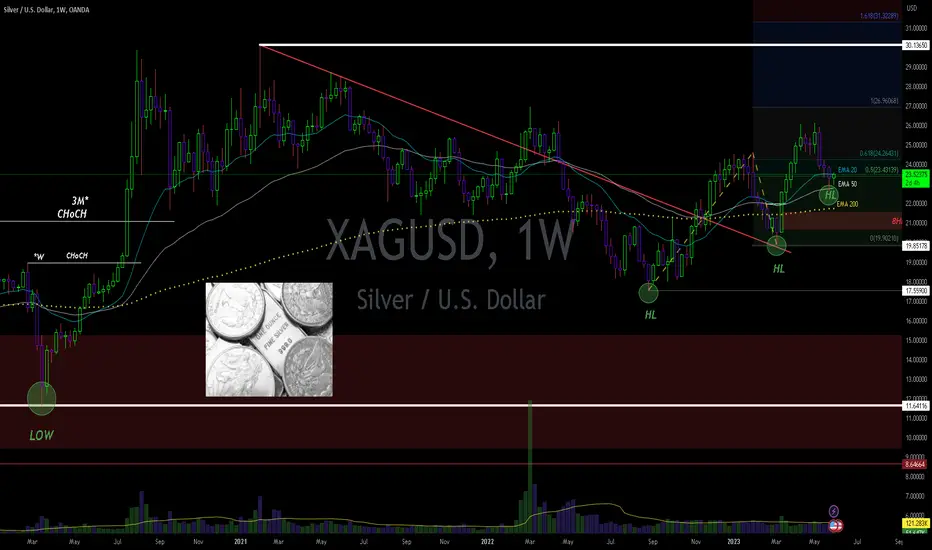
$XAG -Weekly Uptrend Outlook- Silver has been suffering for a while, correcting in it's Price Action.
Uptrending from August 2022, it has done printing
a Bullish EMA's Crossovers of Mini(20&50EMA) and Major 50&200 EMA;
post trendline resistance break-out
and re-testing it as successful support before aiming higher
Currently it has found a small support base stuck between 20 & 50 EMA on the
Weekly, while worth noting is that it has lost the Golden Zone of
Trend Fibbonnaci Retracement taken from the Lows of August 2022 .
Lower supports on *W is 200EMA and just below it a big Order Block found in
8Hrs (tf).
A negative downtrend would be established by losing grip of that 200EMA and
8hrs OB,
as well the loss of 0 fibb retracement at 19.85$ as a Change of Character
Important Candlestick being printed this Week (2 days; 4hr to close)
TRADE SAFE !
*** Note that this is not Financial Advice !
Please do your own research and consult your own Financial Advisor
before participating on any kind of trading acitivity based alone in this
idea.
$DXY - Bull Flag *12Hr TVC:DXY - 12Hr* Bull Flag
- TVC:DXY Bull Flag post break-out still valid and in play until Price Action nullifies it.
Breaking the Bull Flag (in green) and the Resistance Trendline (in red) coming from 114 Highs
will confirm another Macro Higher Low in $DXY.
(in play would be the macro wave C putting The Dollar Index at 96)
LH confirmation would give the other Financial Markets sectors room to explode headed to the upside,
stronger then we've seen so far for the year.
TRADE SAFE
*** NOTE that this is not Financial Advice !
Please do your own research and consult your Financial Advisor
before partaking on any trading activity based solely on this Idea .

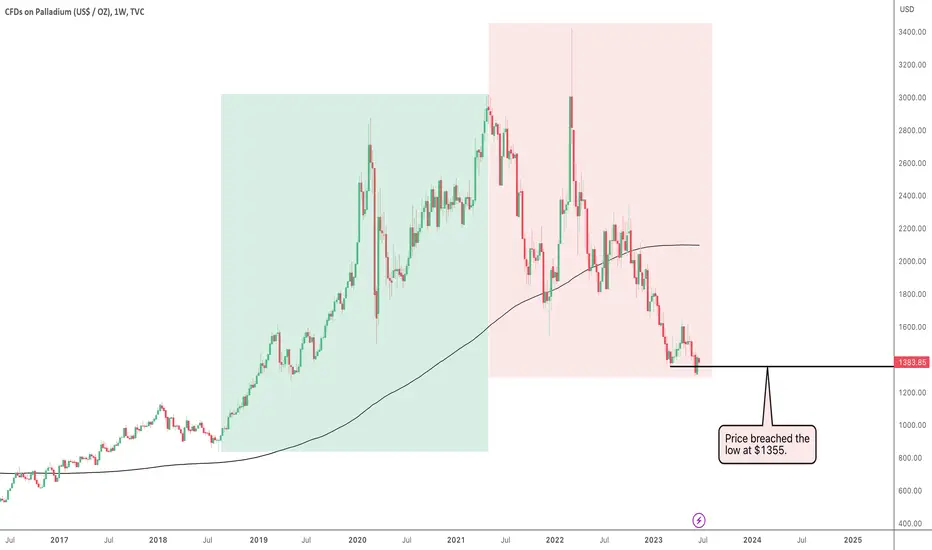
Will Palladium Slide Down To $1000?Palladium, which hit an all-time high of $3433 in March 2022, has since experienced a major downturn, plunging below the $3000 support level and losing 34% of its peak value by the end of that month.
The downward trend persisted throughout 2022, breaching the critical $2000 level in October.
A significant bearish move in February 2023 further pushed the price below the $1543 support level from December 2021, turning it into a formidable resistance level.
This has led to a further drop to a four-year low of $1305.
Now, with a total decline of over 58% from its all-time high, palladium may continue to fall towards the $1000 mark unless buying sentiment changes.
If you enjoyed this post, make sure to like, and follow for more quality content!
If you have any questions or comments, comment below. We reply to every comment!
See below for more information on our trading techniques.
As always, keep it simple, keep it Sublime.
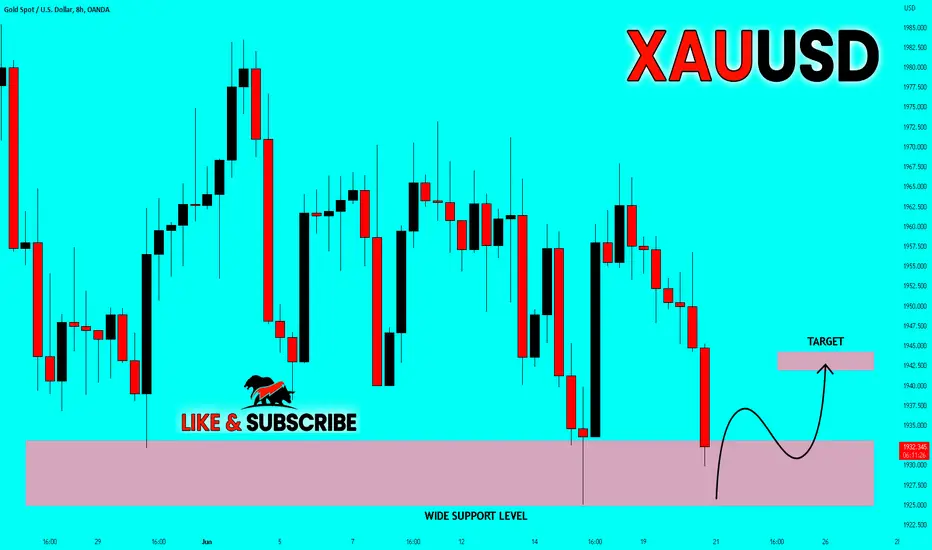
✅GOLD RETESTING WIDE SUPPORT|LONG🚀
✅GOLD will soon retest a key support level of around 1927$
So I think that the pair will make a rebound
And go up to retest the supply level above at 1941$
LONG🚀
✅Like and subscribe to never miss a new idea!✅
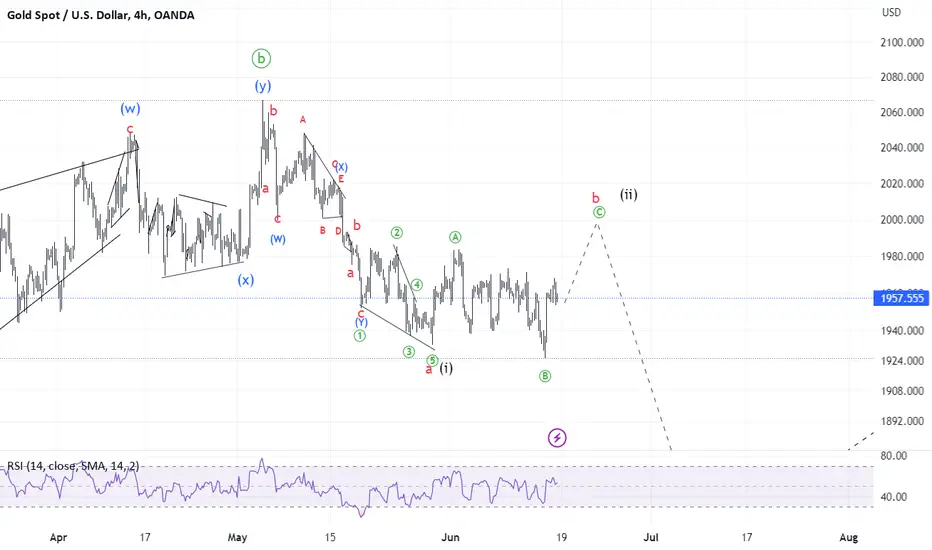
#XAUUSD Update #Gold The correction is far from complete. The chart below indicates a scenario with flat which, however, is easily interchangeable with a more complex wxy combination going sideways.
The bigger picture remains unchanged since the last update on May 27. While I agree with gold bulls that the trend is up, I still see the next 6-8 months as extremely challenging for stocks, energy and precious metals. Perhaps, this is due to the coming liquidity squeeze. Below I indicated two possible scenarios of expected decline.
#XAGUSD Update #SilverI expect the correction to continue just as with gold. Keep in mind the big picture.
#GOLD miner to 5XI see $3.85 to $5 dollars on the roadmap for this beaten #Miner
Much like in #Crypto the miners lag the underlying commodity
UNTIL a high range has been established
then the speculative fervour starts to filter through into these low cap gems.
