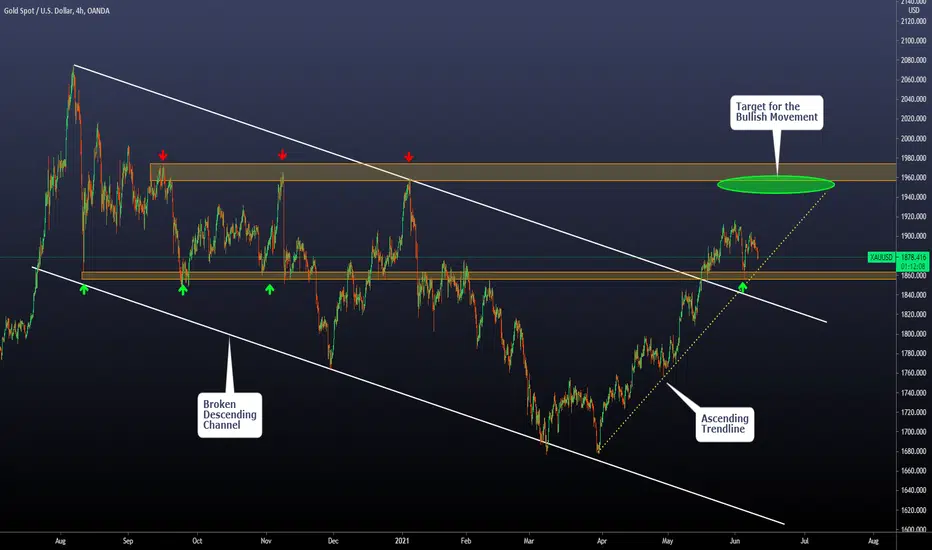
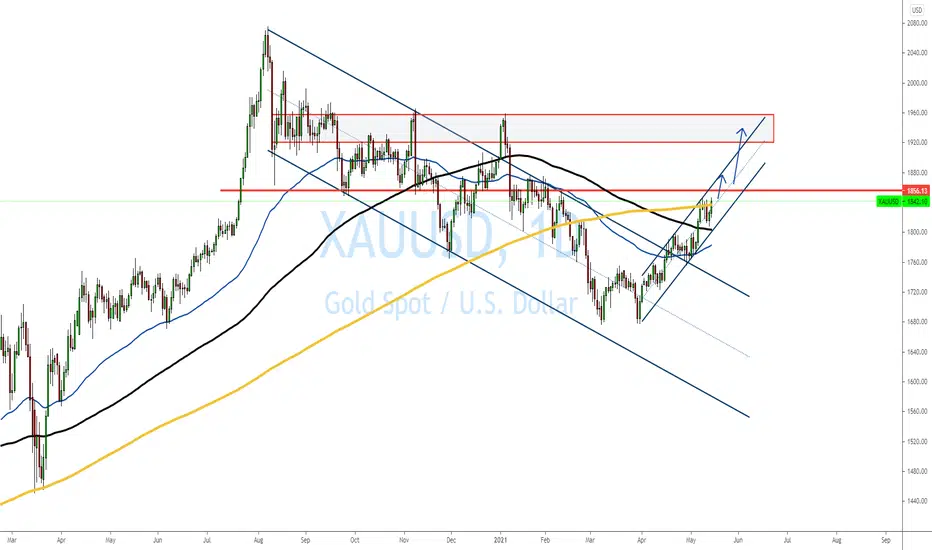
XAUUSD the target we are aiming for. Today, we will share with you a 4hs chart on XAUUSD
- In April, we opened long positions on the precious metal, and after two months, we are close to our expected target
- As you can see, after the breakout of the descending channel, we observed a straight bullish movement with an ascending trendline as the main structure of the current situation.
- Currently, we are observing a consolidation situation on the price after breaking a key resistance zone now working as support (1850 - 1860). We expect the price to stay above that level (otherwise, we will start thinking that our view is not going as expected)
- Regarding the long-term view we have on XAUUSD. If we look at a daily chart or weekly chart, we can see that the descending channel is actually a Flag pattern of a huge impulse. And we think the bullish trend will continue in the future, making new ATH. However, we also expect a several weeks correction on the next resistance zone (where we are planning to close our entry)
- Let's finish this post with the core idea. "The Target": We will be closing 100% of our position on the Green circle, we don't want to trade exactly on the edge of the resistance zone, and we rather sacrifice some pips and gain security on the target of our position.
- It would not be crazy to observe an apparent breakout of the resistance zone, giving the impression that the price will keep going up; however, based on the study we made of previous situations like this one, we think a correction in that zone has a high probability.
Thanks for reading!
Preciousmetals

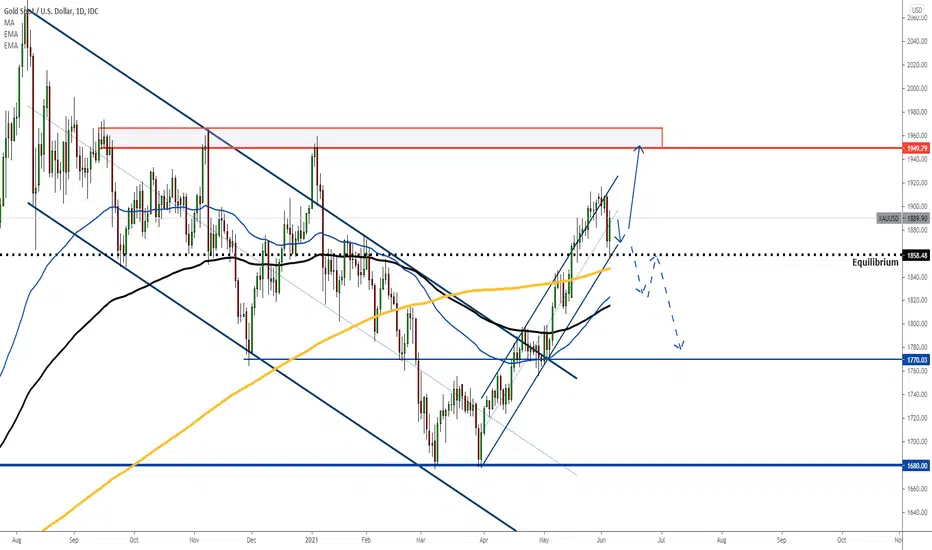
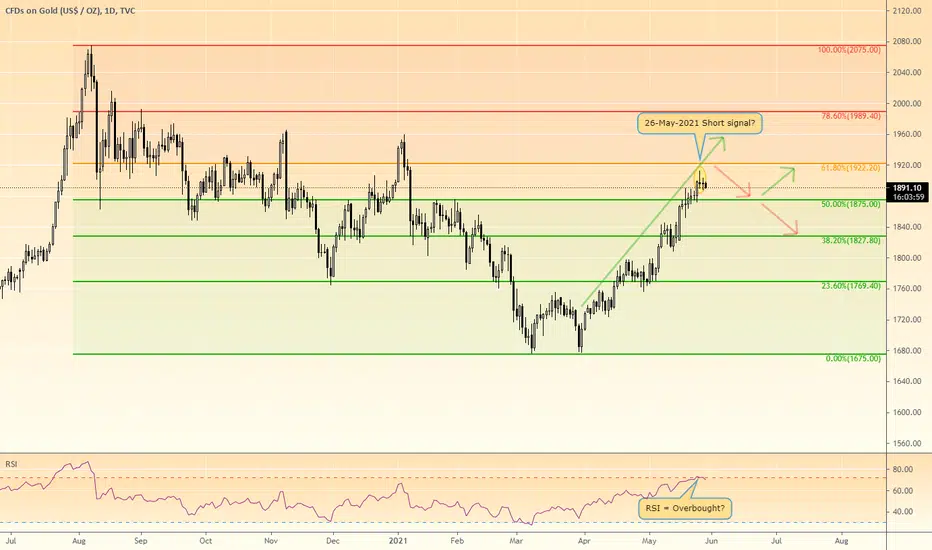
Gold: Weekly Forecast 20210606The gold closed with a bearish weekly candle for the first time in 5 weeks amid a weakening dollar due to a weaker US labour market.
The price was able to find support at the current equilibrium level and recovered quickly before the week ended.
However, it was resisted at 61.8% of the Fibo level based on the most recent bearish wave which could potentially cause another short-term sell.
This week, we could look for a selling opportunity from the current price of 1890 and target 1873 at the beginning.
But going forward, since we are still seeing support from both the equilibrium level and the bottom of the 2-month rising channel, we will continue to buy the pullback as soon as 1883, followed by 1873.
GOLDGold is trading at a key resistance. We shouldn't be surprised to see prices dropping lower from here
Gold: Weekly Forecast 20210530Gold was pretty much as bullish as expected, resulting in the biggest monthly gain in 10 months.
The gold continued to prove its value in times of uncertainty and rising inflation, coupled with falling asset prices, causing higher demand for the safe-haven assets.
We continue to see the gold pushing higher towards 1950 before any strong selling may occur.
This week, we shall continue to look for buying opportunities. Should the price pulls back at first, we can look to buy at 1880, followed by 1863.

GDX : RESET / POSITION TRADE / HEDGEDuring the last three-month trading period, the VanEck Vectors Gold Miners ETF (GDX) has generated net inflows of 731.35 million. More importantly, we can see that the greatest selling pressures emerged after the Pfizer vaccine news was released on November 9th.
This suggests that the market is simply undergoing a temporary reaction to a news event and that further downside in GDX seems unlikely because any additional vaccine announcements would probably do little to change the underlying environment.
Moving out to an even longer-term view, we can see further evidence that these assertions are accurate because the VanEck Vectors Gold Miners ETF has actually generated net inflows of 2.37 billion during the last three years.
All together, these trend divergences tell us that investors might have an opportunity to profit from recent paradigm shifts in the precious metals markets. While this short-term enthusiasm might be moderately favorable for U.S. stock benchmarks into the end of 2020, we think that the prospects for economic deterioration during the first-quarter period of 2021 might be enough to send investors right back into safe-haven assets.
Ultimately, the VanEck Vectors Gold Miners ETF provides an alternative strategy for investors that are interested in moving deeper into the precious metals sector and its expense ratio of 0.52% remains near the middle of the range for the category as a whole.
SOURCE : INCOME GENERATOR, THE INCOME MACHINE / SEEKING ALPHA
seekingalpha.com

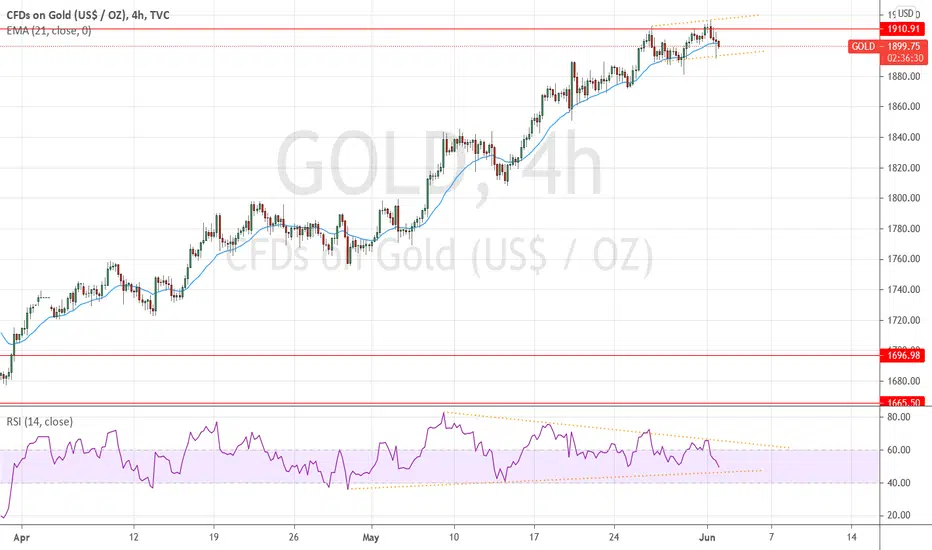
2021-05-28 Possible Gold correction (Daily Chart)Looks like a Short Japanese pin-bar has formed on Wed the 26th of May and the RSI may look overbought.
Possibilities:
- Gold upward move continues then it could rise toward 1989,
- Go sideways between 1875-1922 support & resistance.
- Further Down Correction between 1872-1875 support & resistance.
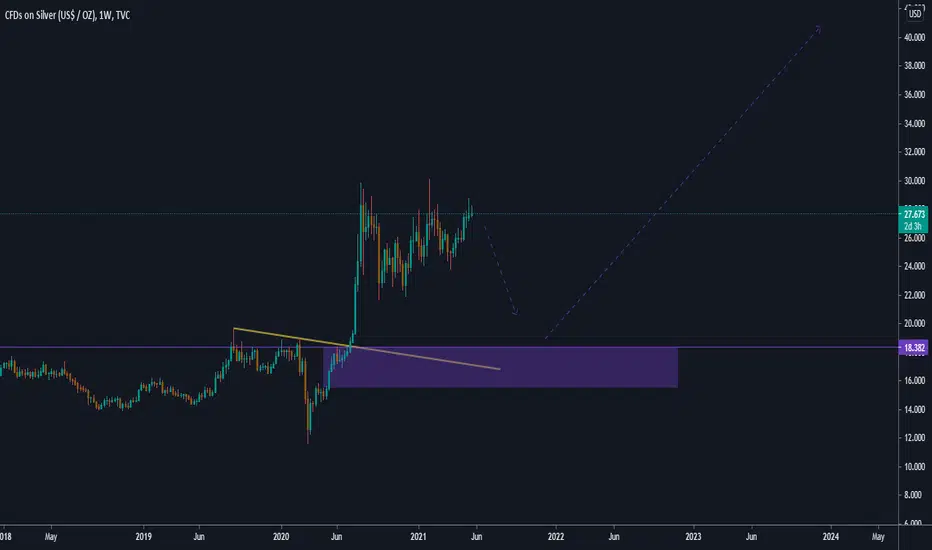
SILVER TO RE-TEST $16-$18 DEMAND ZONE BEFORE CONTINUATION HIGHERHello investors and traders!
We should see significant drop in silver prices relatively soon. Expect 30-40% drop towards demand zone $16-$18.
Weekly support is at $18.38.
Long term investors should be looking to accumulate as much as possible in purple-ish region.
Take care! This is not financial advice.
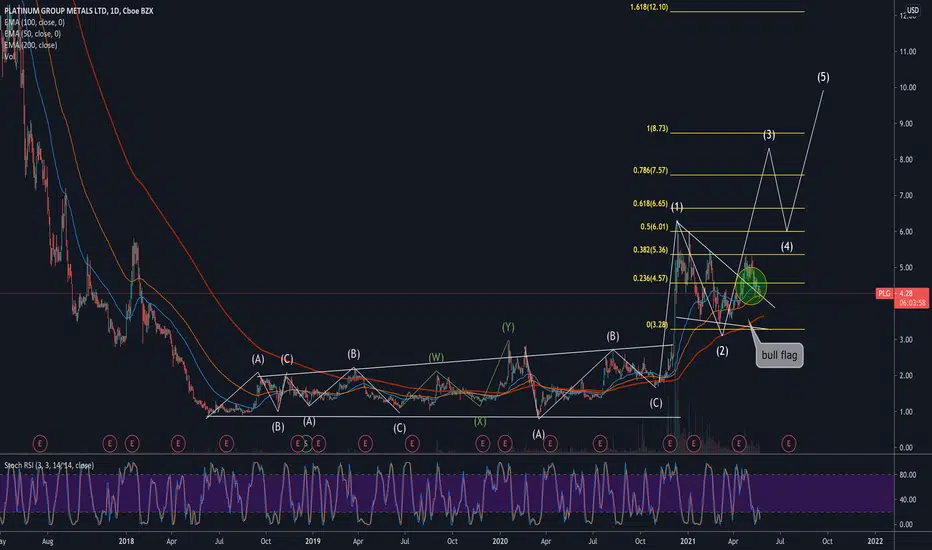
PLGUnless this bull flag top TL does not continue to support the PA I will venture to say PLG is leaving a very long boring bear market.
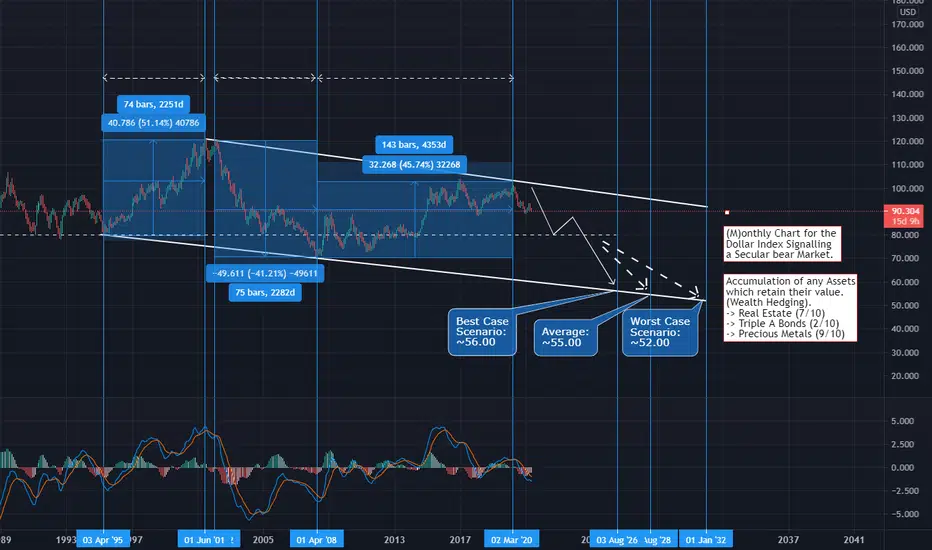
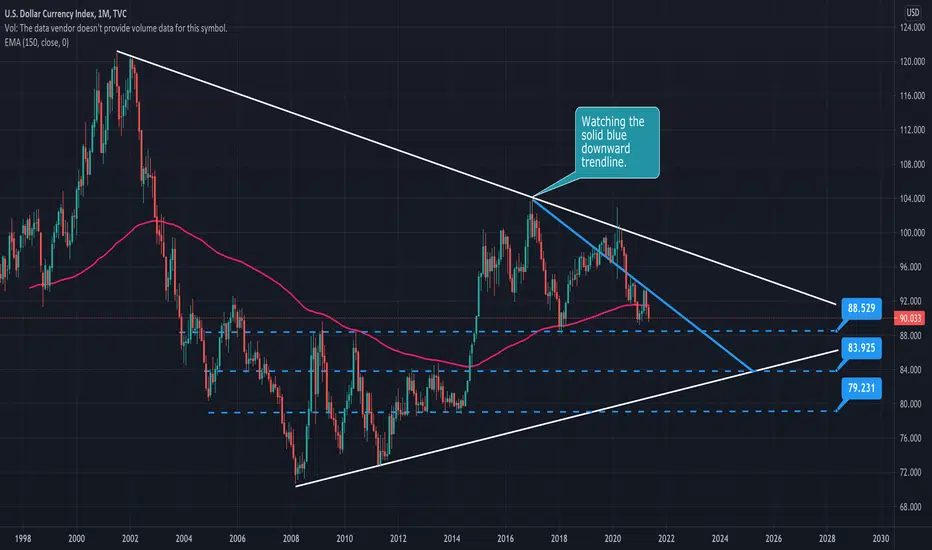
DXY has been looking weak. Here's my long term chart.I'm watching the solid blue downward trendline closely. DXY looks sick; if it breaks, lookout, commodities to the moon!
#gold vs #FED #M2 ... a wall of #dollars should Push #metals UPPLENTY of ROOM to the upside measure Money stock

#gold met the upper channel, and broke I take @ #GDX #GDXJ #AG #wpm
#fsm
MINERS LOOK GREAT!!!
time to rock & roll

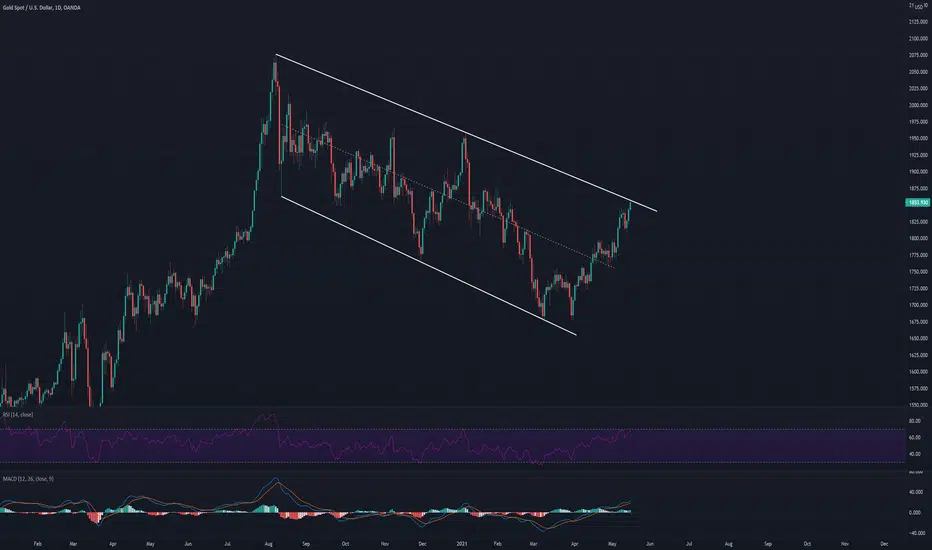
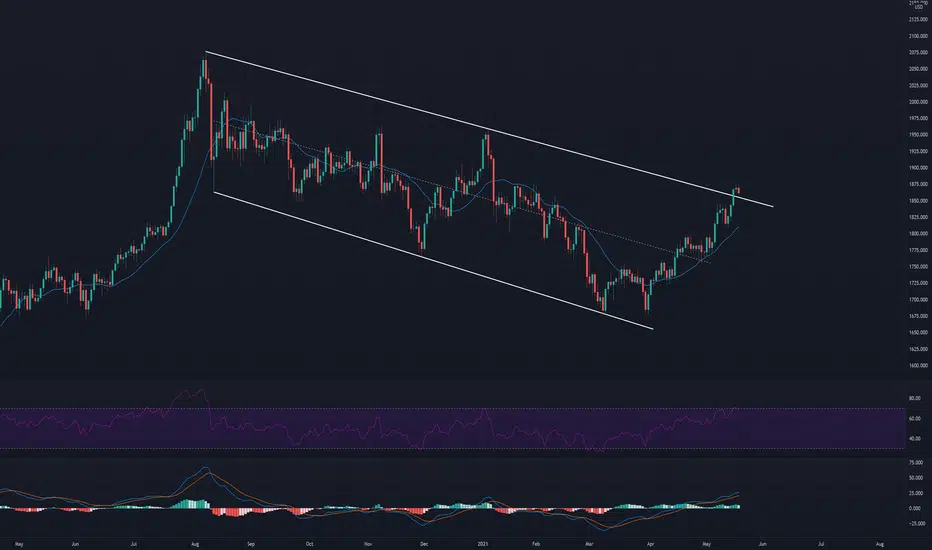
Gold Channeling Out of Another ChannelGold has been rising within a 1.5-month rising channel and the top of the channel was somewhat breached earlier this week.
However, gold struggled to make another jump as it was actually resisted at the top of another rising channel that's channeling out of the 1.5-month channel.
By now, it is obvious that the gold is currently in the process of consolidation, and based on what we've seen, it is very likely that the price will take a little dive before it shoots back up just like a person diving into the bottom of a pool and resurfaces.
We can still consider buying some on every pullback but we now target 1856 as the best price to buy.

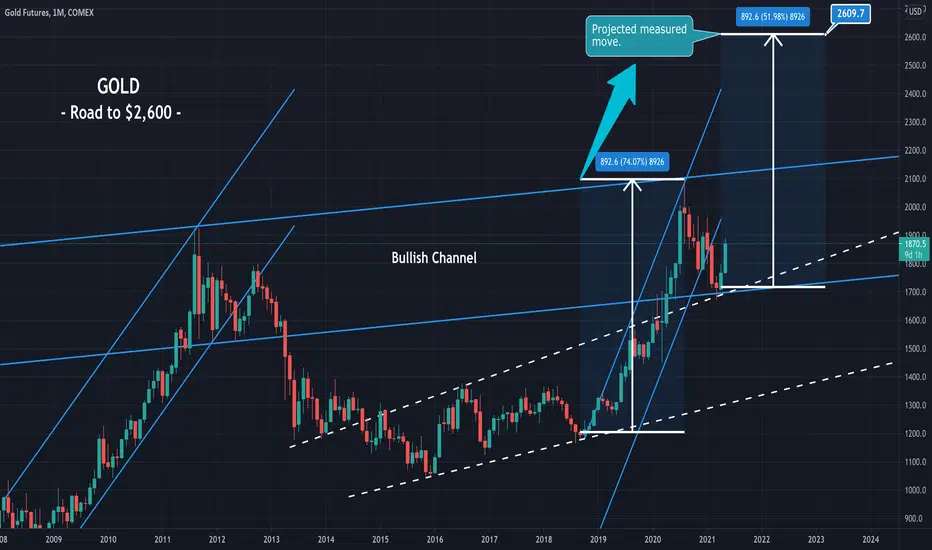
My revised (corrected) Gold monthly chart to $2,600+I apologize for my previous chart. I failed to catch the error in time prior to publishing. Here's a revised chart for reference. As all charts, it's a work-in-progress :)
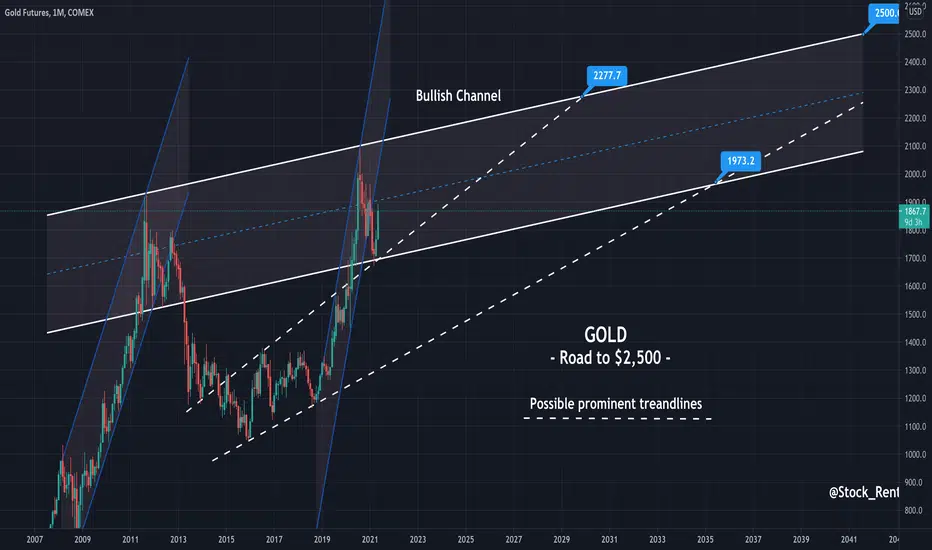
Gold - Road to $2500Here's a new take on the massive bowl everyone has been keeping an eye on. I'll be looking at the Bullish Channel for clues on Gold's path to $2,500+.
Technical analysis update: XAUUSD (19th May 2021)Our previous price target of 1875 USD was reached. Because of that we would like to update our thoughts on next price action for gold. Gold climbed up approximately 12% in last 72 days. We think gold reached its temporary top as we think its currently overvalued and ready for correction. Temporary bearish case is supported by price being too far away from its 20-day SMA and by temporary peak in RSI. However, we expect bullish trend of higher degree to remain intact. Currently, we do not dare to give you any price target for gold as we deem it hard to estimate extent of correction.
Disclaimer: This analysis is not intended to encourage buying or selling of any particular securities. Furthermore, it should not serve as basis for taking any trade action by individual investor. Your own due dilligence is highly advised before entering trade.
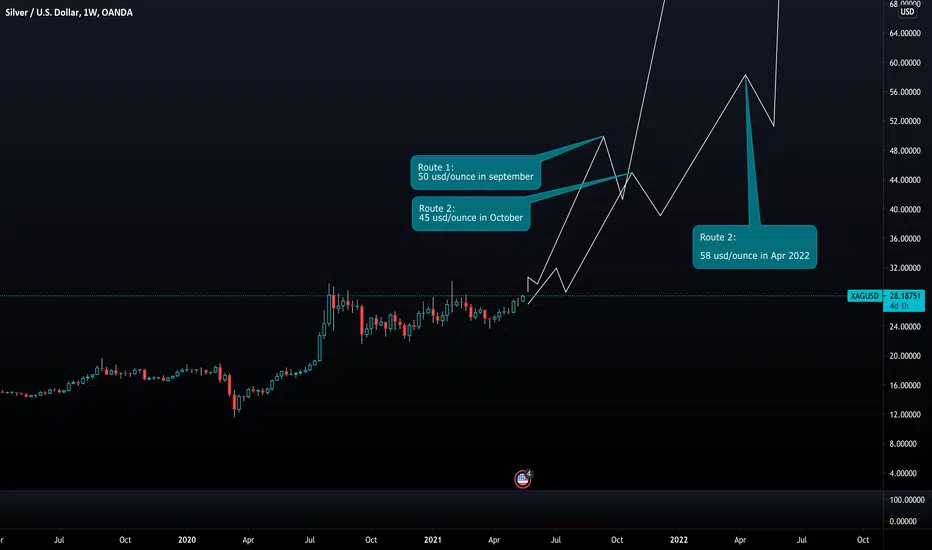
Potential routes for Silver price in the upcoming PM bull runFirst route is based on 2008 bull market in silver.
Second route is based on the bull market in late 70s.
I think a bullish phase similar to late 1970s makes the most sense. You can check out my analysis on Gold to see why.
Gold: Weekly ForecastGold fell into a range last week after creating a new high at 1845.
Although resistance at the 200++ moving average did create a reversal candlestick formation, the price found support and quickly parred all losses in the week.
Gold is now at a critical juncture as the last line of defense (200++ MA) before a potential parabolic bull run.
Given the current fundamentals, the US is at risk of hyperinflation since the last inflation data was released and that's what drives gold prices.
So we now have both technical and fundamental showing us a bullish gold market, not forgetting to mention that the dollar will continue to depreciate further due to the unprecedented money supply caused by the Fed.
Price of Interest:
Resistance - 1856 (equilibrium), 1950 (7-month supply zone)
Support - 1820 (bottom of channel), 1750 (neckline)
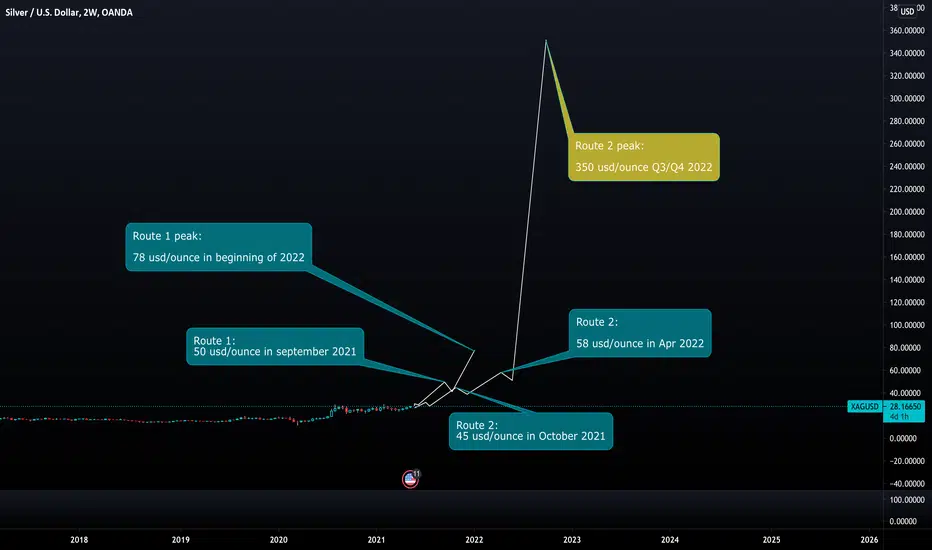
Potential routes for Silver price in upcoming PM bull run (2)
I am not going to go in detail in this analysis.
First route is based on 2008 bull market in silver.
Second route is based on the bull market in late 70s.
I think a bullish phase similar to late 1970s makes the most sense. You can check out my analysis on Gold to see why.
The end of bull trend is near for GOLD!Daily resistances are really crucial for charts. We do not speculate that the chart can surpass the resistance zone(1854-1876).Meanwhile the RSI indicator is in “over-sold” area which is another bearish signal for the chart.

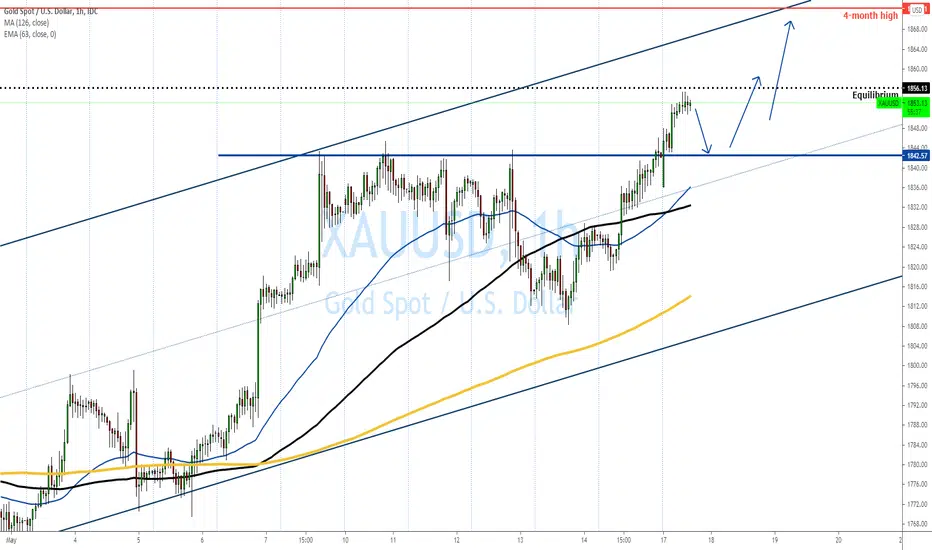
Gold Breaks Resistance; Awaiting PullbackThe gold opened low but climb throughout the Asia session and reached the equilibrium level at 1856.
The price has clearly broken above a 1-week resistance and may continue so within its current 2-month rising channel.
Wait for a pullback to 1842 to buy in again, targeting the equilibrium level at 1856, and then the top of the channel at 1871.
Technical analysis update: XAUUSD (17th May 2021)As all our previous price targets for gold were reached we would like to upgrade our short term price target for XAUUSD to 1875 USD per ounce. Bullish RSI and MACD support bullish case for gold. Also rising inflation plays in favor of gold. Furthermore, we think that the downtrend in cryptocurrency market will further support rotation into gold.
Disclaimer: This analysis is not intended to encourage buying or selling of any particular securities. Furthermore, it should not serve as basis for taking any trade action by individual investor. Your own due dilligence is highly advised before entering trade.