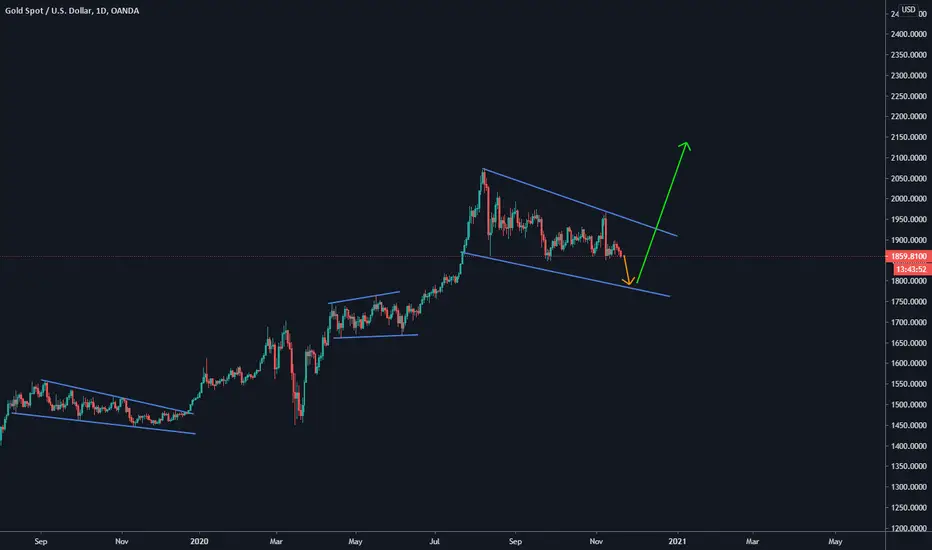
GOLD FUTURES 1D TF SET ALERTS FOR GOLDS DROP TO THE BOTTOM OF THE CHANNEL , LOST THE SUPPORT OF THE 200EMA AT THE PRESENT AND THE DXY MAKING A BIT OF A COMEBACK HAS PUT THE PRESSURE ON GOLD . WITH THAT SAID WE ALL KNOW THAT THE FED JUST KEEPS PRINTING SO SET ALERTS FOR THE BOTTOM OF THE CHANNEL BEFORE FILLING LONGS AND WATCH THE REACTION FIRST . TARGETS ARE LAID OUT ON CHART ... LIKE AND FOLLOW WOULD BE GREAT
Preciousmetals

Flag forming in Gold. $2,200 possible within the yearGold has been consolidating and retracting in volume. It looks coiled to break-out past previous resistance. The 50,100, and 200-day moving averages are on the verge of intersecting and hopefully reversing course in a more bullish direction.
Signal to buy should be when shorter-term MA's breakthrough 200-day.
RSI, MACD, and Gold spot prices have been declining in unison. RSI signals it is not overbought and MACD is signaling buy which gives this trade some legs and breathing room.
On the fundamental side, gold is the most resistant to rust and corrosion, making it the most reliable and durable electrical conductor. It is key for computer and satellite technology. If Starlink is going to become a reality, regardless of whether or not it does so under the umbrella of Tesla or by IPO'ing, they will need a lot of gold to make those satellites low maintenance.
Gold is also essential in the production of green technology and it is essential for healthcare and our digital world.
I expect spot prices of $2,200 within the year and at least $2,500 by 2022.

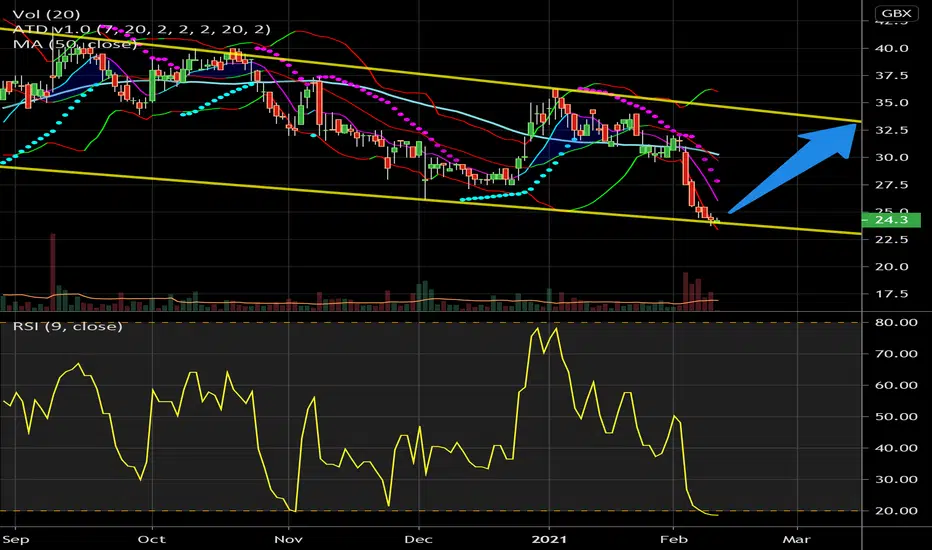
Hummingbird Resources set to bounce from channel's bottomHummingbird Resources LSE:HUM is a gold miner, which stocks are traded on the London Stock Exchange.
It benefits from a very low valuation with a PER of less than 4 at the time of publishing.
After a lengthy consolidation inside a descending channel the stock price now hits the lower channel's boundary in a super oversold condition.
It is time for a bounce in direction of the upper channel boundary, before expecting a channel's break to the upside.
OpenFX H1 Gold Strategy - 2021.02.9-12 - UpdatedThe dollar is weakening still. H4 MACD looks promising. I expect a strong push to the upside. In addition to the first chart I have included my secondary thoughts on expected action on Gold. Again there is risk. Trade and tread with caution.

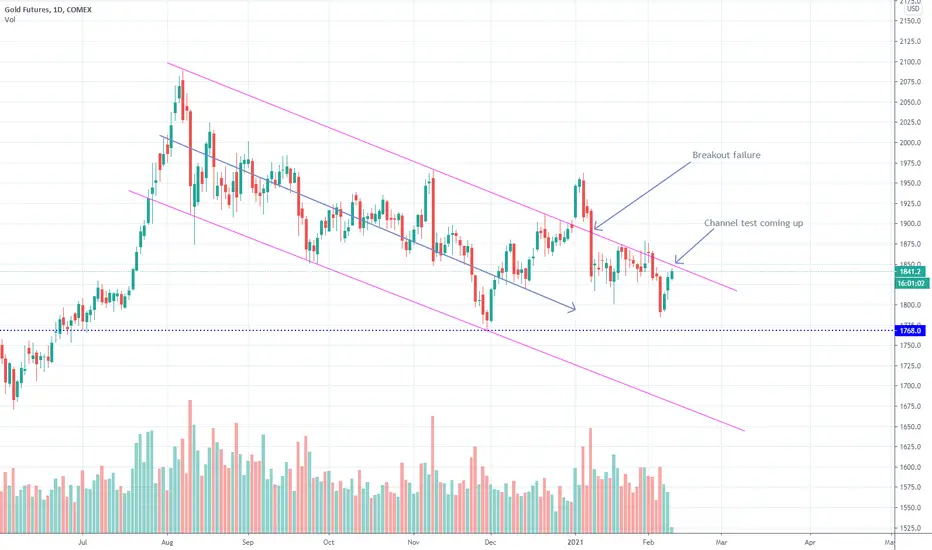
$Gold $1850 test coming upGold is still stuck in a down channel, but a test of $1850 looks very likely. That level needs to be breached with some momentum to the upside before I'll start getting interested again.
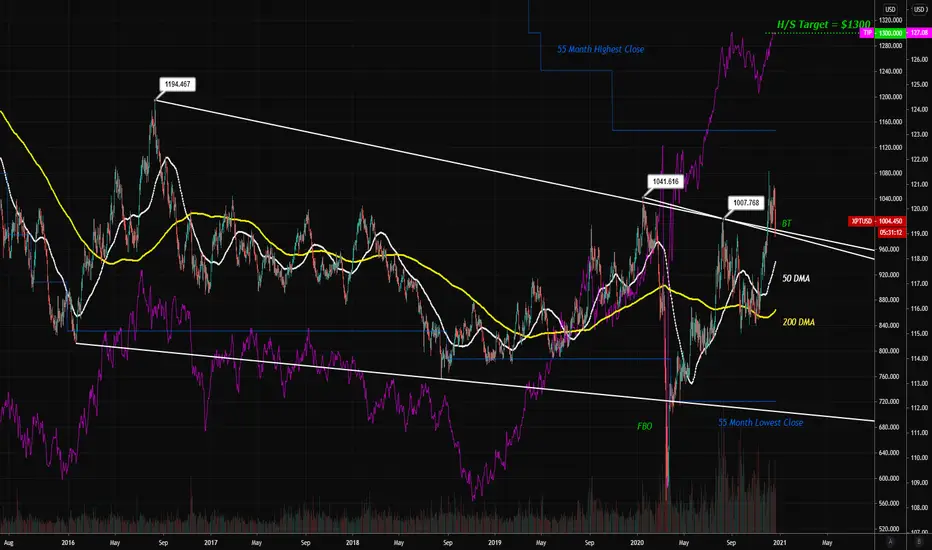
Seasonal $XPTUSD Platinum LongIt is time to start considering a major platinum trade in either spot or $PPLT equivalent. The measured move target of $1300 is shown and I believe we can get there by March 1 2021.
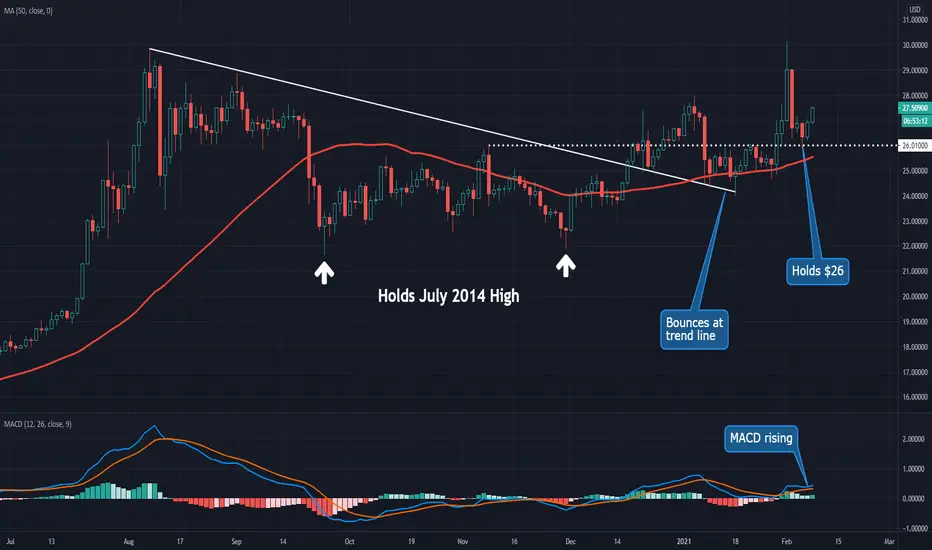
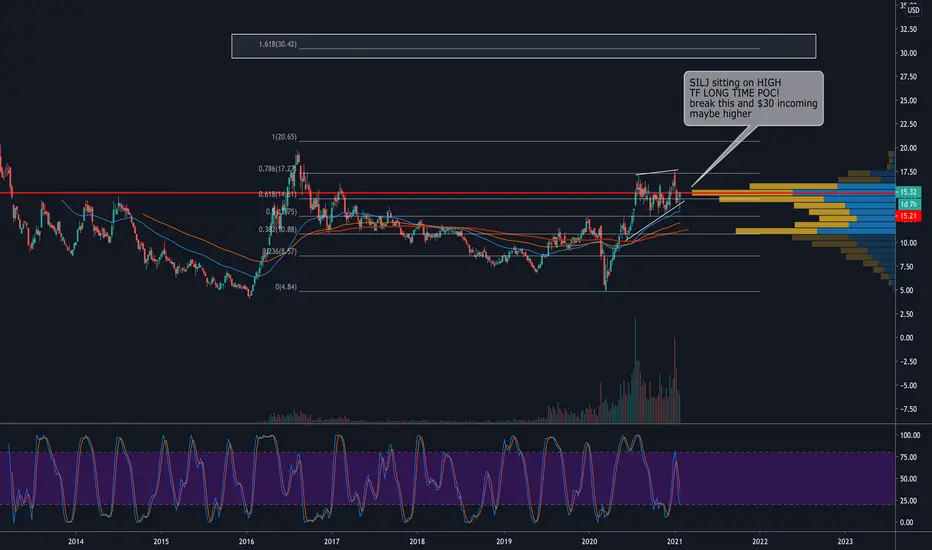
Never Mind Short Squeezes. Silver Appears BullishSilver was in focus last week on talk of a short squeeze. The attempt fell flat, but the white metal’s technicals could be lining up for a rally regardless.
The first chart feature is the huge breakout above $20 in July. This was confirmed by retests on September 24 and November 30. Notice how prices rebounded sharply from both attempts. Interestingly, the bottoms around $22 were near the peak in July 2014, before silver collapsed decisively under $20 (where it would spend most of the next six years).
Next is the descending trendline that began after the 2020 spike. XAGUSD spent more than a month fighting against that resistance before turning it into support in late January.
Third, notice how prices held $26 last week. That was the peak on November 9 (vaccine rally day for stocks) and the weeks begun January 11 and 18. Again, old resistance became new support.
MACD is also rising on the daily chart and just turned higher on the weekly chart (see above).
Finally, the U.S. dollar has been holding its ground for the last two months. However, the greenback’s longer-term trend is still bearish. Continuation of that slide would also potentially help silver.
TradeStation is a pioneer in the trading industry, providing access to stocks, options, futures and cryptocurrencies. See our Overview for more.

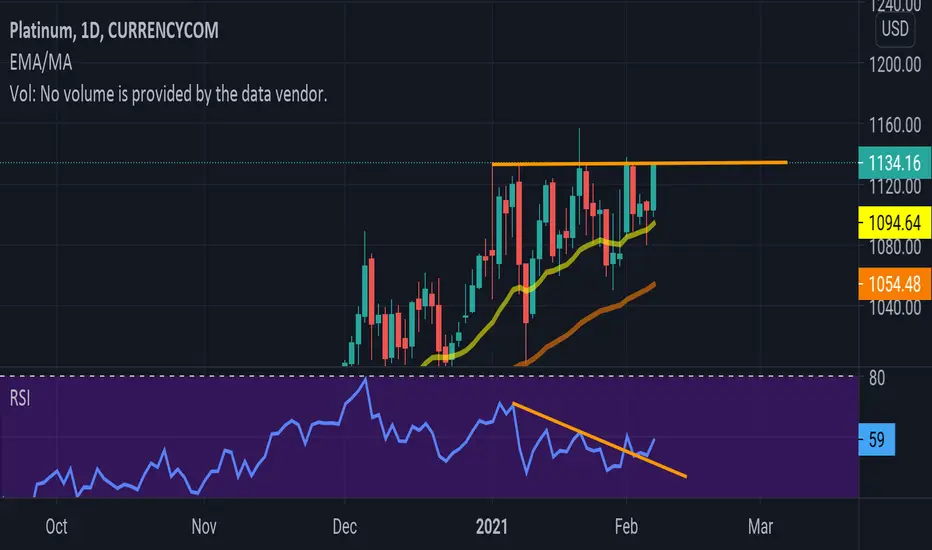
Platinum looking strong bullHello!
Platinum looking really bullish. We got here a beatiful higher low pattern and a vertical line which has worked as resistance.
This resistance has been tested 4 times. What I have seen usually 5th or 6th time does it.
Also RSI has already broke it's own the resistance line and used it even as a support. This gives me a strong bullish view.
Platinums demand is also getting bigger. Car makers are starting to use platinum instead of expensive palladium on exhaust systems.
If you are not holding for long term and are trading. Use stop loss.
Otherwise you will get your ass burned!
Take care
Jebu
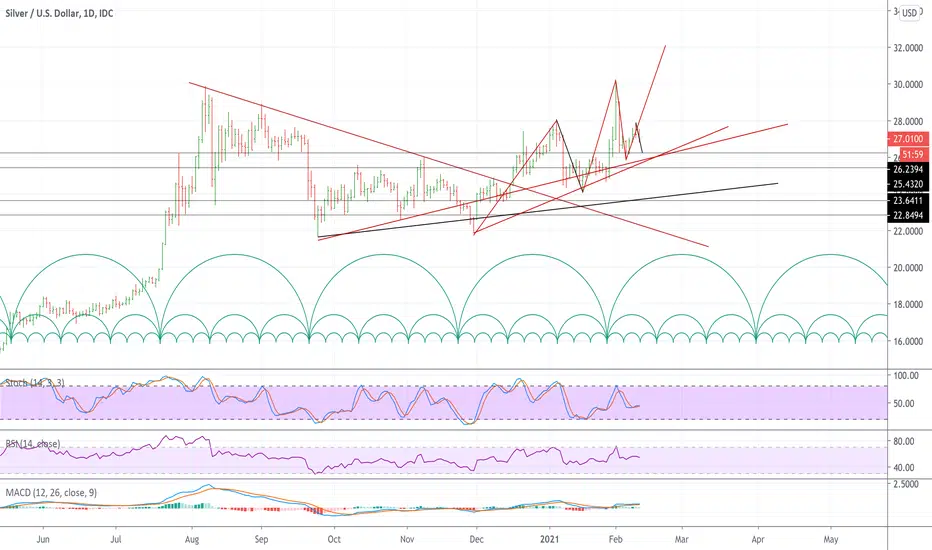
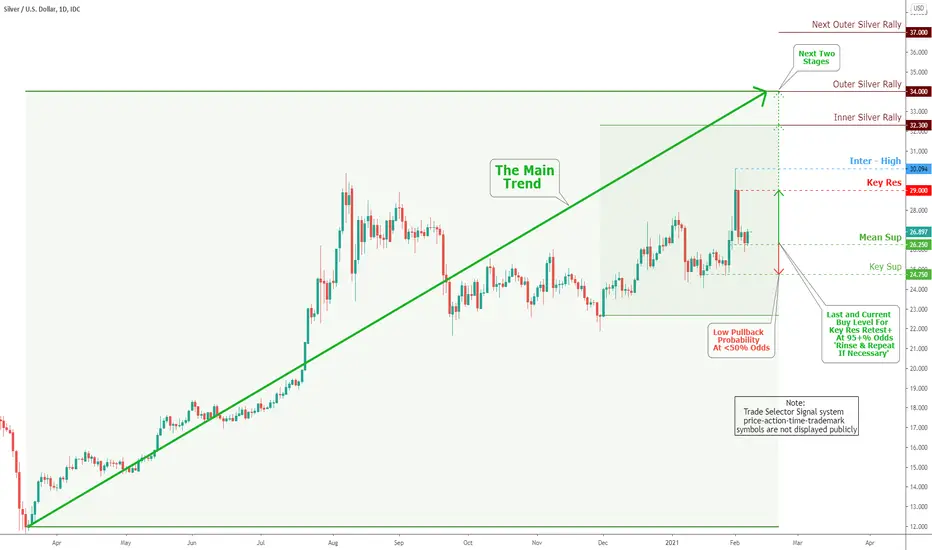
Technical Analysis and OutlookTechnical Analysis and Outlook
The continuous Silver action keeps the price above Mean Sup $26.250 . Silver's upside at this super bull rally is high; however, the downside low probability pullback should be to the Key Sup $24.750 - If it happens at all. To continue the rest of the market story, see the 'Weekly Market Review & Analysis For February 1, 2021" at the usual site.
GOLD Targeting 2100$+ gold can pullback down to ~1800$ but it seems preparing for another strong bounce over 2100$.
$SI1! Silver Futures. Where is it going to go ? $33 might offer some clues, but as always very difficult to determine where this will eventually end up. Very speculative. Don't play what you cannot afford to lose in this market.

GLD Trend AnalysisWe're continuing in this downward trend but primed to breakout to the upside. Accumulation/Distribution shows large accumulation dring tthis entire retracement

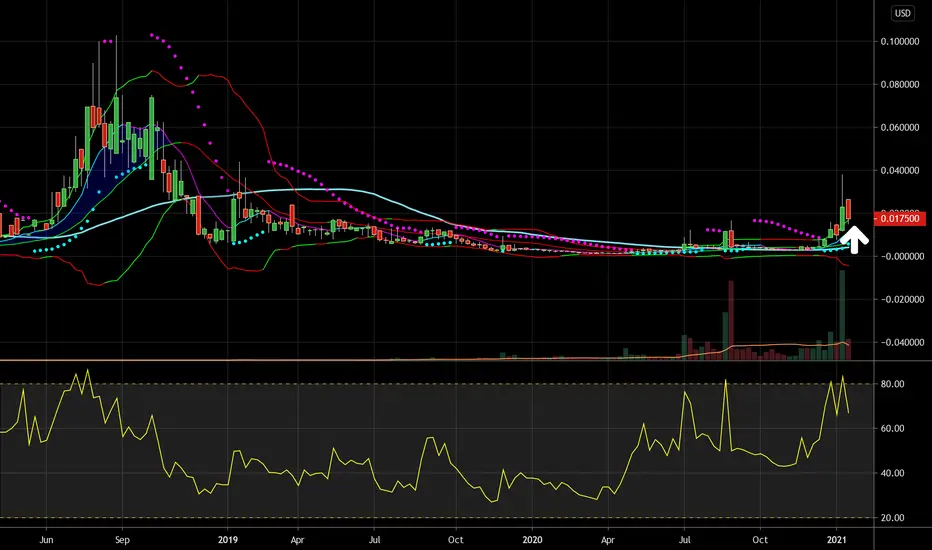
Asia Broad Band, Inc., Massively UndervaluedAs the name does not indicate, OTC:AABB is a base metal and precious metal player.
Technically, the stock is in an initial breakout stage on the weekly / monthly time scales.
Fundamentally, the PER is 0.35 by 2020 year's end and presently 1.35 with strongly improving net profits.
On the medium term the stock is at least a 5-bagger, potentially a 10-bagger.
I went long at $0.017 yesterday (Friday, 22 Jan 2021).
On the short term there is a possibility for the stock price to drop to 0.012 - 0.013 (on top of the white arrow) at which price I will double down if this happens.