NATGAS: Bullish Continuation is Expected! Here is Why:
Our strategy, polished by years of trial and error has helped us identify what seems to be a great trading opportunity and we are here to share it with you as the time is ripe for us to buy NATGAS.
❤️ Please, support our work with like & comment! ❤️
Prediction

QQQ: Long Trade with Entry/SL/TP
QQQ
- Classic bullish setup
- Our team expects bullish continuation
SUGGESTED TRADE:
Swing Trade
Long QQQ
Entry Point - 508.17
Stop Loss - 501.12
Take Profit - 522.71
Our Risk - 1%
Start protection of your profits from lower levels
❤️ Please, support our work with like & comment! ❤️

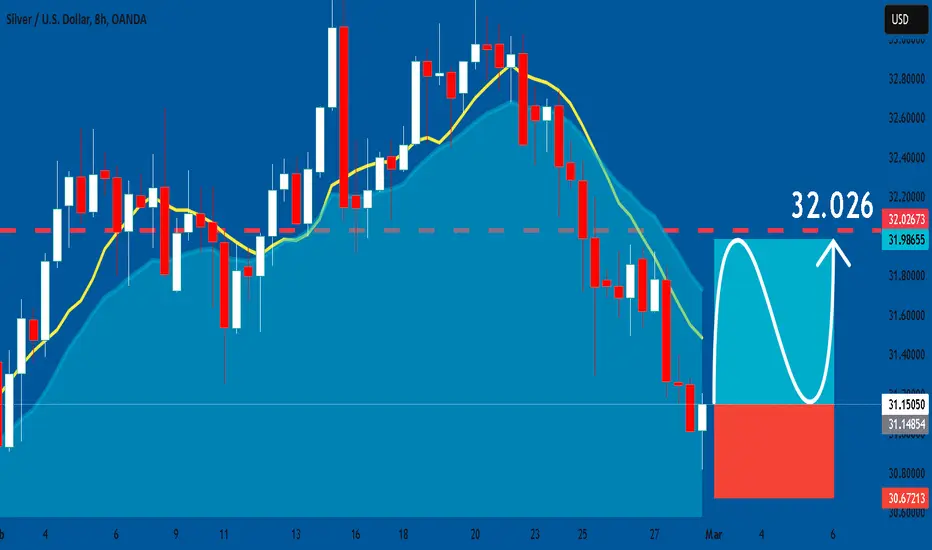
SILVER: Long Trading Opportunity
SILVER
- Classic bullish formation
- Our team expects growth
SUGGESTED TRADE:
Swing Trade
Buy SILVER
Entry Level - 31.150
Sl - 30.672
Tp - 32.026
Our Risk - 1%
Start protection of your profits from lower levels
❤️ Please, support our work with like & comment! ❤️
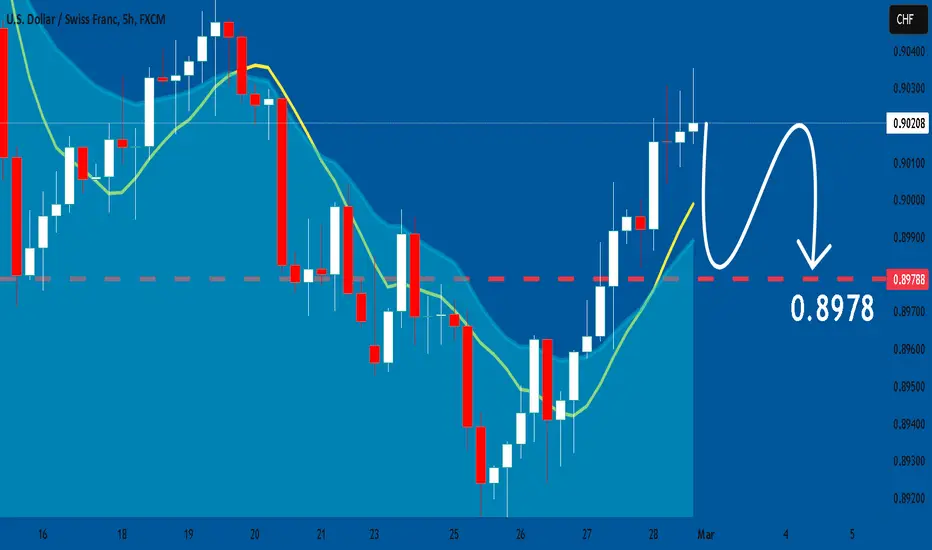
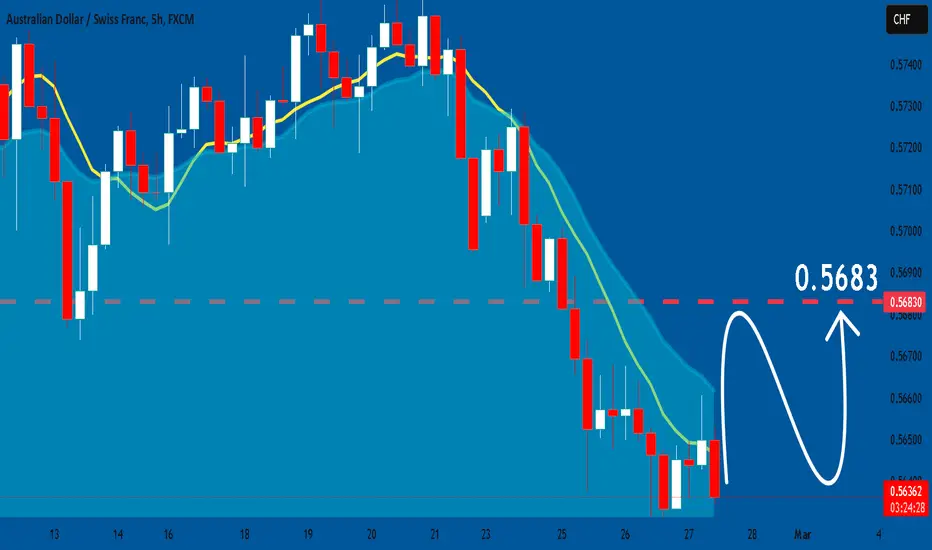
USDCHF: Will Keep Falling! Here is Why:
Balance of buyers and sellers on the USDCHF pair, that is best felt when all the timeframes are analyzed properly is shifting in favor of the sellers, therefore is it only natural that we go short on the pair.
❤️ Please, support our work with like & comment! ❤️
GBPUSD: Bullish Forecast & Bullish Scenario
The recent price action on the GBPUSD pair was keeping me on the fence, however, my bias is slowly but surely changing into the bullish one and I think we will see the price go up.
❤️ Please, support our work with like & comment! ❤️

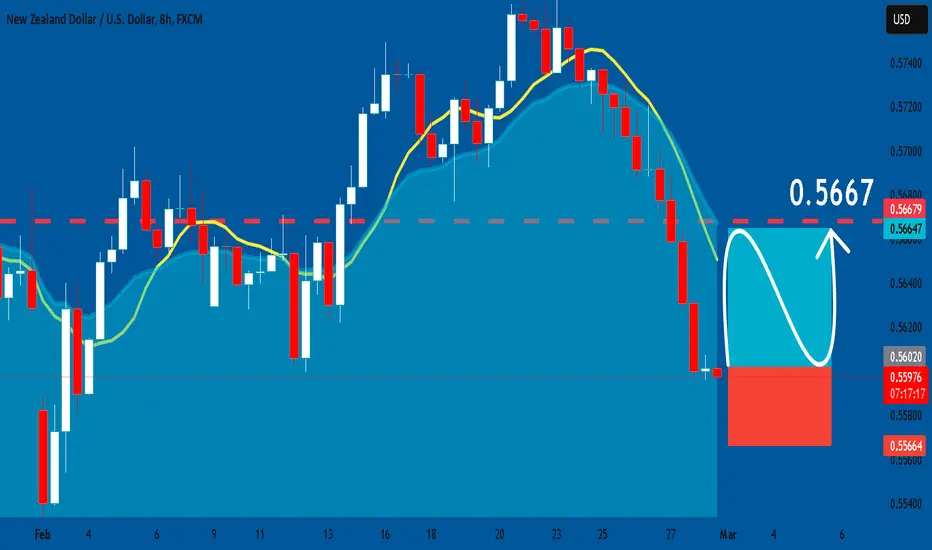
NZDUSD: Great Trading Opportunity
NZDUSD
- Classic bullish formation
- Our team expects pullback
SUGGESTED TRADE:
Swing Trade
Long NZDUSD
Entry - 0.5598
Sl - 0.5566
Tp - 0.5667
Our Risk - 1%
Start protection of your profits from lower levels
❤️ Please, support our work with like & comment! ❤️
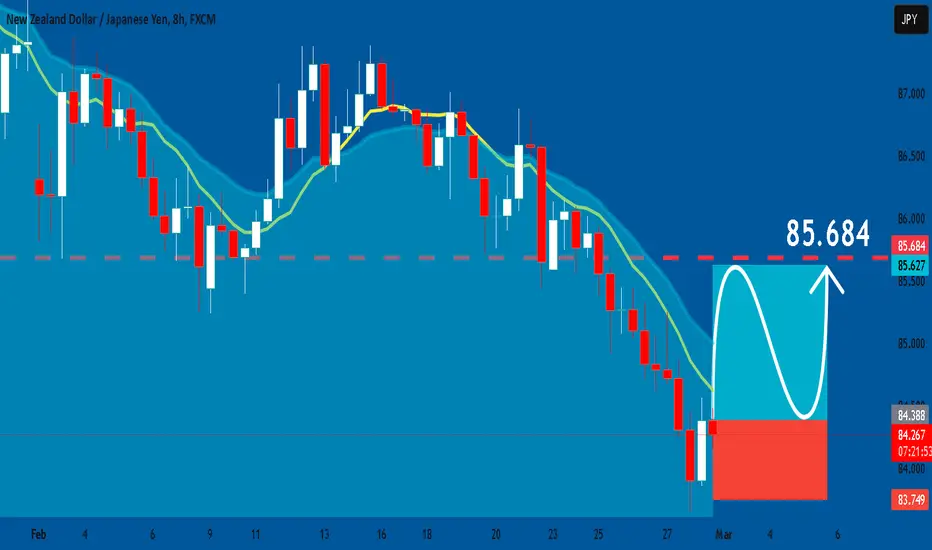
NZDJPY: Long Trading Opportunity
NZDJPY
- Classic bullish pattern
- Our team expects retracement
SUGGESTED TRADE:
Swing Trade
Buy NZDJPY
Entry - 84.379
Stop - 83.749
Take - 85.684
Our Risk - 1%
Start protection of your profits from lower levels
❤️ Please, support our work with like & comment! ❤️
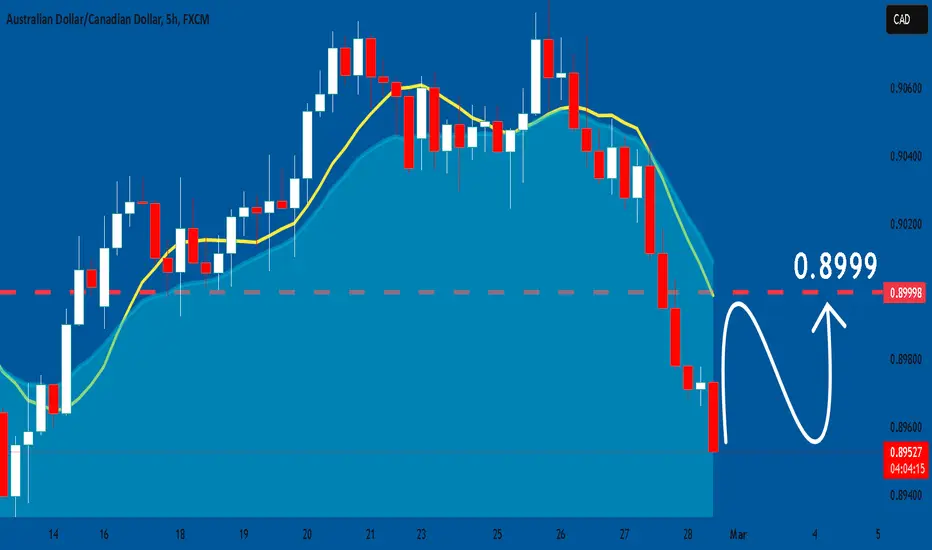
AUDCAD: Bullish Forecast & Outlook
It is essential that we apply multitimeframe technical analysis and there is no better example of why that is the case than the current AUDCAD chart which, if analyzed properly, clearly points in the upward direction.
❤️ Please, support our work with like & comment! ❤️
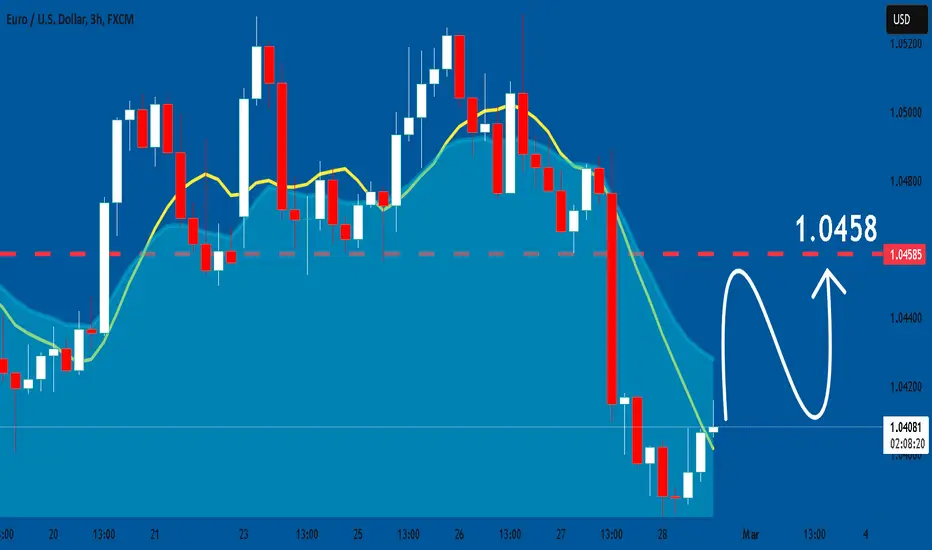
EURUSD: Bullish Continuation is Expected! Here is Why:
The analysis of the EURUSD chart clearly shows us that the pair is finally about to go up due to the rising pressure from the buyers.
❤️ Please, support our work with like & comment! ❤️
Bitcoin's Next Move: Accumulation or Breakdown?The Market at a Tipping Point – What's Next for Bitcoin?
Bitcoin (BTC) is currently trading at $80,594, sitting 26.7% below its all-time high of $109,951 reached just over a month ago. The market is showing signs of uncertainty—traders are caught between a potential accumulation phase and a looming correction.
The Relative Strength Index (RSI) is flashing 38.2, creeping towards oversold territory, while the Money Flow Index (MFI) at 28.2 suggests that liquidity is drying up. With MA50 at 84,015 and MA200 at 92,048, BTC remains below key moving averages, signaling bearish momentum in the short term. But is this really a time to sell—or could this be a golden accumulation zone before the next leg up?
Recent VSA Buy Patterns indicate that smart money could be positioning for an upward move. However, resistance at $84,686 looms overhead, a level that must be reclaimed before bulls can take control. On the flip side, failure to hold above $76,701 support could open the floodgates to lower levels.
So, what’s the verdict? Breakout or breakdown—who’s ready for the next move?
Bitcoin's Price Roadmap: Tracking the Smart Money Moves
The market never lies, but it sure knows how to fake out the crowd. Let's break down the most recent Bitcoin (BTC) price action through the lens of high-impact VSA patterns and volume dynamics, separating the noise from the real moves.
Phase 1: The Sell-Off – Smart Money Setting the Trap?
2025-02-26 18:00 UTC – Sell Volumes Max kicks in, sending BTC downward from $86,002 to $84,112, a clear indication that the big players were offloading before the next major move.
2025-02-28 01:00 UTC – Confirmation: Another Sell Volumes pattern emerges, pushing BTC lower to $81,613. The downward momentum is undeniable. Bears are in control.
Phase 2: A Reversal or a Trap?
2025-02-28 08:00 UTC – VSA Buy Pattern Extra 1st emerges at $79,176, signaling an accumulation phase. The structure suggests a comeback, but we need validation.
2025-02-28 06:00 UTC – VSA Buy Pattern Extra 2nd confirms the recovery as BTC moves up from $79,953 to $80,392, bouncing off key liquidity zones.
Phase 3: Where Are We Now?
Bitcoin's ability to reclaim $80K+ and sustain above the $78K liquidity zone suggests that the market might be done with the shakeout. However, true confirmation lies in breaking $84,686 resistance before bulls can run the show.
The MFI at 28.2 still signals low liquidity, meaning bulls need fresh momentum to confirm a sustainable move.
Key Takeaway: The Next Play
If BTC holds above $80K, watch for a move toward $84K+. If volume dries up, expect another flush before the real pump begins. Either way, the big money has already placed their bets—are you ready?
Technical & Price Action Analysis: Key Levels to Watch
When it comes to Bitcoin, levels are everything—play them right, and you’re in the game. Miss them, and you’re catching knives. Here’s what’s on the board:
📍 Resistance Levels – Where the Heat Is
$84,686 – First roadblock, and where sellers could step in hard.
$92,058.5 – If BTC rips past 84K, this is the next stop.
$94,036.1 – Mid-level supply zone; needs a breakout confirmation.
$96,271.2 – Psychological barrier before the big leagues.
$100,796.4 – The last line before full-on euphoria.
🛠️ Support Levels – Where the Bounces Happen
$76,701.7 – If bulls want a second chance, they gotta hold this.
$67,838.7 – Break this, and we’re talking deeper retrace.
$60,295.6 – Final line of defense before things get ugly.
$47,122.4 – Buyers better show up here.
$28,696.9 – Let’s not even talk about this one…
🚀 Powerful Levels – The True Battlegrounds
Support: $96,262.6 – Bulls want this level back, or it flips to resistance.
Resistance: $76,701.7 – If price reclaims this, expect fireworks.
⚠️ If these levels don’t hold, they flip to resistance. That’s how the market works—fail to bounce, and these same zones become walls for the next run-up. Stay sharp, play the levels, and let the market show its hand.
Trading Strategies Using Fibonacci Rays: Optimistic & Pessimistic Scenarios
The VSA Fibonacci Rays are already on your chart—your job is to watch for price interactions and react accordingly. These dynamic levels are based on the natural flow of price action, not rigid static points. When price meets a ray, it signals either a reversal or continuation, but only after confirmation from volume dynamics and moving averages.
🚀 Optimistic Scenario: Bulls Take Control
If Bitcoin reclaims key resistances and confirms strength via moving averages, we’re looking at a trend continuation.
Long Entry: $80,594 (current market level)
First Target: $84,686 (First resistance break confirms strength)
Second Target: $92,058 (MA200 alignment, momentum builds)
Final Target: $96,271 (Extended breakout zone)
Trigger: A clean bounce from Fibonacci Ray support with rising buy volume. Confirmation via RSI moving above 50 and MA50 flipping upward.
🔻 Pessimistic Scenario: Bears Keep the Pressure
If Bitcoin fails to hold above $76,701, we’re entering a corrective phase with further downside possible.
Short Entry: $76,700 (Break below key support)
First Target: $67,838 (Next liquidity grab zone)
Second Target: $60,295 (Stronger demand area)
Final Target: $47,122 (Capitulation scenario, extreme bear case)
Trigger: A rejection at $80,000–$81,000 on weak volume + failure to reclaim MA50 resistance. Confirmation via RSI below 40 and a bearish cross on MA100 & MA200.
🎯 Key Takeaways for Trade Execution
Always wait for price interaction with a Fibonacci Ray before entering.
Trades run from ray to ray—first target is always the next ray in the sequence.
A bounce from support rays = long setup. A failure to reclaim resistance rays = short setup.
MA50 & MA200 act as trend confirmations—price above is bullish, below is bearish.
Bottom line: The market won’t move in straight lines, but rays act as dynamic waypoints, guiding price through the chaos. Position accordingly.
Got questions? Want to discuss levels, setups, or how to use these insights in your trading? Drop your thoughts in the comments! I read everything and do my best to respond.
If this analysis was useful, hit Boost and save this post—check back later to see how price respects the mapped-out structure. Trading is all about understanding reaction points, and this roadmap lays them out for you.
I use a private indicator that automatically plots Fibonacci rays and key levels—if you’re interested in accessing it, shoot me a message.
Need a breakdown on a specific asset? I can chart it for you. Some analyses I share publicly, while others can be done privately depending on what you need. If you want a custom markup, let me know—we’ll figure out the best way to make it happen.
These rays work across all assets—crypto, forex, stocks, you name it. If there’s a ticker you want analyzed, hit Boost and comment below, and I’ll include it in my upcoming posts.
And if you haven’t yet—follow me on TradingView to stay ahead of the market. Let’s trade smart. 🚀

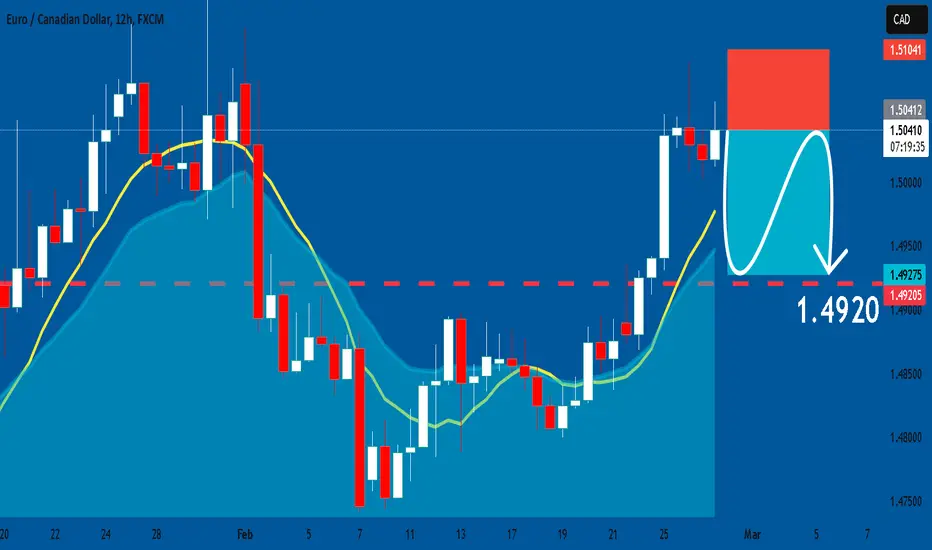
EURCAD: Short Trade Explained
EURCAD
- Classic bearish formation
- Our team expects fall
SUGGESTED TRADE:
Swing Trade
Sell EURCAD
Entry Level - 1.5040
Sl - 1.5104
Tp - 1.4920
Our Risk - 1%
Start protection of your profits from lower levels
❤️ Please, support our work with like & comment! ❤️
AUDCHF: Bulls Will Push Higher
Looking at the chart of AUDCHF right now we are seeing some interesting price action on the lower timeframes. Thus a local move up seems to be quite likely.
❤️ Please, support our work with like & comment! ❤️
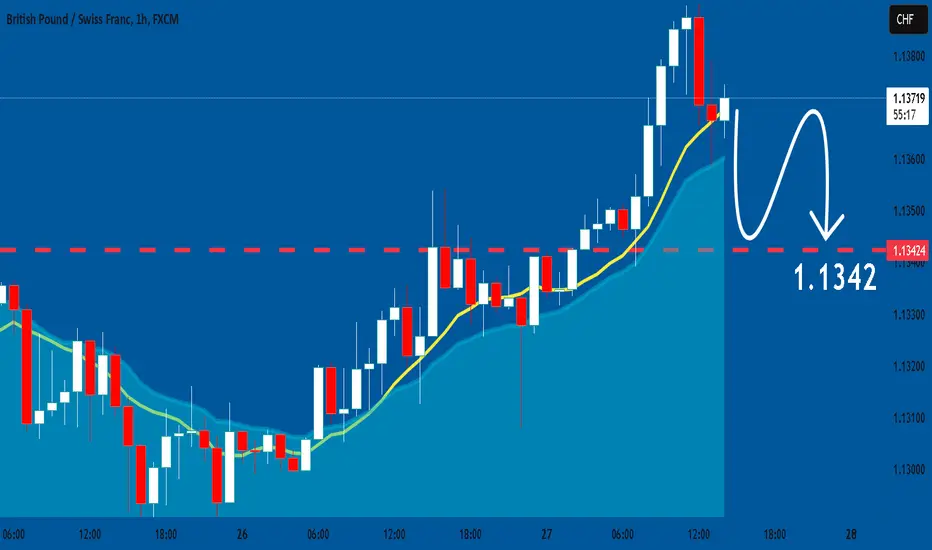
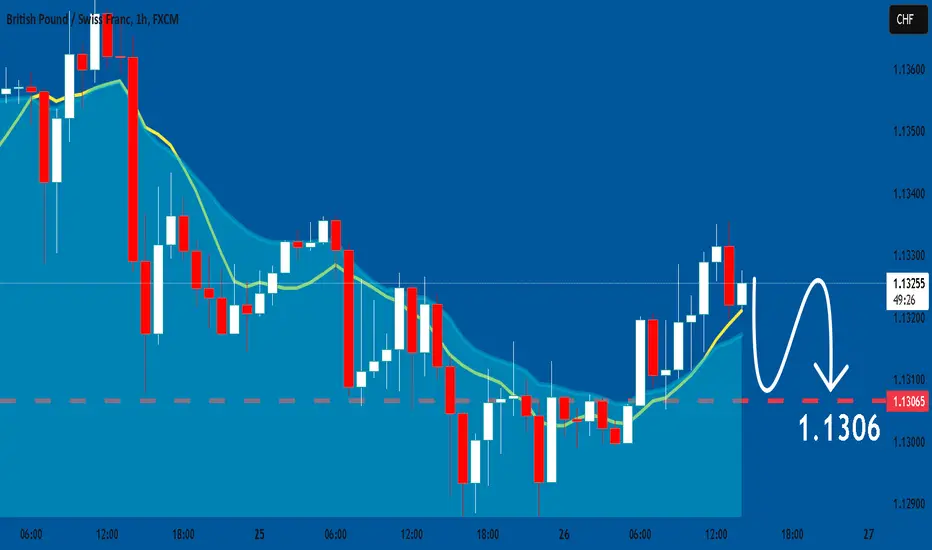
GBPCHF: Expecting Bearish Continuation! Here is Why:
The charts are full of distraction, disturbance and are a graveyard of fear and greed which shall not cloud our judgement on the current state of affairs in the GBPCHF pair price action which suggests a high likelihood of a coming move down.
❤️ Please, support our work with like & comment! ❤️
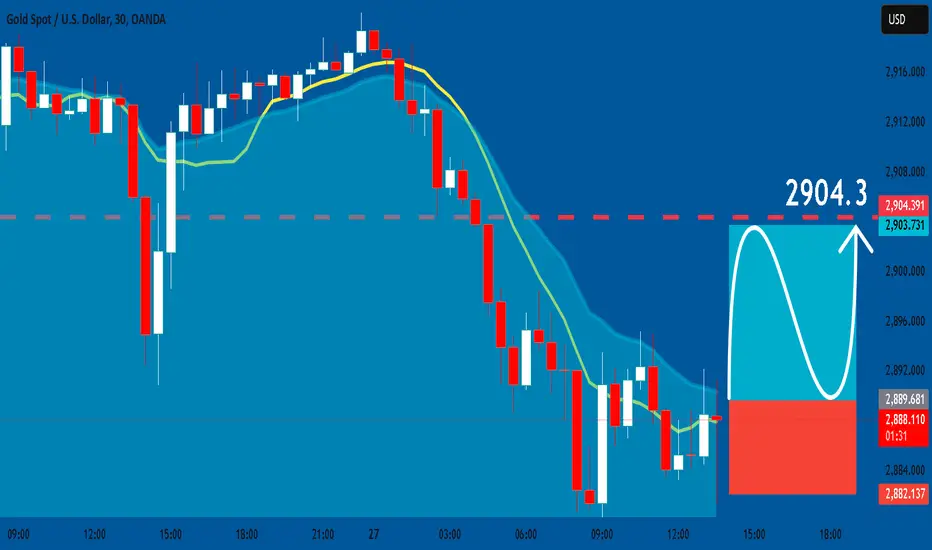
GOLD: Bullish Continuation & Long Trade
GOLD
- Classic bullish setup
- Our team expects bullish continuation
SUGGESTED TRADE:
Swing Trade
Long GOLD
Entry Point - 2888.5
Stop Loss - 2882.1
Take Profit - 2904.3
Our Risk - 1%
Start protection of your profits from lower levels
❤️ Please, support our work with like & comment! ❤️
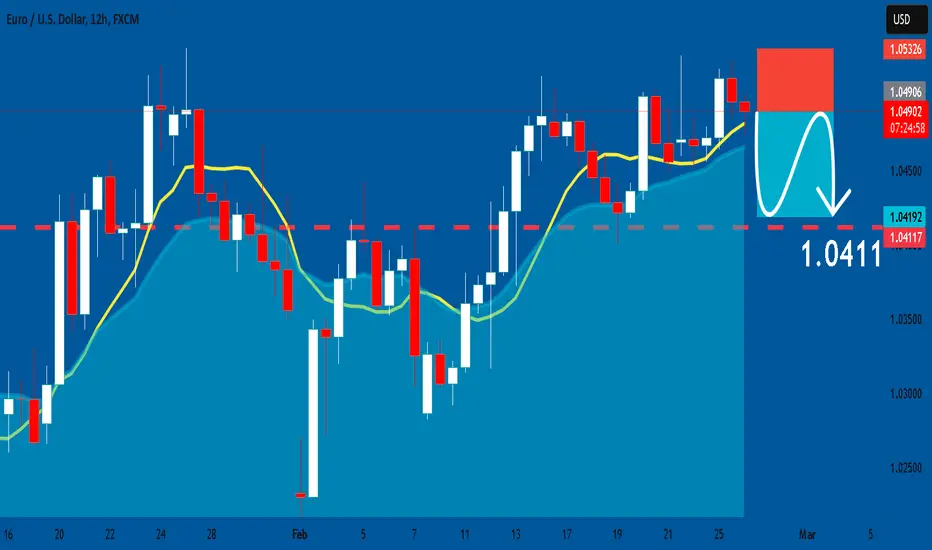
EURUSD: Short Signal with Entry/SL/TP
EURUSD
- Classic bearish formation
- Our team expects pullback
SUGGESTED TRADE:
Swing Trade
Short EURUSD
Entry - 1.0490
Sl - 1.0532
Tp - 1.0411
Our Risk - 1%
Start protection of your profits from lower levels
❤️ Please, support our work with like & comment! ❤️
EURNZD: Free Trading Signal
EURNZD
- Classic bearish pattern
- Our team expects retracement
SUGGESTED TRADE:
Swing Trade
Sell EURNZD
Entry - 1.8420
Stop - 1.8469
Take - 1.8325
Our Risk - 1%
Start protection of your profits from lower levels
❤️ Please, support our work with like & comment! ❤️

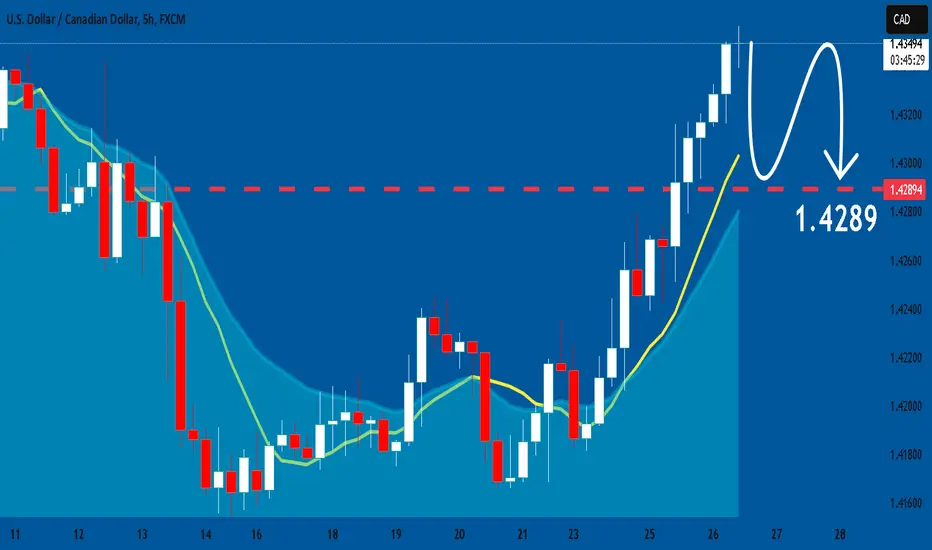
USDCAD: Bearish Continuation is Expected! Here is Why:
The price of USDCAD will most likely collapse soon enough, due to the supply beginning to exceed demand which we can see by looking at the chart of the pair.
❤️ Please, support our work with like & comment! ❤️
GBPCHF: Bearish Forecast & Outlook
Our strategy, polished by years of trial and error has helped us identify what seems to be a great trading opportunity and we are here to share it with you as the time is ripe for us to sell GBPCHF.
❤️ Please, support our work with like & comment! ❤️
EURCHF: Long Signal Explained
EURCHF
- Classic bullish formation
- Our team expects growth
SUGGESTED TRADE:
Swing Trade
Buy EURCHF
Entry Level - 0.9381
Sl - 0.9360
Tp - 0.9422
Our Risk - 1%
Start protection of your profits from lower levels
❤️ Please, support our work with like & comment! ❤️

GBPNZD: Bearish Forecast & Bearish Scenario
The recent price action on the GBPNZD pair was keeping me on the fence, however, my bias is slowly but surely changing into the bearish one and I think we will see the price go down.
❤️ Please, support our work with like & comment! ❤️

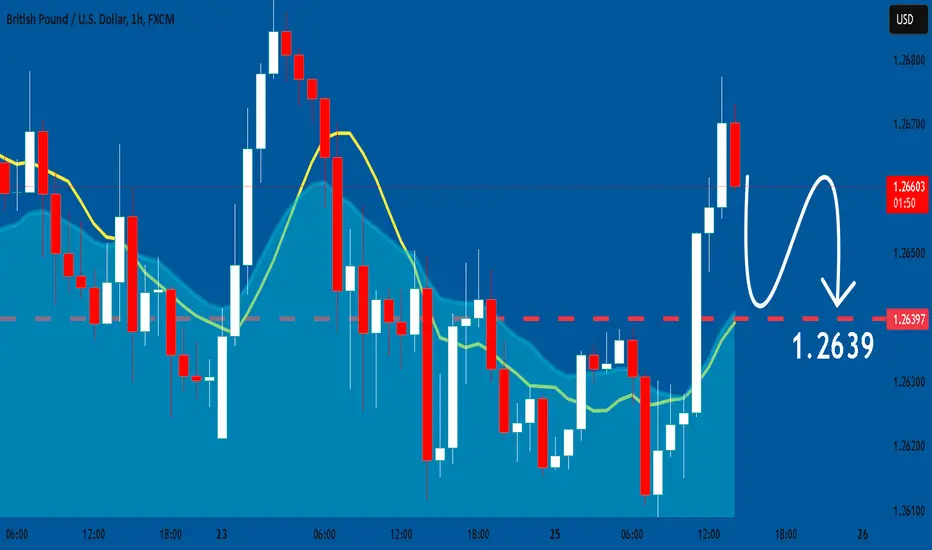
GBPUSD: Bears Will Push
It is essential that we apply multitimeframe technical analysis and there is no better example of why that is the case than the current GBPUSD chart which, if analyzed properly, clearly points in the downward direction.
❤️ Please, support our work with like & comment! ❤️
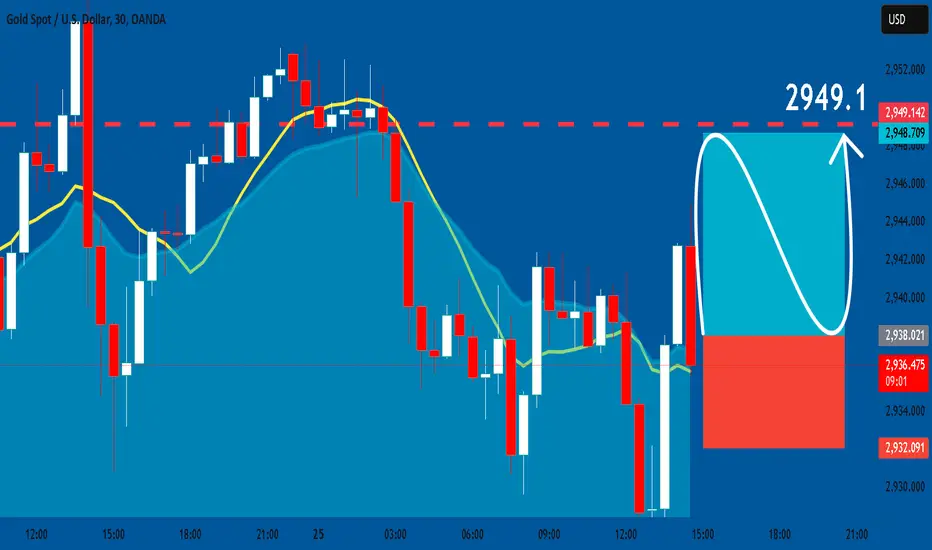
GOLD: Long Signal with Entry/SL/TP
GOLD
- Classic bullish formation
- Our team expects pullback
SUGGESTED TRADE:
Swing Trade
Long GOLD
Entry - 2938.0
Sl - 2932.0
Tp - 2949.1
Our Risk - 1%
Start protection of your profits from lower levels
❤️ Please, support our work with like & comment! ❤️
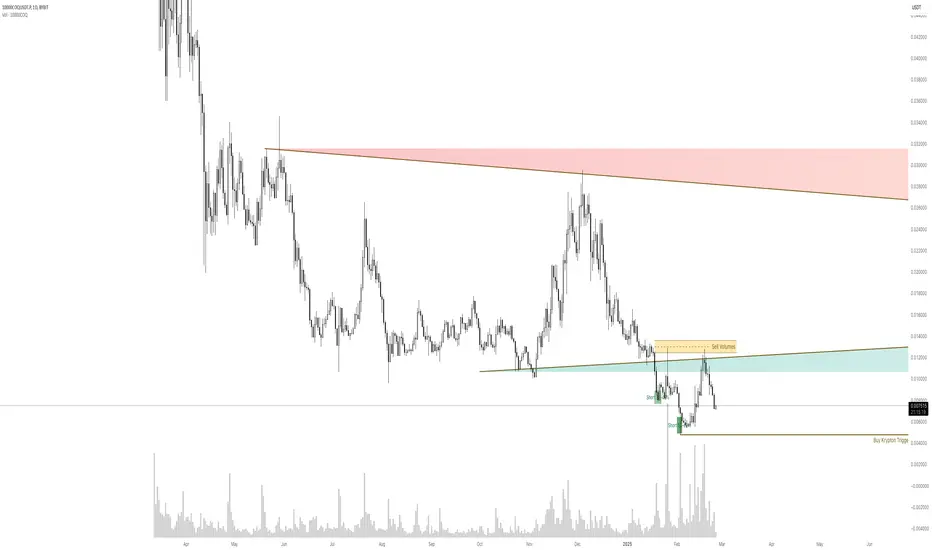
COQUSDT: The Market Squeeze—Reversal or Breakdown?COQUSDT at a Turning Point: Is the Bottom in?
COQUSDT is sitting at a critical juncture, hovering near $0.007427, a level that’s still 56% above its all-time low but nearly 89% off its peak. After weeks of sideways action, buy volumes have surged at key points, hinting at possible accumulation. But with RSI (14) at 35.6, are we witnessing the final stages of oversold conditions, or is there more downside ahead?
The 200-day MA looms at $0.010096, far above the current price, showing just how deeply this asset has been discounted. Momentum indicators suggest that COQUSDT is battling heavy resistance at $0.008245, a level that could determine the next leg of movement. The question is: Are bulls strong enough to flip this level into support, or will bears force a retest of the lower range?
With a mix of increased buy-side activity and lingering bearish pressure, the market is at a crucial decision point. Will we see a breakout to test the 100-day MA at $0.009132, or is another sell-off lurking around the corner? Buckle up—this could be the moment traders have been waiting for.
Roadmap: COQUSDT’s Recent Patterns – Are We Seeing a Reversal?
The market never lies—price action is the ultimate storyteller. Over the past few sessions, COQUSDT has been flashing some intriguing signals. Let's break down the key patterns that played out, separating the noise from the real moves.
February 21, 20:00 UTC – Buy Volumes Surge
A major Buy Volumes pattern kicked in as COQUSDT opened at $0.008589 and closed higher at $0.008975, testing resistance near $0.009193. The setup suggested an upward continuation, but was it enough?
February 21, 21:00 UTC – Confirmation of Strength
Bulls doubled down with another Increased Buy Volumes pattern, pushing the close up to $0.009475, hitting a session high of $0.009639. This confirmed the previous signal—buyers were stepping in aggressively.
February 22, 08:00 UTC – VSA Buy Pattern 4 Appears
The formation of a VSA Manipulation Buy Pattern 4th hinted at accumulation. The price action showed a minor retrace before stabilizing at $0.009158. However, the real test was ahead: Would buyers maintain control?
February 23, 13:00 UTC – A Battle at Resistance
A powerful VSA Manipulation Buy Pattern 3rd formed, keeping the buy-side momentum alive. The asset climbed further, closing at $0.009186—almost a direct follow-through from the prior pattern.
February 23, 16:00 UTC – Bears Strike Back
A major shift came as a Sell Volumes Max pattern emerged. The price reversed hard, closing down at $0.008515, marking the first sign of bearish dominance since the rally began.
February 24, 15:00 UTC – Sell Pressure Increases
Following the sell-off, the next candle confirmed more downside pressure with an Increased Sell Volumes pattern. The close at $0.007824 meant the bulls had officially lost their grip—momentum had shifted.
February 24, 16:00 UTC – Buyers Attempt a Comeback
Just when things looked bleak, a Buy Volumes Max pattern emerged. The asset rebounded slightly, closing at $0.007895, attempting to reclaim lost ground.
The takeaway? The buy-side momentum played out correctly up until February 23, proving that the earlier bullish patterns were accurate indicators of the rally. However, the sell signals on February 23-24 completely flipped the script, showing how fast sentiment can shift.
What’s Next? If buy volumes continue to build, we could see another attempt at breaking resistance around $0.008245. But if the sellers maintain control, expect further downside pressure. Stay sharp—this market is moving fast.
Technical & Price Action Analysis: Key Levels to Watch
Levels don’t lie—price respects structure, and smart money knows where liquidity is stacked. Here’s the real deal on support and resistance for COQUSDT. If a level doesn’t hold, expect it to flip into a new battlefield for bulls and bears.
Support Levels:
$0.005691 – First line of defense. If buyers don’t step in, we could see a deeper dive.
$0.00551 – The last standard support before things get ugly. A break below could open up a liquidity grab.
Resistance Levels:
$0.008245 – Immediate ceiling. Needs a strong push to flip bullish.
$0.009099 – A key decision point. Rejection here and sellers will pile in.
$0.010465 – A major pivot area. Break and hold above? We’re talking trend shift.
$0.011432 – Bulls need to own this level for sustained momentum.
$0.012347 – The breakout zone. If we see clean closes above, the game changes.
Powerful Support Levels:
$0.01302 – The fortress. If COQUSDT ever gets back above this, it’s game on for bulls.
Remember: If these supports fail, they become resistance. That’s how price action works—liquidity zones shift, and traders reposition. Watch the reactions, manage risk, and don’t get caught on the wrong side of the play.
Trading Strategies Using Fibonacci Rays
Understanding price action means reacting to movement, not predicting levels. My proprietary Fibonacci Rays method helps identify dynamic zones where price interacts before making its next big move. Each ray serves as a pivot, defining whether price rejects or continues.
These rays are already drawn on your chart, intersecting with VSA patterns and Moving Averages, giving you a structured roadmap for trades. Let’s break down the possible scenarios:
Optimistic Scenario: Breakout & Trend Continuation
If COQUSDT interacts with a key ray and confirms bullish movement, we ride the trend from one ray to the next, securing targets along the way.
Long Entry: Above $0.008245 (First Resistance)
Target 1: $0.009099
Target 2: $0.010465
Target 3: $0.011432 (Major trend shift)
Invalidation: Below $0.008000 (Rejection from ray)
Aggressive Long: If price reclaims MA50 ($0.008452)
Target 1: $0.009132 (MA100)
Target 2: $0.010096 (MA200)
Invalidation: Close below MA50 with volume spike
Pessimistic Scenario: Rejection & Trend Weakness
If price interacts with a ray but fails to confirm strength, we look for short opportunities targeting the next dynamic level.
Short Entry: Below $0.008245 (Failed breakout)
Target 1: $0.007427 (Current support)
Target 2: $0.005691 (Deeper correction zone)
Invalidation: Close above $0.008500 with strong momentum
Breakdown Short: If price loses MA50 and MA100 together
Target 1: $0.00551 (Final major support)
Invalidation: Price reclaims MA100 & MA50 with buy volume
💡 Key Takeaway: Positions should be taken only after price interacts with a ray and confirms movement. No blind entries—wait for market structure to guide you. Every ray crossover is a checkpoint, where price moves from one level to the next, giving traders a clear trade flow.
What’s Next? Let’s Talk Strategy!
Trading is all about understanding key reaction zones—that’s why I lay everything out before price makes its move. If you found this breakdown useful, make sure to Boost this idea and save it—check back later and see how price respects the levels. That’s how you sharpen your edge in the market.
Got questions? Drop them in the comments! I always check and reply when I can. Let’s discuss setups, levels, or anything that needs clarification.
My Fibonacci Rays indicator does all the heavy lifting—mapping levels and rays automatically. It’s Private, but if you’re interested in using it, shoot me a DM.
Want a breakdown for your favorite asset? I can analyze any chart—some ideas I post for free, while others we can discuss privately. If you have something specific in mind, let’s talk!
And remember—these rays work on ANY asset. If you want me to chart a specific one, hit Boost and drop a comment—I’ll get to it when I can.
If you’re not following me yet, now’s the time. Stay ahead of the market with my latest updates right here on TradingView. 🚀