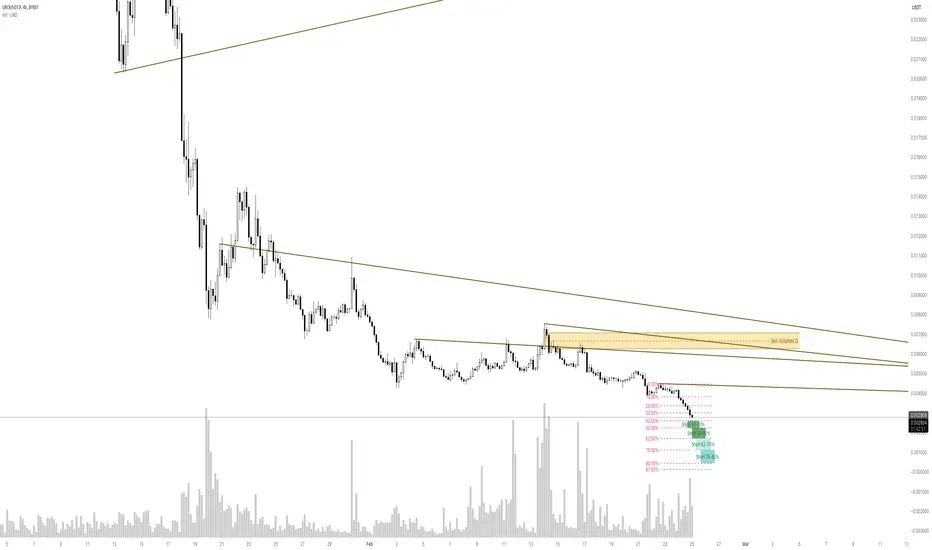
URUSDT: Oversold or Breaking Down? Decision Time!The Market at a Crossroads: Can URUSDT Hold the Line?
URUSDT is teetering at a critical juncture, trading at $0.002823, just a fraction above its all-time low of $0.002749, set only hours ago. With a staggering -96.54% decline from its absolute high of $0.08169, the market is flashing warning signals— but does this mean a final breakdown or an imminent reversal?
Momentum indicators paint a grim picture. RSI(14) at 21.2 suggests extreme oversold conditions, yet buyers remain hesitant. The MFI(60) at 31.06 indicates weak buying pressure, with no signs of immediate capital influx. Moreover, URUSDT remains well below its MA50 of $0.003751, showing no strength for a breakout just yet.
Adding to the uncertainty, recent pattern sequences show increased sell volumes dominating the order flow, particularly in the last 24 hours. The last notable VSA Buy Pattern failed to spark a lasting move, signaling hesitation among bulls.
So, what’s next? Will the market finally capitulate, or is this a once-in-a-lifetime entry point before a strong rebound? The next 24 hours are crucial— traders must watch if URUSDT can reclaim key resistance levels near $0.003357 - $0.003543, or risk another leg down.
This is the moment of truth. Are you ready for what comes next? 🚀📉
Roadmap: The Battle Between Bulls and Bears in URUSDT
Tracking recent price action in URUSDT, we've seen a high-stakes tug-of-war between buyers and sellers, with key volume spikes defining the trend. Let’s break down the roadmap based on confirmed pattern movements, filtering out the noise and focusing on the setups that played out as expected.
February 21, 19:00 UTC – VSA Buy Pattern Extra 1st (Bullish Confirmation!)
The first big signal came with a VSA Buy Pattern Extra 1st, suggesting a potential trend reversal after prolonged selling pressure. The pattern didn’t have a defined trigger point, but the immediate price movement confirmed bullish strength. URUSDT opened at $0.003991, closed slightly lower at $0.003949, but quickly climbed in the next bars, reaching $0.0041, aligning with the expected upward move.
February 21, 21:00 UTC – Increased Sell Volumes (Bearish Reversal Hits Hard!)
Just as bulls started to gain momentum, the market hit a wall with a Sell Volumes pattern. The price reacted aggressively, opening at $0.004068, closing at $0.003968, and testing a low of $0.003848. This confirmed the pattern’s bearish call, as the next bars saw URUSDT struggle to recover.
February 21, 22:00 UTC – VSA Buy Pattern 4 (A Fakeout or the Real Deal?)
The market attempted a bullish comeback with VSA Buy Pattern 4, a classic setup for large-range upward moves. Opening at $0.003968, the pattern suggested that price should hold above its low $0.003848 before pushing higher. The subsequent candle action validated the buy direction, with URUSDT climbing past $0.004004, hitting resistance at $0.004046.
February 22, 10:00 UTC – VSA Sell Pattern 2 (Bears Take Control Again!)
After the brief bull rally, sellers took back control. The VSA Sell Pattern 2 projected downward movement if price failed to hold above $0.004352. True to the script, URUSDT dropped from $0.004266 to $0.004215, signaling further downside pressure. This was a key validation of the bearish play.
February 22, 15:00 UTC – Buy Volumes Max (Short-Lived Bullish Breakout)
An influx of buy orders momentarily turned the tables, with a Buy Volumes Max pattern emerging. Opening at $0.004228, URUSDT soared to $0.004415. However, the failure to sustain above the high of $0.004432 indicated that bulls lacked follow-through, making this a temporary bounce rather than a trend shift.
February 22, 18:00 UTC – VSA Sell Pattern 1 (The Breakdown Begins!)
One of the strongest confirmations came with the VSA Sell Pattern 1, signaling a high-probability drop. URUSDT had a brief consolidation before falling from $0.004402 to $0.004316, with lows testing $0.00417. This reinforced the overall bearish momentum that had been building up since the Sell Volumes Max setup.
What’s Next? Key Takeaways
The roadmap reveals a market still favoring the bears, with every bullish attempt getting slammed by increased sell pressure. The next critical level to watch is whether URUSDT can hold above $0.002823, its current price floor. If bulls fail to defend this zone, we could be looking at another downward leg before any significant recovery.
Traders, are you ready for the next move? The market is setting up, and the next few days will tell whether URUSDT finds support or faces another sell-off. Stay sharp! 🚀📉
Technical & Price Action Analysis: Key Levels to Watch
Price is king, and levels don’t lie. URUSDT is trading at a make-or-break zone, and traders should have these key levels on their radar. If these supports don’t hold, they’ll flip into resistance—just like we’ve seen before in weak bounces. Let’s break it down:
Support Levels (If These Crack, They Become New Resistance!)
$0.002823 – The last line of defense, sitting right above the fresh absolute low of $0.002749. If this level collapses, the downside can get ugly fast.
$0.003357 – A mid-range pivot where buyers could step in. Lose this level? Expect it to be a tough wall for the bulls to break later.
$0.003543 – Another reaction zone; failure to hold means this turns into a major shorting area.
Resistance Levels (Bulls Need to Smash These to Flip Sentiment)
$0.003543 – First checkpoint for any relief rally; expect a fight here.
$0.004163 – Major level; a breakout could trigger FOMO, but rejection = more downside.
$0.004898 – If price gets here, momentum traders will start paying attention.
$0.006186 – The final boss. A reclaim of this level could mean trend reversal, but let’s not get ahead of ourselves.
Powerful Support Levels (The Ultimate Make-or-Break Zones)
$0.0079 – If price ever recovers here, it’s game-changing. Until then, just a dream.
$0.02335 – Long-term traders have this in sight for macro accumulation, but it’s far out of reach for now.
Powerful Resistance Levels (Untested but Crucial for Long-Term Trend Shifts)
No clear powerful resistance levels—why? Because price hasn’t been able to get off the floor. If any of the above resistance zones break, we’ll start identifying new supply areas up the chain.
Final Take
Right now, support is fragile, and resistance is strong—the worst combo for bulls. If these key levels don’t hold, expect them to become liquidity traps where sellers reload shorts. Stay disciplined, keep an eye on the order flow, and don’t chase fake breakouts. 🚀📉
Trading Strategies with Rays: Ride the Momentum Like a Pro
The VSA Rays mapped on the chart act as dynamic guide rails, shaping price movement with Fibonacci-based angles. These aren't static lines—rays adapt to new market conditions, forming high-probability trade zones where price is likely to react. Our job? Identify the reaction and catch the move from ray to ray.
Price will either reject or break through a ray, and once it starts moving, we trade from one key level to the next. Here’s how to play it smart:
Optimistic Scenario (Breakout & Momentum Play)
If URUSDT reclaims lost ground, key levels will start flipping bullish, allowing for trend continuation trades:
Entry at $0.003357 (First major resistance, potential ray interaction)
Target 1: $0.003543 (Next ray level, a solid take-profit zone)
Target 2: $0.004163 (If momentum sustains, a strong Fibonacci extension area)
Target 3: $0.004898 (Key resistance to watch, high R:R potential)
🔥 Confirmation: Look for a reaction at the 50-day MA ($0.003751). A breakout above confirms bullish bias.
Pessimistic Scenario (Fade the Rally & Short the Breakdown)
If the market fails to hold key support and gets rejected from resistance rays, we trade the downside:
Entry at $0.003357 (Short after a failed breakout)
Target 1: $0.002823 (The last meaningful support before collapse)
Target 2: $0.002749 (New absolute low, potential liquidity flush)
Target 3: $0.002500 (If sell pressure continues, extended short)
🔥 Confirmation: Watch for rejection off the 233-day MA ($0.004677)—if price gets slapped here, bears are in control.
Trade Opportunities Based on Ray Interactions
Ray to Ray Swing Trade: Enter after price interacts with a ray and confirms direction. Target the next ray in sequence.
Break & Retest Play: If price clears a major resistance ray, wait for the retest to enter long. If it fails to hold, fade the move.
Momentum Scalps: If price bounces hard off a support ray, grab quick profits at the next short-term resistance.
Liquidity Hunt Strategy: If price sweeps below $0.002749 and reclaims quickly, it’s a classic stop-run reversal—jump in long.
Final Take
URUSDT is a game of levels, and VSA rays are the navigation system. The strategy is simple—trade level to level, wait for confirmation, and ride momentum like a sniper, not a gambler. 🚀🔥
Alright, now it’s your turn—what’s your take on this setup? Drop your thoughts, questions, or alternative scenarios in the comments, and let’s break it all down together. Trading is all about learning, adapting, and spotting the right moves before they happen.
If this idea resonates with you, hit that Boost and save it to check back later—watch how price respects these levels and moves along the rays. This is the key to refining your entries and understanding where the real trades happen.
My indicator automatically maps out all the VSA Rays and levels in real-time, but it’s currently Private. If you’re interested in using it, send me a DM—we’ll figure something out.
Got a different asset you want analyzed? No problem! I can chart anything—some ideas I’ll share publicly, while others can be private if you prefer. If there’s a specific market you need mapped, Boost this post and drop a request in the comments—I’ll check it out when I can.
And of course, if you want more of this kind of deep-dive analysis, follow me here on TradingView—this is where all my setups go live. Let’s trade smart and make it happen. 🚀🔥
Prediction
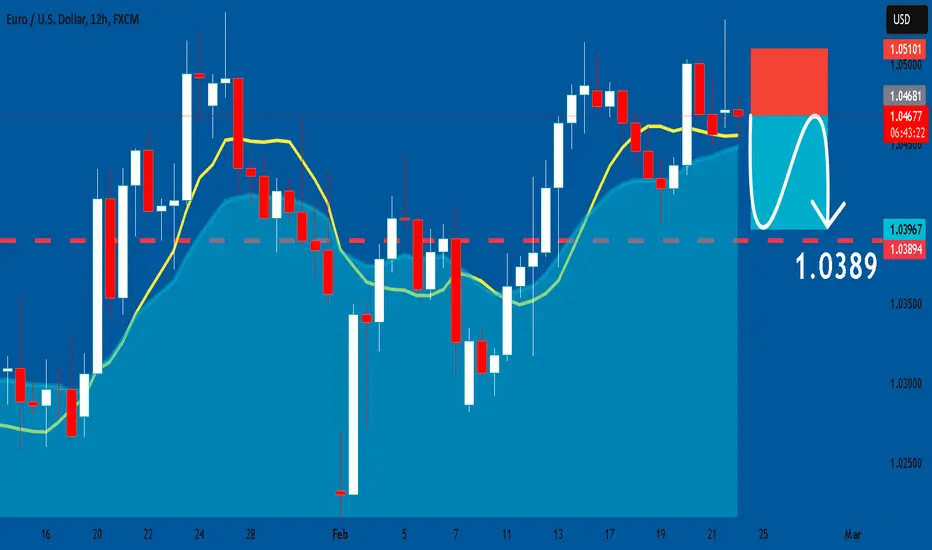
EURUSD: Short Signal Explained
EURUSD
- Classic bearish formation
- Our team expects pullback
SUGGESTED TRADE:
Swing Trade
Short EURUSD
Entry - 1.0468
Sl - 1.0510
Tp - 1.0389
Our Risk - 1%
Start protection of your profits from lower levels
❤️ Please, support our work with like & comment! ❤️
EURJPY: Bullish Continuation & Long Signal
EURJPY
- Classic bullish setup
- Our team expects bullish continuation
SUGGESTED TRADE:
Swing Trade
Long EURJPY
Entry Point - 156.16
Stop Loss - 155.09
Take Profit - 158.48
Our Risk - 1%
Start protection of your profits from lower levels
❤️ Please, support our work with like & comment! ❤️
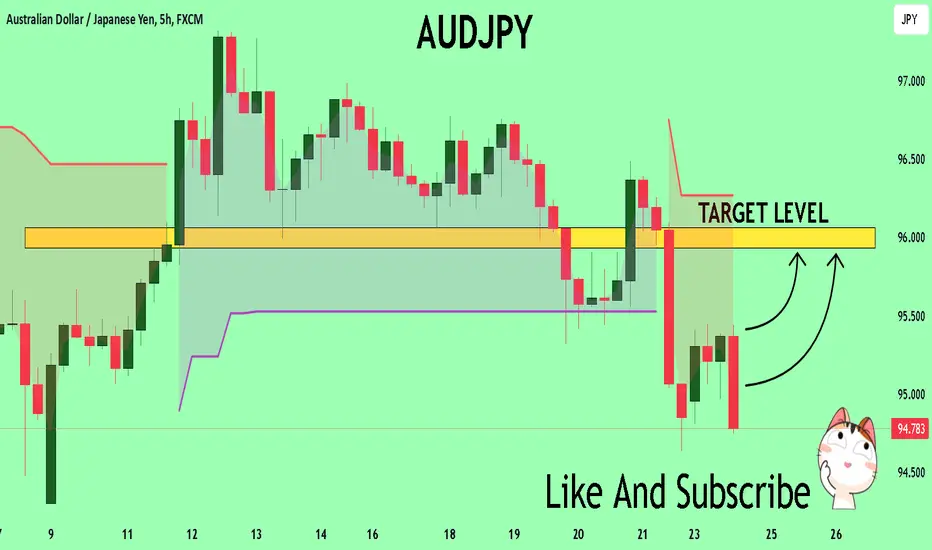
AUDJPY Trading Opportunity! BUY!
My dear subscribers,
My technical analysis for AUDJPY is below:
The price is coiling around a solid key level - 95.074
Bias - Bullish
Technical Indicators: Pivot Points Low anticipates a potential price reversal.
Super trend shows a clear buy, giving a perfect indicators' convergence.
Goal - 95.936
About Used Indicators:
By the very nature of the supertrend indicator, it offers firm support and resistance levels for traders to enter and exit trades. Additionally, it also provides signals for setting stop losses
———————————
WISH YOU ALL LUCK
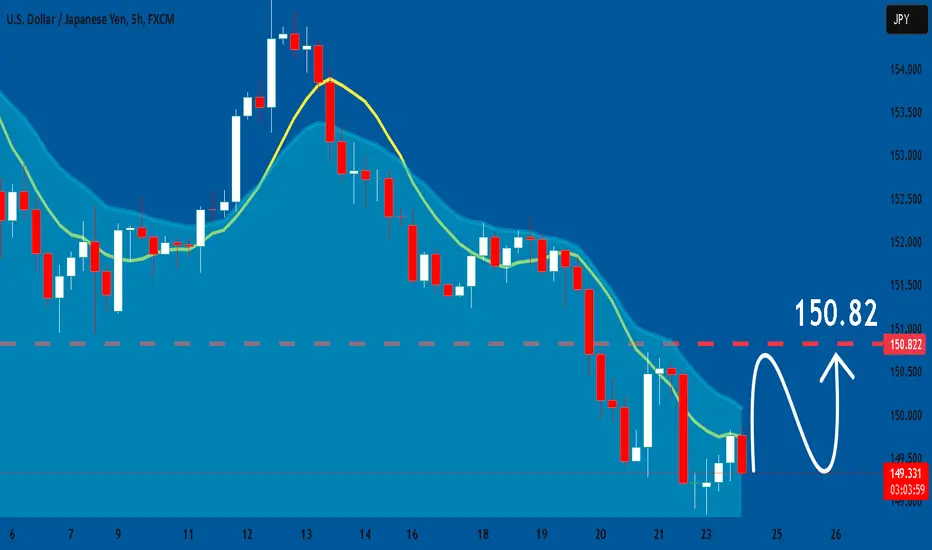
USDJPY: Market Sentiment & Forecast
Balance of buyers and sellers on the USDJPY pair, that is best felt when all the timeframes are analyzed properly is shifting in favor of the buyers, therefore is it only natural that we go long on the pair.
❤️ Please, support our work with like & comment! ❤️
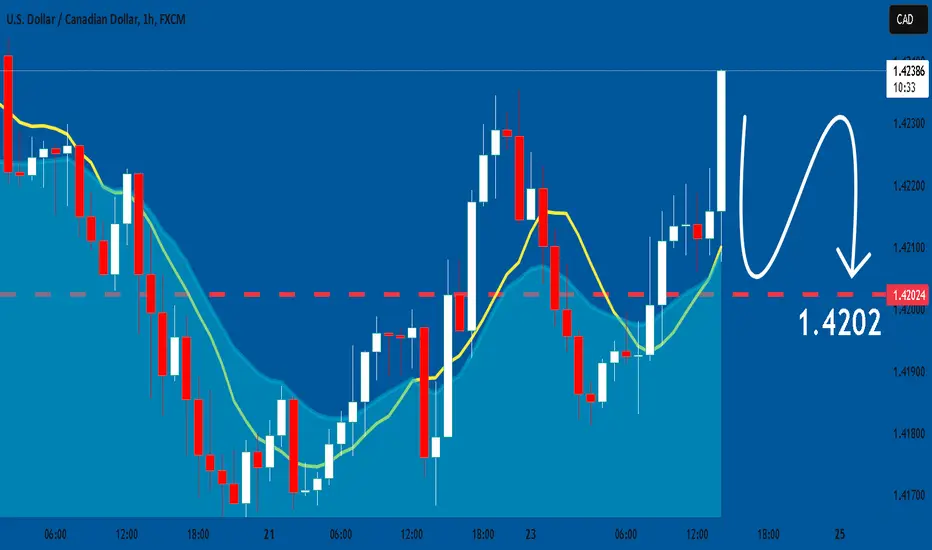
USDCAD: Bears Will Push Lower
The analysis of the USDCAD chart clearly shows us that the pair is finally about to tank due to the rising pressure from the sellers.
❤️ Please, support our work with like & comment! ❤️
1000000MOG: Is This the Last Chance to Buy Before a Breakout?The Moment of Decision: 1000000MOGUSDT at a Pivotal Crossroad
The crypto market is never short on surprises, and 1000000MOGUSDT is now in the spotlight. After tumbling 81.6% from its all-time high of $4.0531, the asset is showing signs of an imminent shift. Currently trading at $0.7458, it hovers near key resistance at $0.7693—a critical level that could define its next big move.
Technically, RSI (14) sits at 42.18, hinting at a potential reversal from oversold conditions. Meanwhile, MFI (60) has risen to 58.03, signaling increasing buying pressure. But is it enough for a breakout?
Recent VSA Buy Patterns suggest institutional accumulation, while yesterday's sell-off exhausted downward momentum. The battle between bulls and bears is heating up, and the next few sessions could set the tone for the coming weeks.
Could this be the final dip before an explosive move? Or will bears push it deeper into uncertainty? The answer lies in the price action around $0.7693—a breakout could bring a swift rally toward $0.8465 and beyond. Are you ready for what comes next?
1000000MOGUSDT Roadmap: The Pattern Trail to a Breakout
The market never moves in a straight line—it’s a battle of bulls and bears, and 1000000MOGUSDT is no exception. Let’s break down the key patterns that have shaped the recent price action, focusing only on those that played out as expected.
Feb 21, 17:00 UTC – Sell Volumes Max (Main Direction: Sell)
The heavy sell-off at $0.7875, closing at $0.7571, set the stage for a bearish move. The next pattern confirmed this sentiment, as buyers failed to regain control, pushing the price further down.
Feb 22, 18:00 UTC – VSA Sell Pattern 4 (Main Direction: Sell)
The textbook bearish setup worked like a charm. The price opened at $0.7996, attempted a push higher to $0.8191, but ultimately closed lower at $0.7870. This confirmed sellers’ dominance, setting the tone for further downside.
Feb 23, 15:00 UTC – Increased Sell Volumes (Main Direction: Sell)
Sell pressure kept building, with the price opening at $0.7823 and dropping to $0.7539. This was another clean confirmation that sellers were running the show.
Feb 24, 04:00 UTC – Sell Volumes Max (Main Direction: Sell)
Another bearish wave sent the price down to $0.7429, hitting a low of $0.7350. At this point, the market was looking oversold, but without a strong reversal pattern, buyers had no reason to step in.
Feb 24, 05:00 UTC – Sell Volumes Take Over (Main Direction: Buy)
Finally, a shift. The market bounced from $0.7383 to $0.7663, marking the first real attempt by buyers to flip the script. This pattern suggested a potential trend reversal—but was it enough?
The verdict? The last confirmed buy signal indicates that 1000000MOGUSDT may have hit a local bottom. With resistance looming at $0.7693, a breakout above this level could trigger a trend reversal, bringing bulls back into the game.
Technical & Price Action Analysis
When it comes to 1000000MOGUSDT, the game is all about key levels. Respect them, and you ride the wave. Ignore them, and you're swimming against the current. Here's what matters right now:
Resistance Levels:
$0.7693 – First major barrier; a breakout here could confirm bullish strength.
$0.8465 – If buyers take control, this is the next checkpoint.
$1.0149 – A key psychological level, marking a major shift in momentum.
$1.4334 – If we get here, expect serious volatility.
$1.9514 – The final boss before reclaiming lost highs.
Powerful Resistance Levels:
$0.5326 – If the market tanks, this level flips to a strong resistance on any rebound attempt.
Support Levels:
Watch for potential bounces, but if these levels don’t hold, they turn into resistance real quick.
Powerful Support Levels:
$2.1798 – A level too far now, but if we ever reclaim it, the game changes entirely.
Bottom line: if $0.7693 gives way, $0.8465 is on the radar. But if we break down, $0.5326 could become a serious problem for any recovery. Stay sharp, follow the levels, and trade with conviction.
Trading Strategies Using Rays: Optimistic & Pessimistic Scenarios
Concept of Rays: The market is a living system, and price moves dynamically within it. My proprietary method uses Fibonacci-based rays, which create adaptive levels that predict interactions between price and key zones. These rays don’t provide a static price target but act as guides—once price interacts with a ray, we wait for dynamic confirmations (patterns, volumes, and price action) before making a trade. Each movement extends from one ray to another, forming a structured, mathematically predictable path.
Optimistic Scenario: Bullish Movement from Support
If price confirms support at a key level and interacts positively with a VSA ray, we look for a continuation upward:
Entry: Buy on a strong bounce from $0.7458 with confirmation from VSA patterns.
First Target: $0.7693 (first major resistance & ray intersection).
Second Target: $0.8465 (continuation if the first breakout holds).
Third Target: $1.0149 (strong psychological level, potential liquidity grab).
Dynamic Factors Supporting the Trade:
Moving Averages (MA50: 0.783, MA100: 0.7757, MA200: 0.7807) act as additional resistance points—watch for price interaction at these levels before continuation.
RSI (42.18) is still in a neutral zone but could flip bullish if price holds above MA100.
MFI (58.03) suggests growing demand, adding strength to a breakout.
Pessimistic Scenario: Bearish Breakdown Below Support
If price fails to hold key levels, sellers regain control, and we shift to a shorting mindset:
Entry: Short after rejection from $0.7693, confirming downward momentum.
First Target: $0.7458 (previous support turned resistance).
Second Target: $0.5326 (historical powerful resistance that could flip to strong support).
Third Target: $0.4999 (absolute low, potential liquidity hunt).
Dynamic Factors Confirming the Short Trade:
Failure to break MA100 and MA200 signals continued bearish trend.
RSI below 40 would confirm oversold conditions, increasing downside pressure.
If volume spikes on a breakdown, it suggests institutional distribution rather than weak hands selling.
Key Trading Playbook
Buy on confirmed interaction with a bullish ray at $0.7458, ride to $0.7693.
Sell if price rejects $0.7693 with weak volume—target $0.7458 or $0.5326.
Breakout trade: If $0.8465 is taken out with momentum, next stop is $1.0149.
Short if price collapses under $0.7458, aiming for $0.5326.
Bottom line: Every move starts with a ray and follows a ray. Let the price confirm the interaction, then ride the wave.
Call to Action: Let’s Talk Trading!
Alright, traders, now it’s your move! 🚀 If you have questions, insights, or just want to discuss the setup, drop a comment below—I read everything and respond when I can. Let’s break this market down together!
🔥 Hit that Boost and save this post to check back later—watch how price respects the levels and rays in real time. Trading is all about understanding key reaction zones, and if my analysis helps you see them clearer, that’s already a win.
My ray-based strategy automatically plots all key levels based on price action and Fibonacci principles. It’s available only in Private, but if you’re interested in using it, send me a direct message, and we’ll talk.
Need analysis on another asset? No problem. Some things I post publicly, others—if you prefer—stay private. Just let me know what you’re looking for, and we’ll figure it out.
My rays work on any asset, and price moves according to them—it’s just how the market flows. If you have a specific ticker you want mapped out, Boost this post and drop it in the comments—I’ll get to it as time allows.
And don’t forget to follow me here on TradingView—this is where I post my setups, updates, and market insights. Let’s trade smart. See you in the comments! 📈🔥

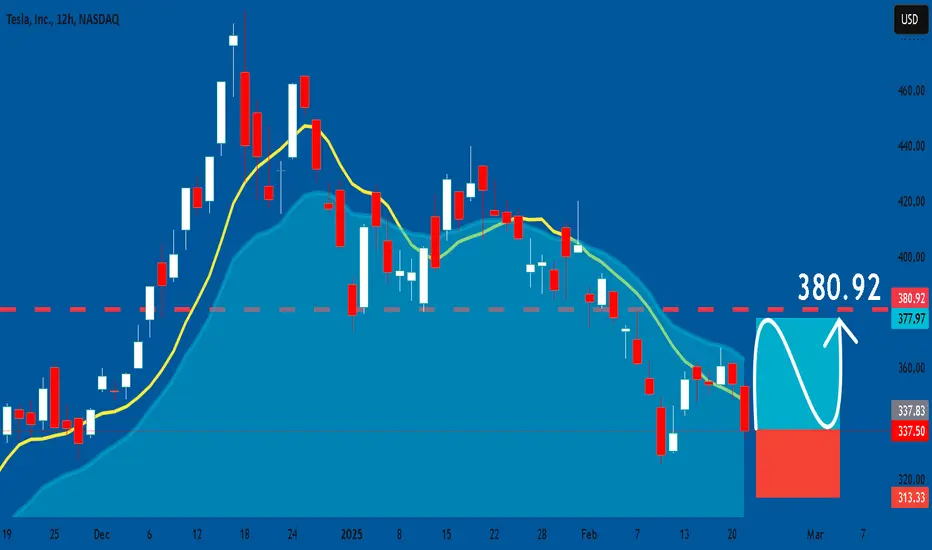
TESLA: Long Trading Opportunity
TESLA
- Classic bullish formation
- Our team expects pullback
SUGGESTED TRADE:
Swing Trade
Long TESLA
Entry - 337.50
Sl - 313.33
Tp - 380.92
Our Risk - 1%
Start protection of your profits from lower levels
❤️ Please, support our work with like & comment! ❤️
NATGAS: Short Trade with Entry/SL/TP
NATGAS
- Classic bearish setup
- Our team expects bearish continuation
SUGGESTED TRADE:
Swing Trade
Short NATGAS
Entry Point - 4.257
Stop Loss - 4.470
Take Profit - 3.881
Our Risk - 1%
Start protection of your profits from lower levels
❤️ Please, support our work with like & comment! ❤️

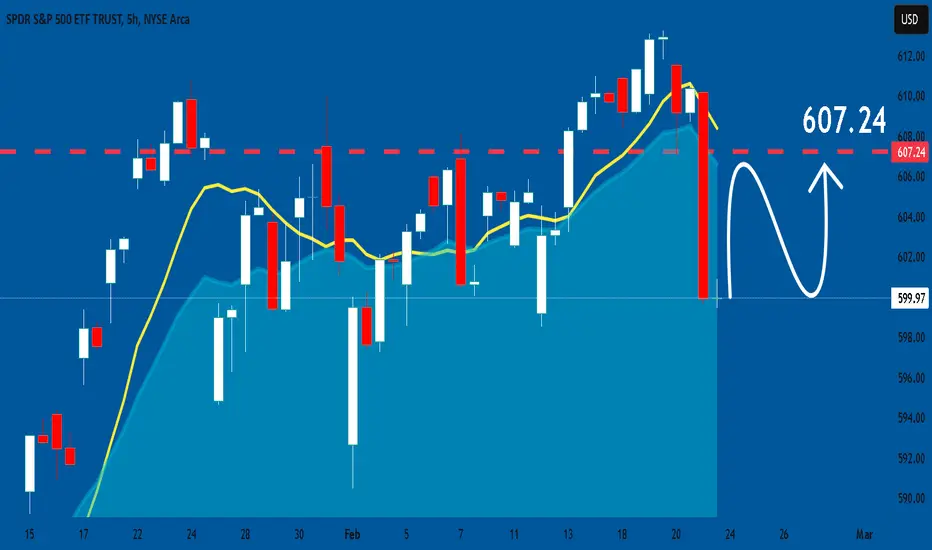
SPY: Market of Buyers
The charts are full of distraction, disturbance and are a graveyard of fear and greed which shall not cloud our judgement on the current state of affairs in the SPY pair price action which suggests a high likelihood of a coming move up.
❤️ Please, support our work with like & comment! ❤️
SILVER: Will Keep Growing! Here is Why:
The price of SILVER will most likely increase soon enough, due to the demand beginning to exceed supply which we can see by looking at the chart of the pair.
❤️ Please, support our work with like & comment! ❤️

APPLE: Bearish Continuation & Short Signal
APPLE
- Classic bearish formation
- Our team expects fall
SUGGESTED TRADE:
Swing Trade
Sell APPLE
Entry Level - 245.60
Sl - 251.83
Tp - 233.21
Our Risk - 1%
Start protection of your profits from lower levels
❤️ Please, support our work with like & comment! ❤️

USOIL: Long Trade with Entry/SL/TP
USOIL
- Classic bullish formation
- Our team expects pullback
SUGGESTED TRADE:
Swing Trade
Long USOIL
Entry - 70.18
Sl - 69.54
Tp - 71.51
Our Risk - 1%
Start protection of your profits from lower levels
❤️ Please, support our work with like & comment! ❤️

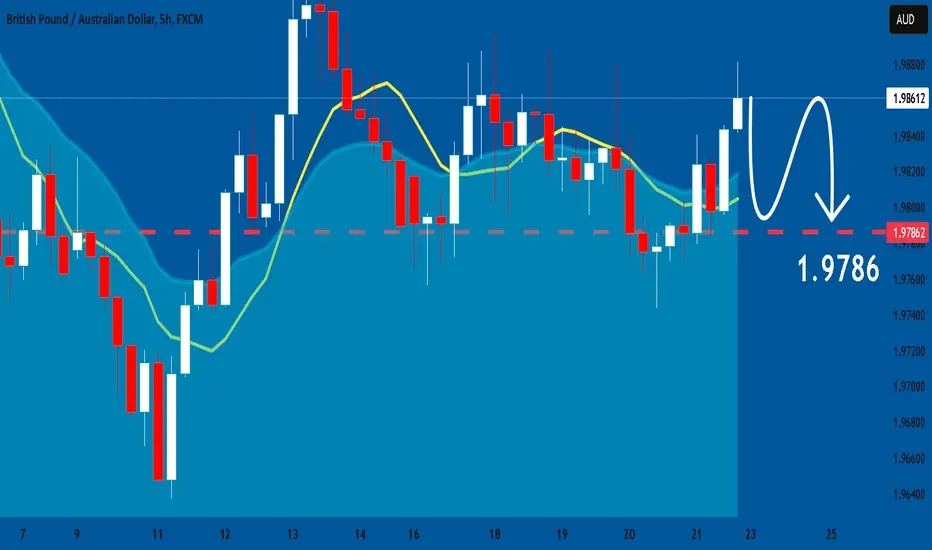
GBPAUD: Bearish Forecast & Outlook
The recent price action on the GBPAUD pair was keeping me on the fence, however, my bias is slowly but surely changing into the bullish one and I think we will see the price go up.
❤️ Please, support our work with like & comment! ❤️
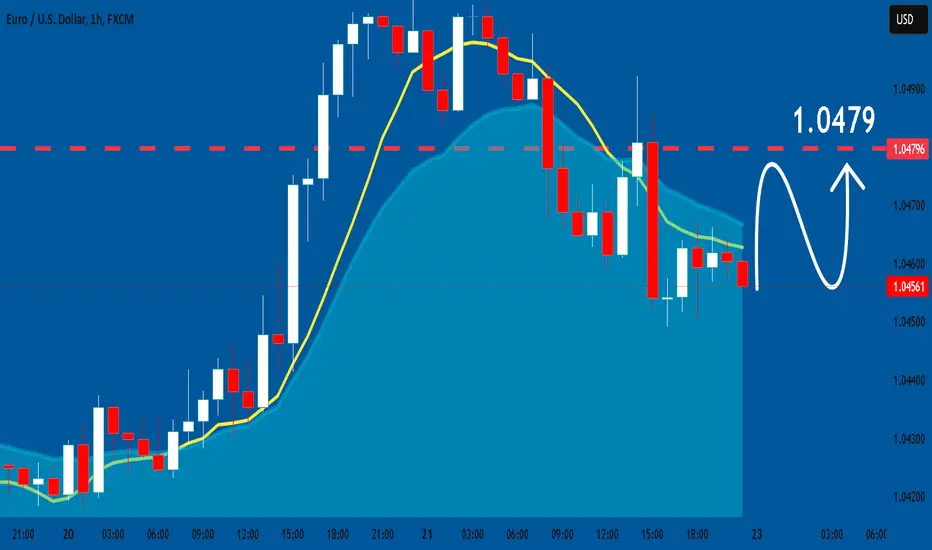
EURUSD: Bulls Will Push
Our strategy, polished by years of trial and error has helped us identify what seems to be a great trading opportunity and we are here to share it with you as the time is ripe for us to buy EURUSD.
❤️ Please, support our work with like & comment! ❤️
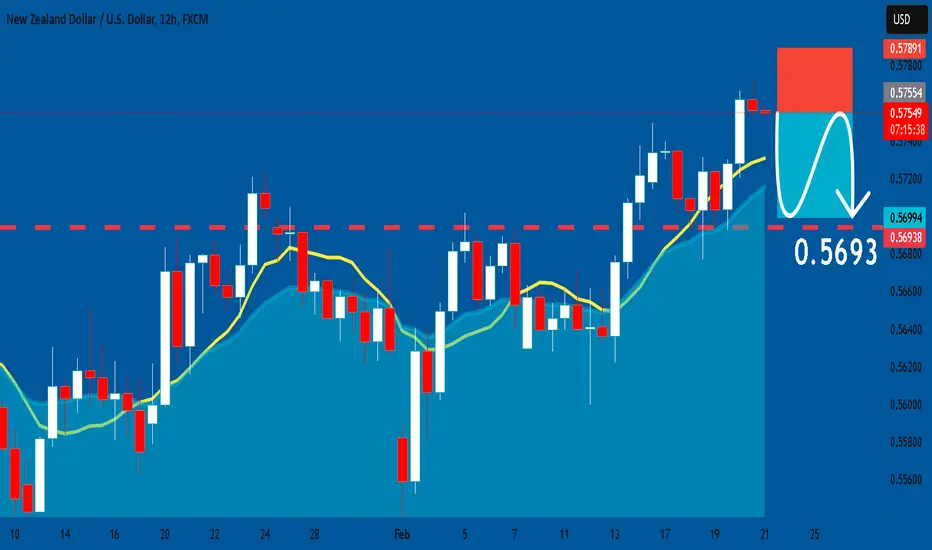
NZDUSD: Short Trading Opportunity
NZDUSD
- Classic bearish pattern
- Our team expects retracement
SUGGESTED TRADE:
Swing Trade
Sell NZDUSD
Entry - 0.5755
Stop - 0.5789
Take - 0.5693
Our Risk - 1%
Start protection of your profits from lower levels
❤️ Please, support our work with like & comment! ❤️
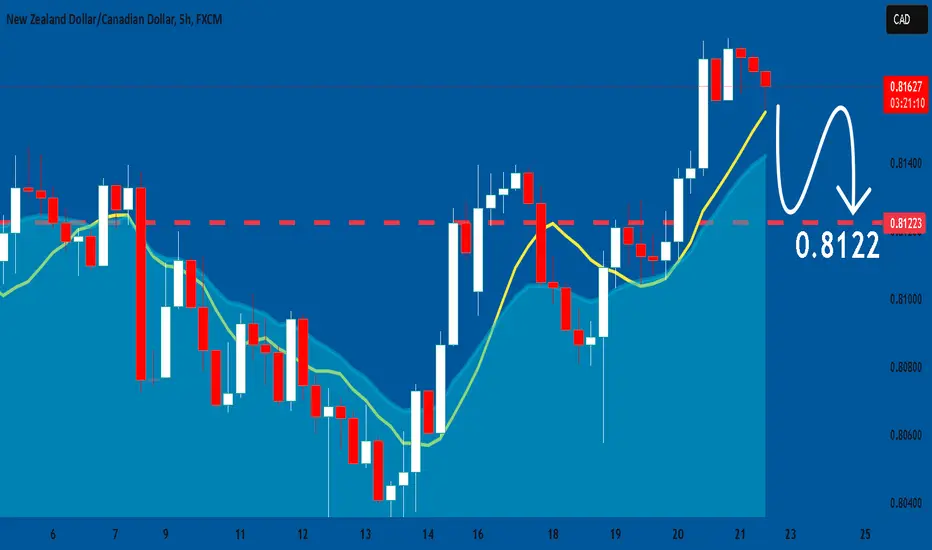
NZDCAD: Bearish Continuation is Expected! Here is Why:
Looking at the chart of NZDCAD right now we are seeing some interesting price action on the lower timeframes. Thus a local move down seems to be quite likely.
❤️ Please, support our work with like & comment! ❤️
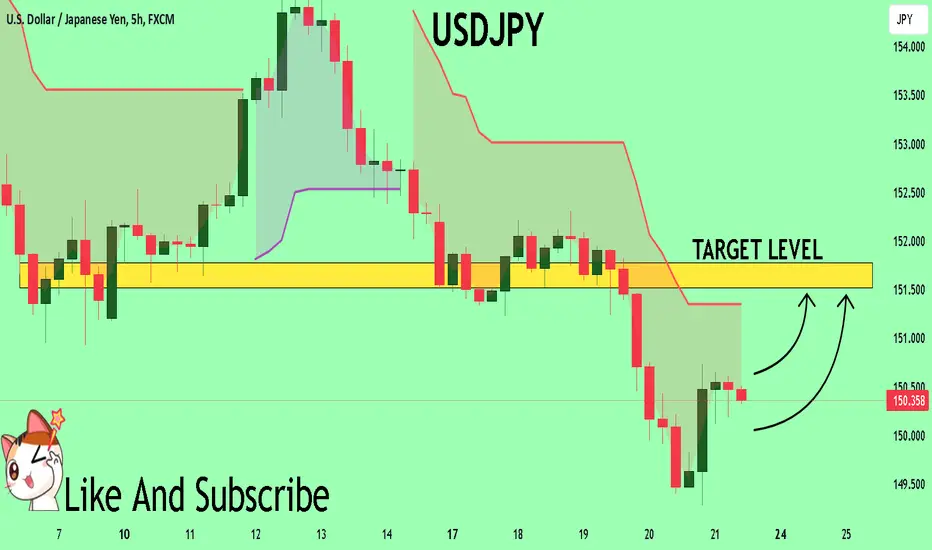
USDJPY Set To Grow! BUY!
My dear followers,
This is my opinion on theUSDJPY next move:
The asset is approaching an important pivot point 150.36
Bias - Bullish
Technical Indicators: Supper Trend generates a clear long signal while Pivot Point HL is currently determining the overall Bullish trend of the market.
Goal - 151.52
About Used Indicators:
For more efficient signals, super-trend is used in combination with other indicators like Pivot Points.
———————————
WISH YOU ALL LUCK
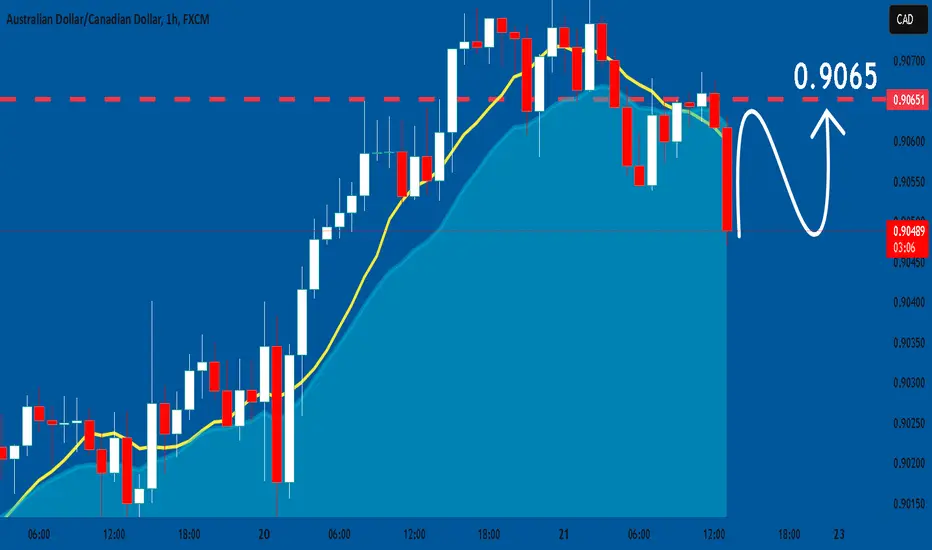
AUDCAD: Bullish Continuation
It is essential that we apply multitimeframe technical analysis and there is no better example of why that is the case than the current AUDCAD chart which, if analyzed properly, clearly points in the upward direction.
❤️ Please, support our work with like & comment! ❤️
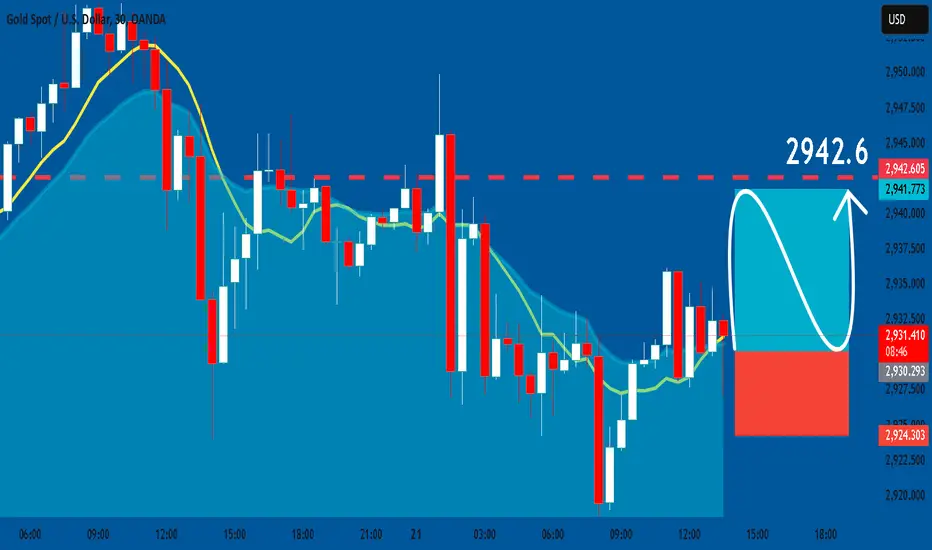
GOLD: Bullish Continuation & Long Trade
GOLD
- Classic bullish pattern
- Our team expects retracement
SUGGESTED TRADE:
Swing Trade
Buy GOLD
Entry - 2930.2
Stop - 2924.3
Take - 2942.6
Our Risk - 1%
Start protection of your profits from lower levels
❤️ Please, support our work with like & comment! ❤️
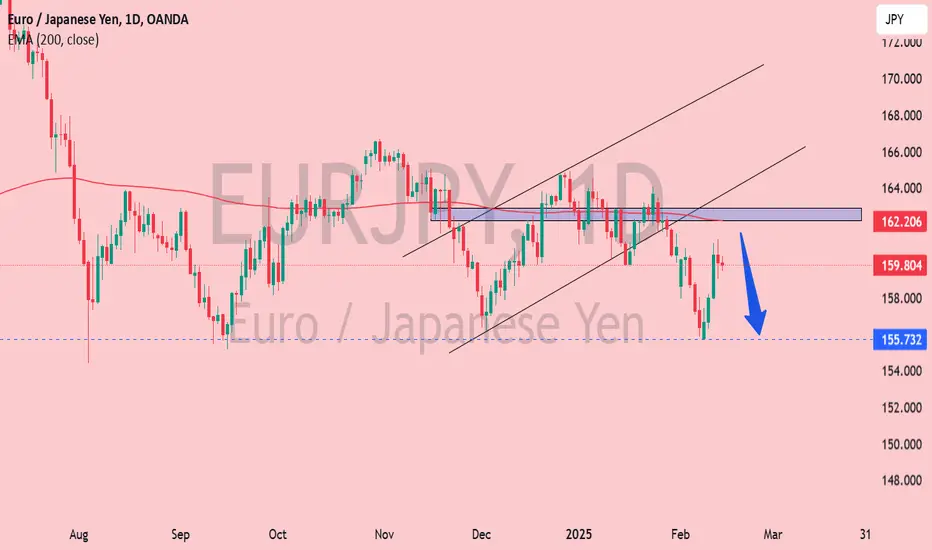
EUR/JPY Bearish Setup | Rejection from 200 EMA & Supply ZoneEUR/JPY Analysis (Daily Timeframe) 📉🔥
Key Observations:
Price at 159.804 (-0.07%), showing minor bearish sentiment.
200 EMA Resistance (162.206) 🚧
Price previously rejected from this level, reinforcing it as a strong resistance zone.
Bearish Retest of Supply Zone (162.000 - 162.500) 🛑
Price attempted to break above but failed, leading to rejection and a move downward.
Breakout from Ascending Channel 📉
Price previously followed an upward trend but broke below, signaling a shift to bearish momentum.
Target at 155.732 (Next Support) 🎯
A blue arrow suggests an expected drop toward this key support.
Bias: Bearish 📉
Confirmation: If price fails to reclaim 160.500, further downside is likely.
Bearish Entry: Below 159.500 with a target at 155.732.
Invalidation: A daily close above 162.200 would shift bias to bullish.
🚨 Watch for rejection candles or strong bearish momentum for a sell setup! 🚨
EURNZD: Long Signal Explained
EURNZD
- Classic bullish setup
- Our team expects bullish continuation
SUGGESTED TRADE:
Swing Trade
Long EURNZD
Entry Point - 1.8203
Stop Loss - 1.8150
Take Profit - 1.8302
Our Risk - 1%
Start protection of your profits from lower levels
❤️ Please, support our work with like & comment! ❤️

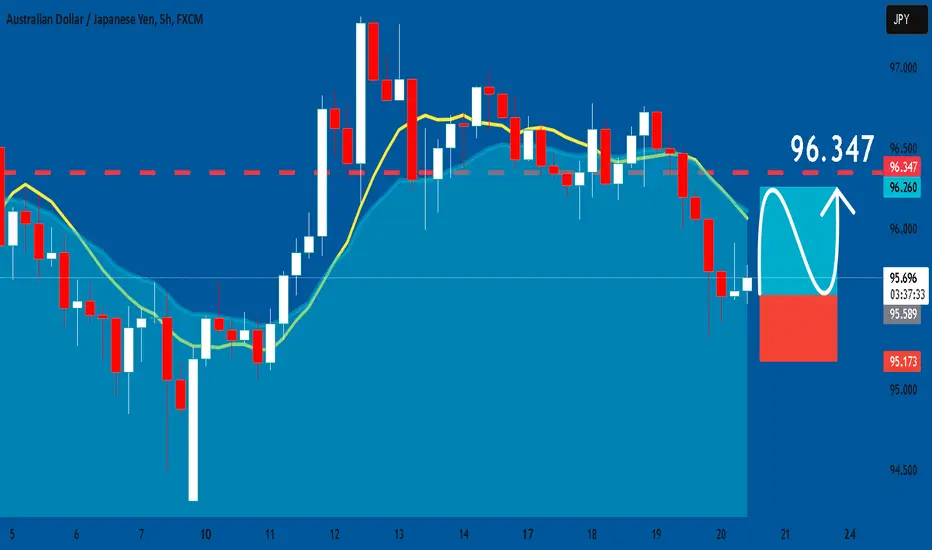
AUDJPY: Long Signal with Entry/SL/TP
AUDJPY
- Classic bullish formation
- Our team expects growth
SUGGESTED TRADE:
Swing Trade
Buy AUDJPY
Entry Level - 96.594
Sl - 95.173
Tp - 96.347
Our Risk - 1%
Start protection of your profits from lower levels
❤️ Please, support our work with like & comment! ❤️