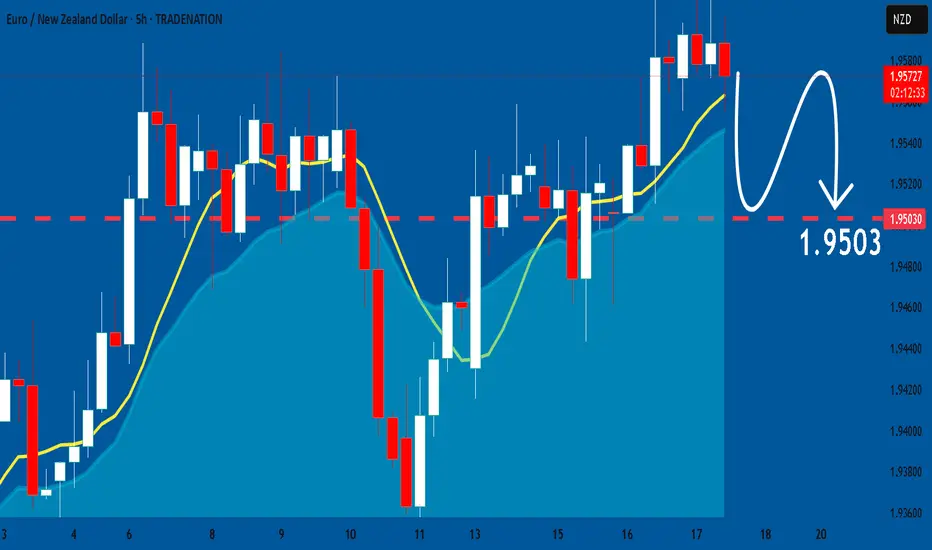
EURNZD: Bearish Forecast & Bearish Scenario
The analysis of the EURNZD chart clearly shows us that the pair is finally about to tank due to the rising pressure from the sellers.
Disclosure: I am part of Trade Nation's Influencer program and receive a monthly fee for using their TradingView charts in my analysis.
❤️ Please, support our work with like & comment! ❤️
Prediction
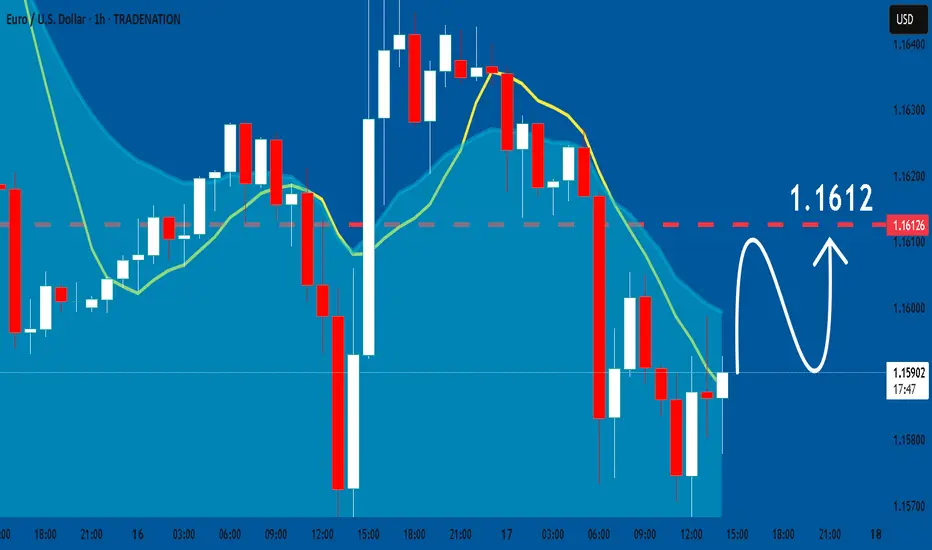
EURUSD: Bulls Will Push
Balance of buyers and sellers on the EURUSD pair, that is best felt when all the timeframes are analyzed properly is shifting in favor of the buyers, therefore is it only natural that we go long on the pair.
Disclosure: I am part of Trade Nation's Influencer program and receive a monthly fee for using their TradingView charts in my analysis.
❤️ Please, support our work with like & comment! ❤️
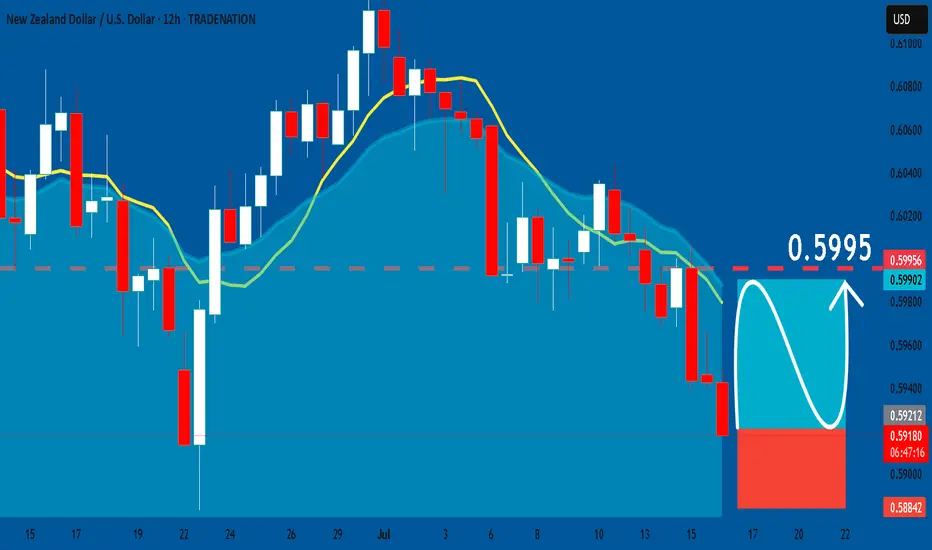
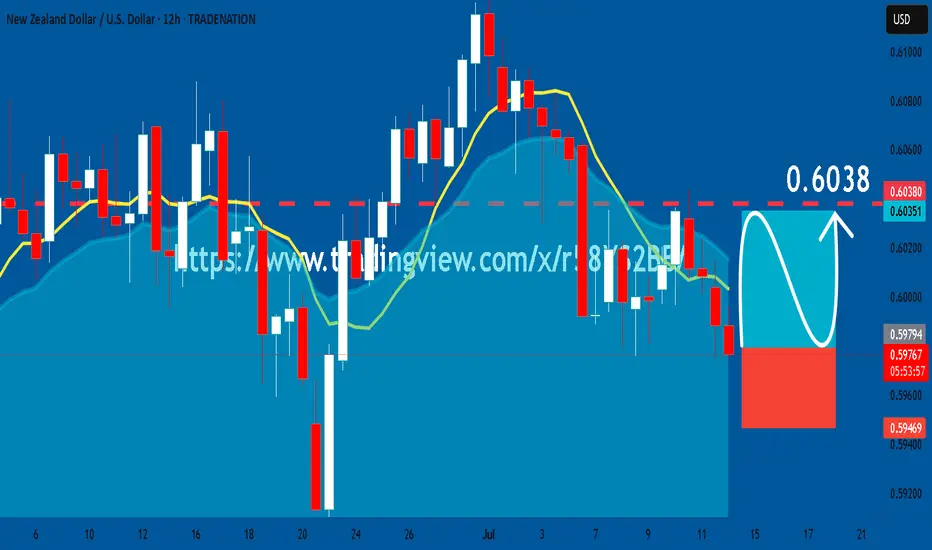
NZDUSD: Bullish Continuation & Long Signal
NZDUSD
- Classic bullish setup
- Our team expects bullish continuation
SUGGESTED TRADE:
Swing Trade
Long NZDUSD
Entry Point - 0.5922
Stop Loss - 0.5884
Take Profit - 0.5995
Our Risk - 1%
Start protection of your profits from lower levels
Disclosure: I am part of Trade Nation's Influencer program and receive a monthly fee for using their TradingView charts in my analysis.
❤️ Please, support our work with like & comment! ❤️
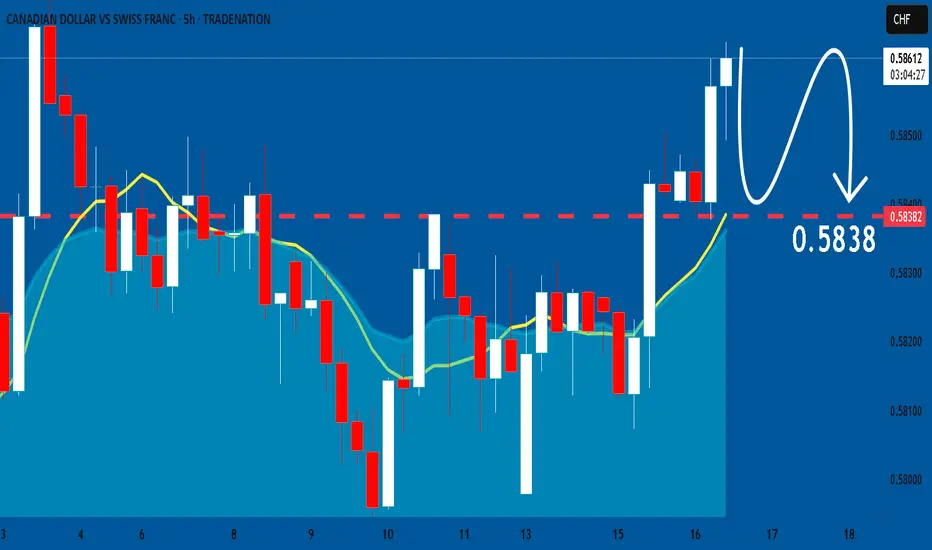
CADCHF: Bearish Continuation
Looking at the chart of CADCHF right now we are seeing some interesting price action on the lower timeframes. Thus a local move down seems to be quite likely.
Disclosure: I am part of Trade Nation's Influencer program and receive a monthly fee for using their TradingView charts in my analysis.
❤️ Please, support our work with like & comment! ❤️
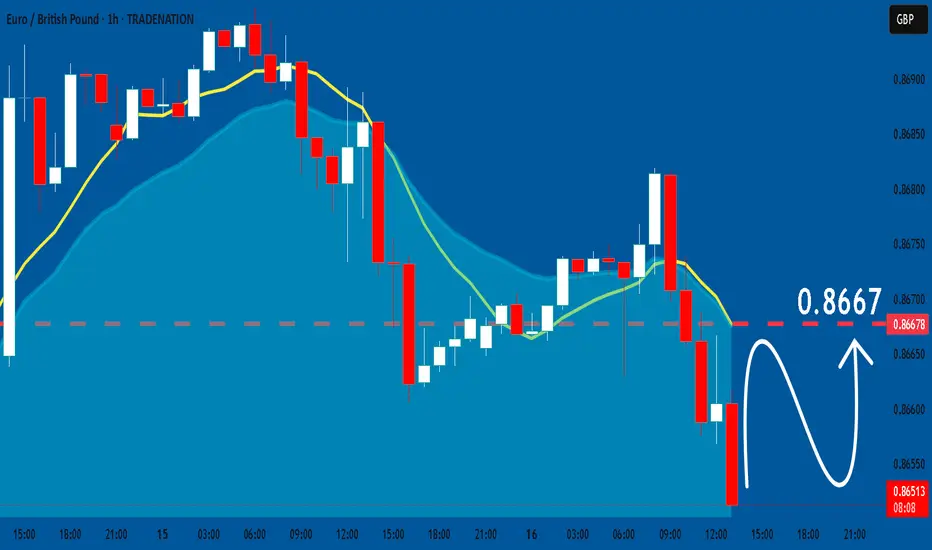
EURGBP: Expecting Bullish Movement! Here is Why:
The charts are full of distraction, disturbance and are a graveyard of fear and greed which shall not cloud our judgement on the current state of affairs in the EURGBP pair price action which suggests a high likelihood of a coming move up.
Disclosure: I am part of Trade Nation's Influencer program and receive a monthly fee for using their TradingView charts in my analysis.
❤️ Please, support our work with like & comment! ❤️
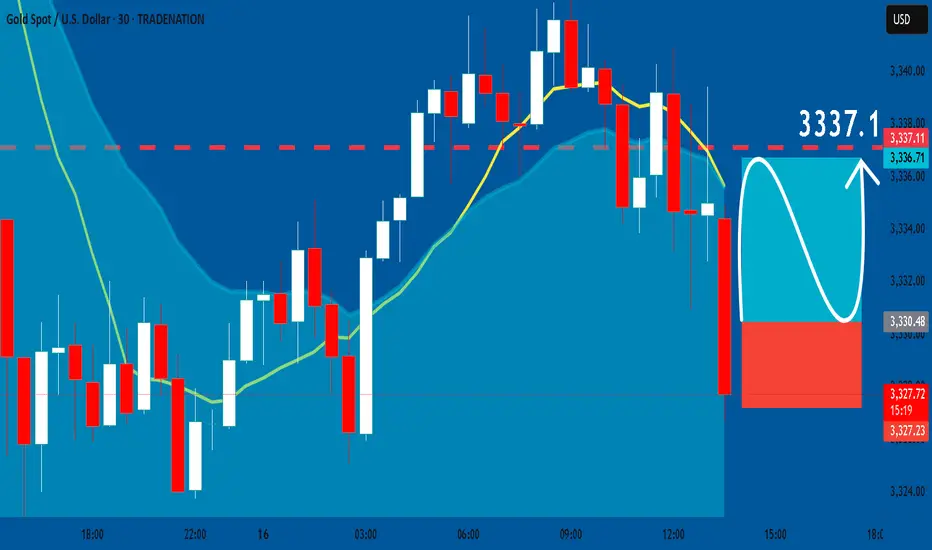
GOLD: Long Trading Opportunity
GOLD
- Classic bullish formation
- Our team expects growth
SUGGESTED TRADE:
Swing Trade
Buy GOLD
Entry Level - 3330.3
Sl - 3327.23
Tp - 3337.1
Our Risk - 1%
Start protection of your profits from lower levels
Disclosure: I am part of Trade Nation's Influencer program and receive a monthly fee for using their TradingView charts in my analysis.
❤️ Please, support our work with like & comment! ❤️
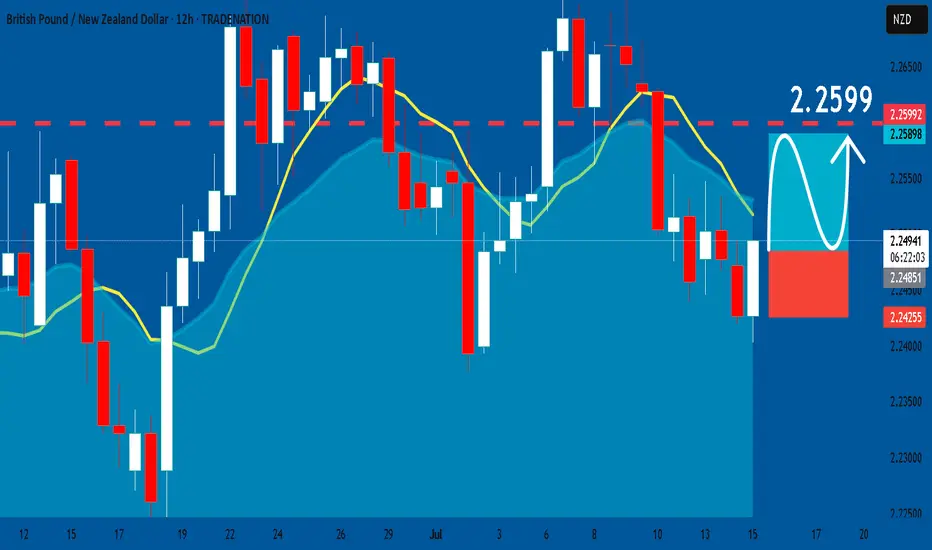
GBPNZD: Long Trade Explained
GBPNZD
- Classic bullish formation
- Our team expects pullback
SUGGESTED TRADE:
Swing Trade
Long GBPNZD
Entry - 2.2484
Sl - 2.2425
Tp - 2.2599
Our Risk - 1%
Start protection of your profits from lower levels
Disclosure: I am part of Trade Nation's Influencer program and receive a monthly fee for using their TradingView charts in my analysis.
❤️ Please, support our work with like & comment! ❤️
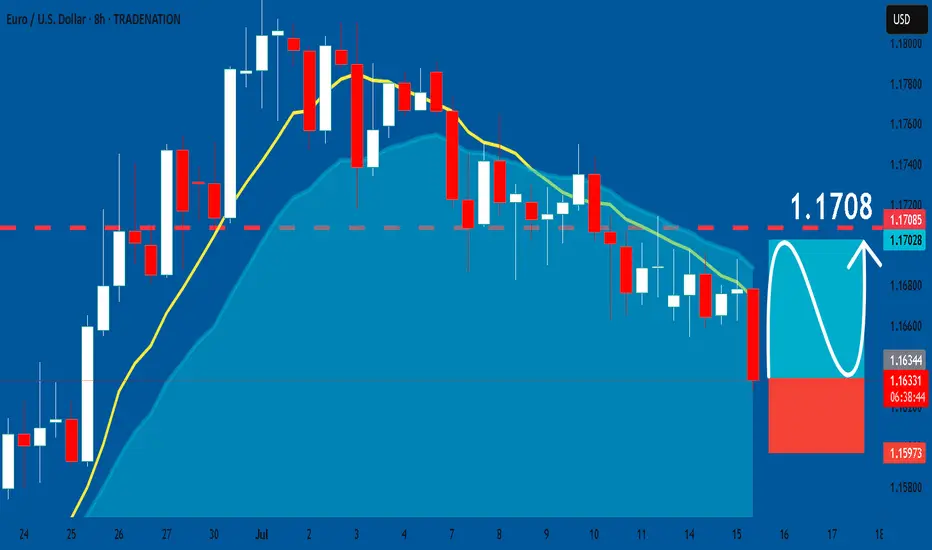
EURUSD: Long Trade with Entry/SL/TP
EURUSD
- Classic bullish pattern
- Our team expects retracement
SUGGESTED TRADE:
Swing Trade
Buy EURUSD
Entry - 1.1635
Stop - 1.1597
Take - 1.1708
Our Risk - 1%
Start protection of your profits from lower levels
Disclosure: I am part of Trade Nation's Influencer program and receive a monthly fee for using their TradingView charts in my analysis.
❤️ Please, support our work with like & comment! ❤️
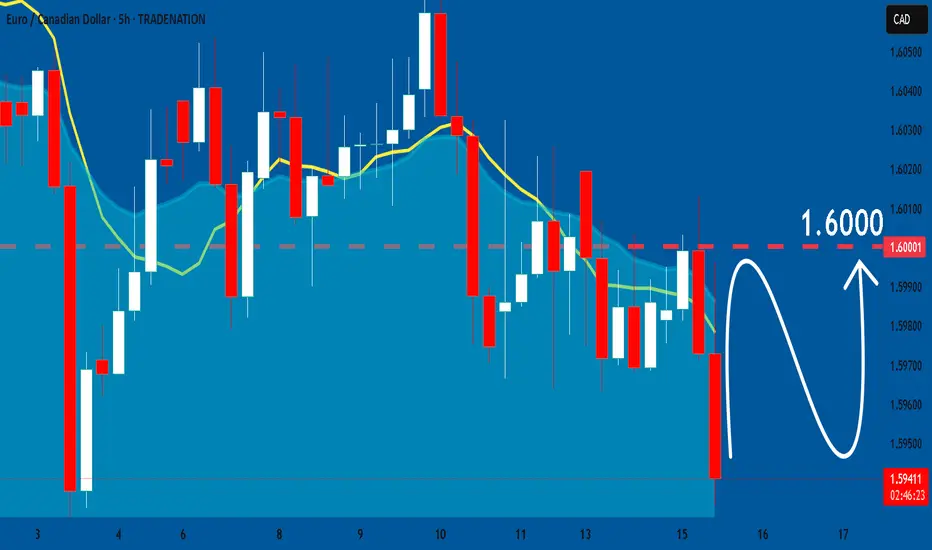
EURCAD: Bullish Forecast & Bullish Scenario
The price of EURCAD will most likely increase soon enough, due to the demand beginning to exceed supply which we can see by looking at the chart of the pair.
Disclosure: I am part of Trade Nation's Influencer program and receive a monthly fee for using their TradingView charts in my analysis.
❤️ Please, support our work with like & comment! ❤️
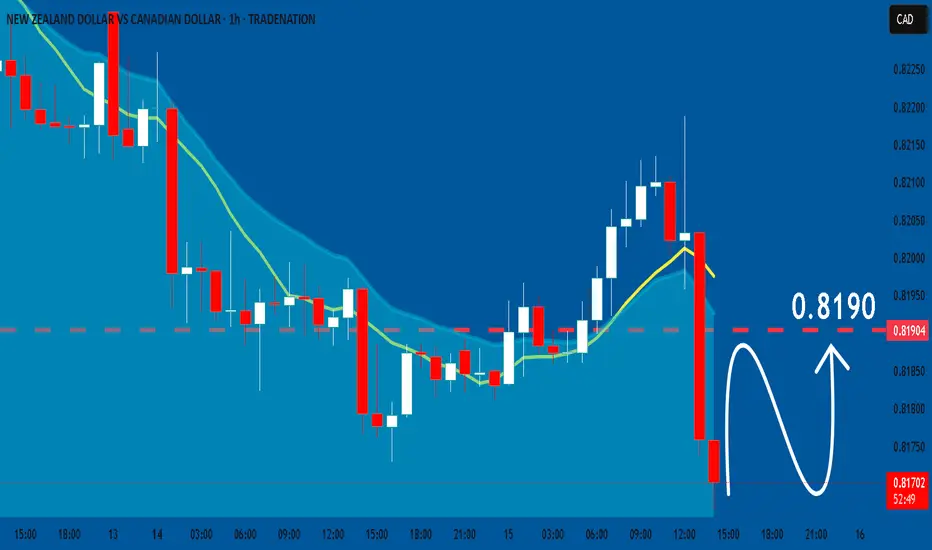
NZDCAD: Will Start Growing! Here is Why:
Our strategy, polished by years of trial and error has helped us identify what seems to be a great trading opportunity and we are here to share it with you as the time is ripe for us to buy NZDCAD.
Disclosure: I am part of Trade Nation's Influencer program and receive a monthly fee for using their TradingView charts in my analysis.
❤️ Please, support our work with like & comment! ❤️
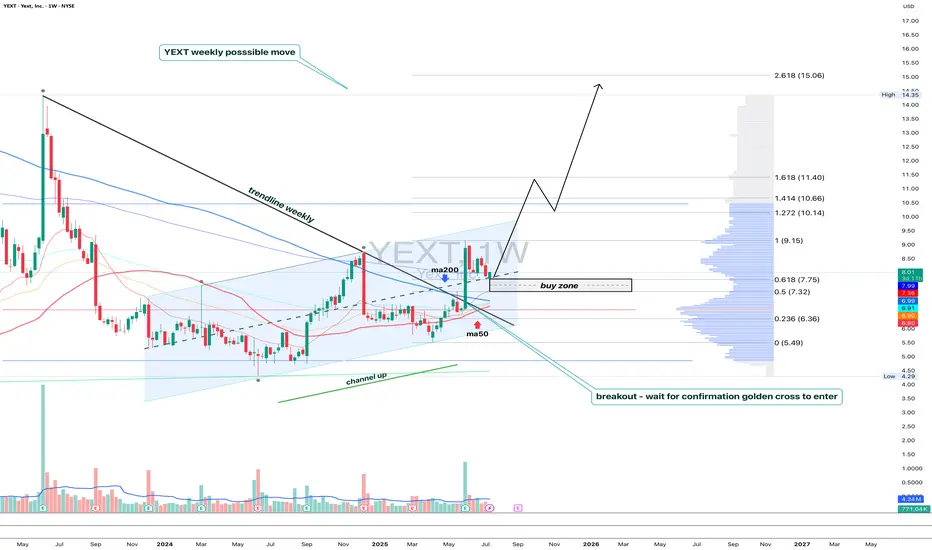
YEXT 1W - breakout confirmed, retest inside bullish channelYext stock just pulled a clean breakout of the weekly downtrend line, retested the buy zone around the 0.5 Fibo level ($7.32), and is now bouncing within a rising channel. The 200MA and 50EMA are both below price, supporting a shift in trend even though the golden cross hasn’t formed yet. The volume increased on breakout, and there's low overhead supply - a classic setup for continuation. The arrow shows the expected move, contingent on confirmation.
Targets: 9.15 - 11.40 - 15.06
Fundamentally, Yext offers enterprise-grade AI-powered search solutions and recently gained attention with new product updates. With AI adoption accelerating, the company may ride the next wave of institutional interest.
When price retests the zone, MA is supportive, and there's no overhead resistance - that’s not noise, that’s a signal.
NZDUSD: Bullish Continuation & Long Trade
NZDUSD
- Classic bullish setup
- Our team expects bullish continuation
SUGGESTED TRADE:
Swing Trade
Long NZDUSD
Entry Point - 0.5978
Stop Loss - 0.5946
Take Profit - 0.6038
Our Risk - 1%
Start protection of your profits from lower levels
Disclosure: I am part of Trade Nation's Influencer program and receive a monthly fee for using their TradingView charts in my analysis.
❤️ Please, support our work with like & comment! ❤️
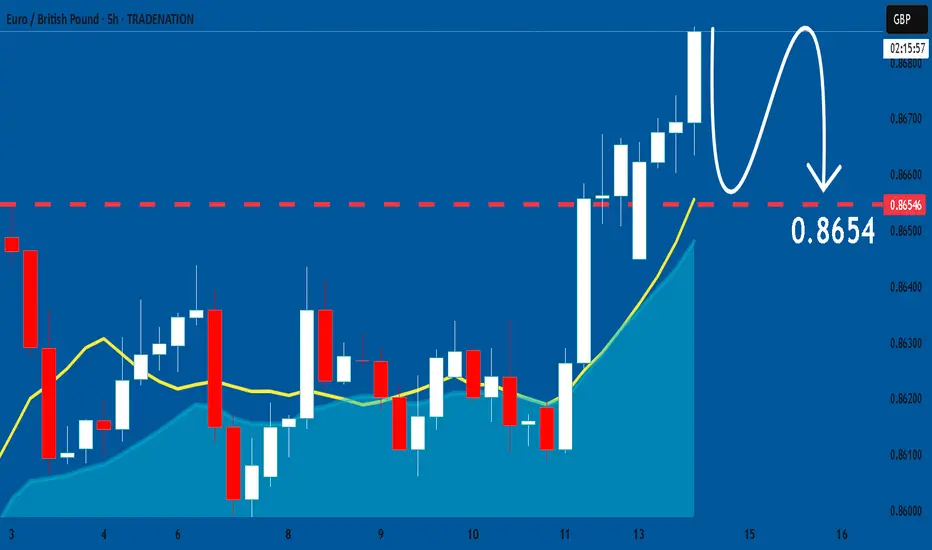
EURGBP: Bears Will Push Lower
Remember that we can not, and should not impose our will on the market but rather listen to its whims and make profit by following it. And thus shall be done today on the EURGBP pair which is likely to be pushed down by the bears so we will sell!
Disclosure: I am part of Trade Nation's Influencer program and receive a monthly fee for using their TradingView charts in my analysis.
❤️ Please, support our work with like & comment! ❤️
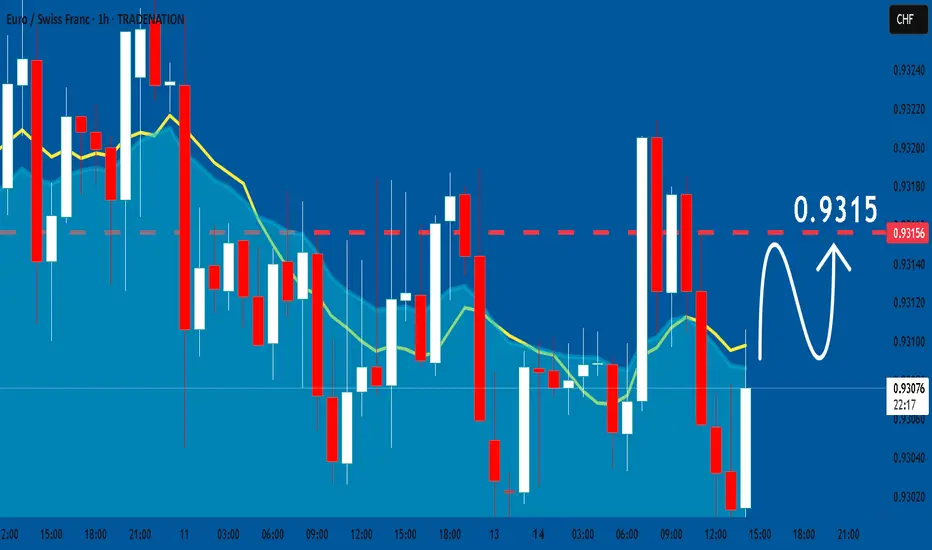
EURCHF: Bullish Forecast & Bullish Scenario
The recent price action on the EURCHF pair was keeping me on the fence, however, my bias is slowly but surely changing into the bullish one and I think we will see the price go up.
Disclosure: I am part of Trade Nation's Influencer program and receive a monthly fee for using their TradingView charts in my analysis.
❤️ Please, support our work with like & comment! ❤️
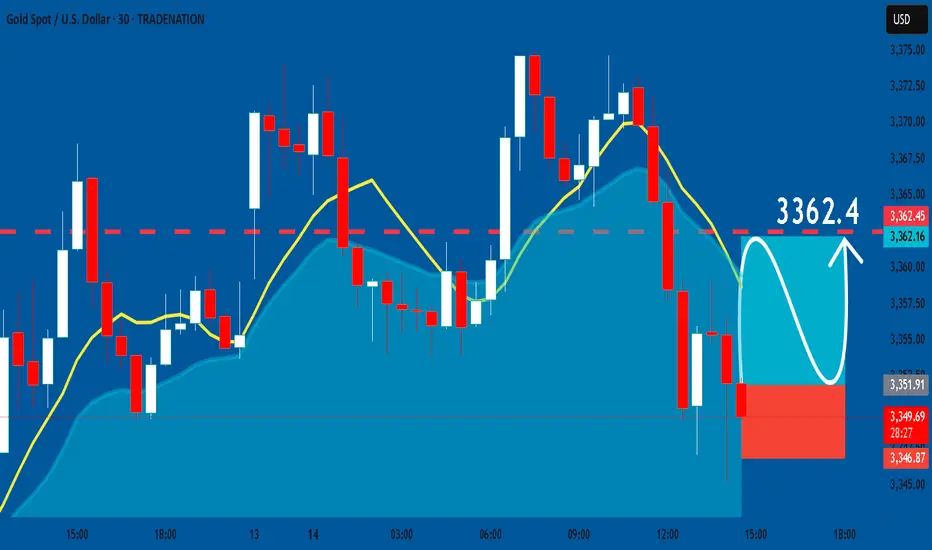
GOLD: Long Signal Explained
GOLD
- Classic bullish formation
- Our team expects growth
SUGGESTED TRADE:
Swing Trade
Buy GOLD
Entry Level - 3352.0
Sl - 3346.8
Tp - 3362.4
Our Risk - 1%
Start protection of your profits from lower levels
Disclosure: I am part of Trade Nation's Influencer program and receive a monthly fee for using their TradingView charts in my analysis.
❤️ Please, support our work with like & comment! ❤️
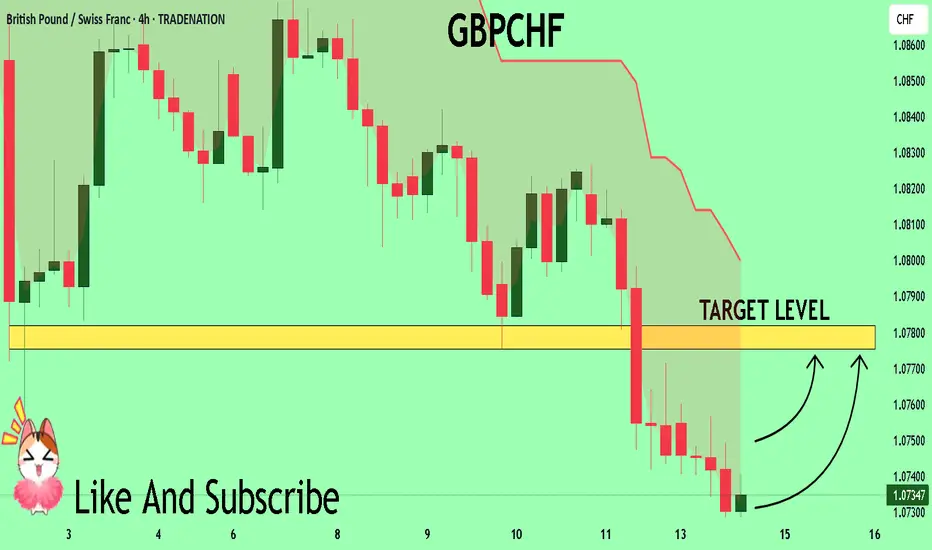
GBPCHF Technical Analysis! BUY!
My dear followers,
I analysed this chart on GBPCHF and concluded the following:
The market is trading on 1.0733 pivot level.
Bias - Bullish
Technical Indicators: Both Super Trend & Pivot HL indicate a highly probable Bullish continuation.
Target - 1.0775
About Used Indicators:
A super-trend indicator is plotted on either above or below the closing price to signal a buy or sell. The indicator changes color, based on whether or not you should be buying. If the super-trend indicator moves below the closing price, the indicator turns green, and it signals an entry point or points to buy.
Disclosure: I am part of Trade Nation's Influencer program and receive a monthly fee for using their TradingView charts in my analysis.
———————————
WISH YOU ALL LUCK
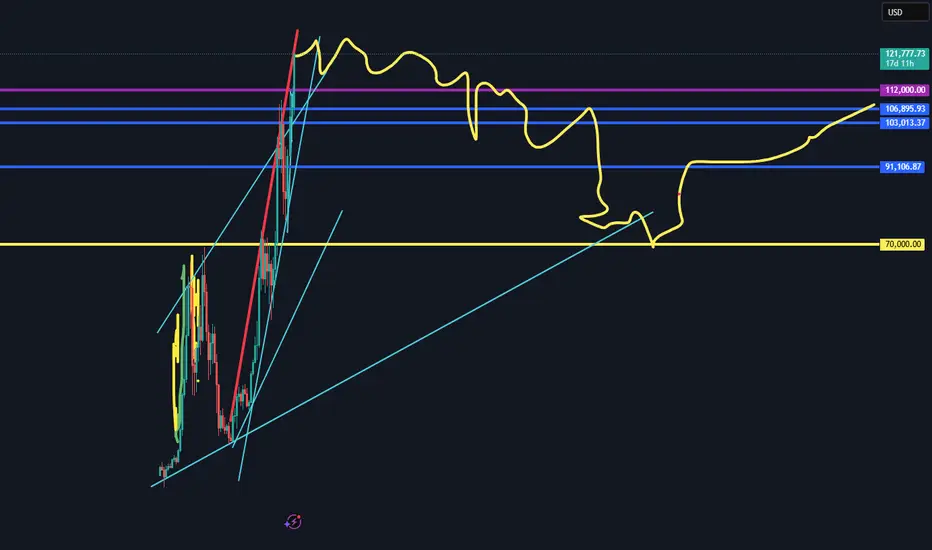
BTC TOP AND BEARISH AND CONTUNITY PREDICTION This chart is purely based on technical analysis. The RSI is still not oversold on the monthly chart, which means there might be a little more upside to this. But from the trendline, a serious reversal appears due. I could be wrong, but we'll all see. Profit taking may commence bit by bit.
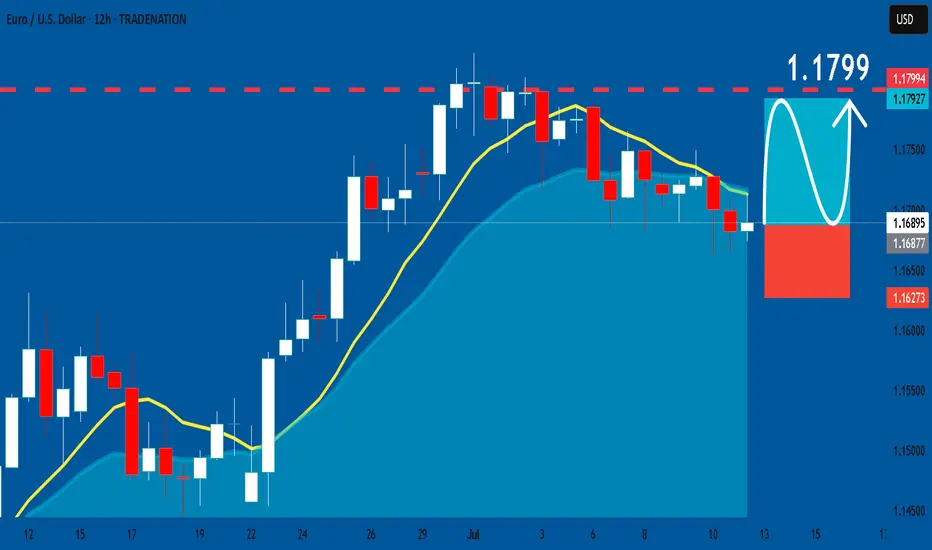
EURUSD: Long Signal with Entry/SL/TP
EURUSD
- Classic bullish formation
- Our team expects pullback
SUGGESTED TRADE:
Swing Trade
Long EURUSD
Entry - 1.1689
Sl - 1.1627
Tp - 1.1799
Our Risk - 1%
Start protection of your profits from lower levels
Disclosure: I am part of Trade Nation's Influencer program and receive a monthly fee for using their TradingView charts in my analysis.
❤️ Please, support our work with like & comment! ❤️
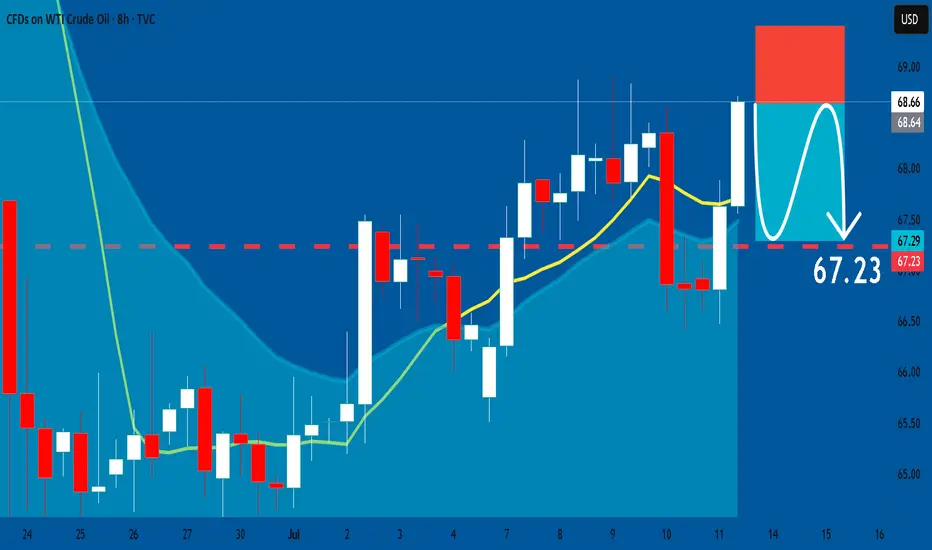
USOIL: Bearish Continuation & Short Trade
USOIL
- Classic bearish setup
- Our team expects bearish continuation
SUGGESTED TRADE:
Swing Trade
Short USOI
Entry Point - 68.66
Stop Loss - 69.40
Take Profit - 67.23
Our Risk - 1%
Start protection of your profits from lower levels
Disclosure: I am part of Trade Nation's Influencer program and receive a monthly fee for using their TradingView charts in my analysis.
❤️ Please, support our work with like & comment! ❤️
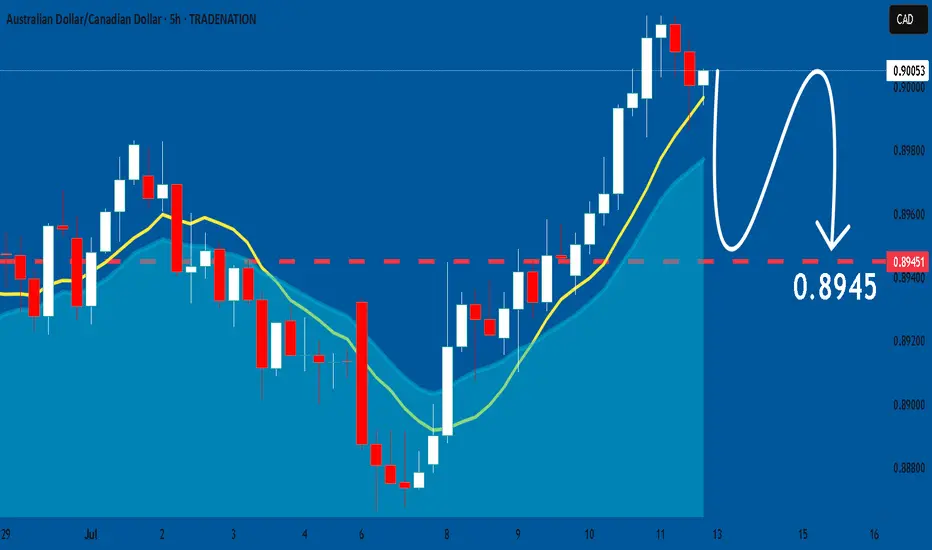
AUDCAD: Forecast & Technical Analysis
Balance of buyers and sellers on the AUDCAD pair, that is best felt when all the timeframes are analyzed properly is shifting in favor of the sellers, therefore is it only natural that we go short on the pair.
Disclosure: I am part of Trade Nation's Influencer program and receive a monthly fee for using their TradingView charts in my analysis.
❤️ Please, support our work with like & comment! ❤️
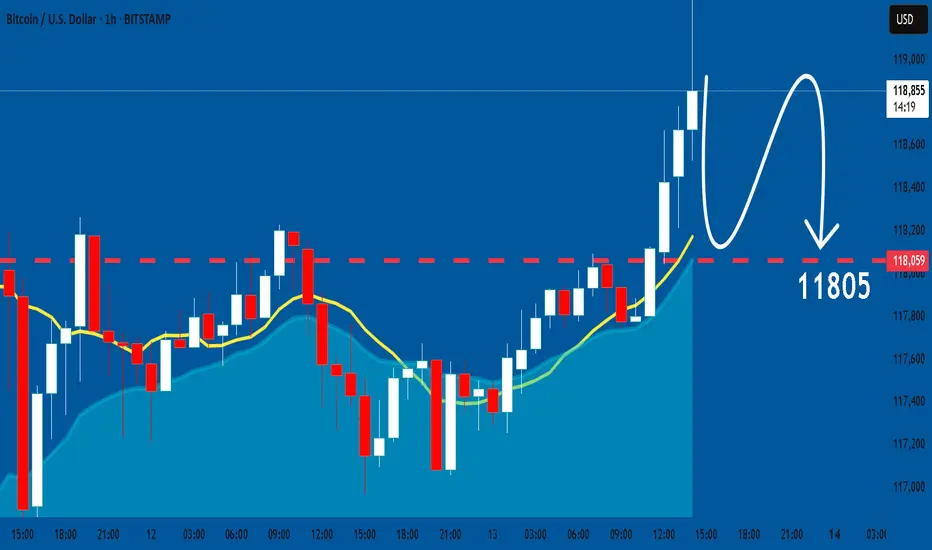
BTCUSD: Bearish Continuation
The charts are full of distraction, disturbance and are a graveyard of fear and greed which shall not cloud our judgement on the current state of affairs in the BTCUSD pair price action which suggests a high likelihood of a coming move down.
Disclosure: I am part of Trade Nation's Influencer program and receive a monthly fee for using their TradingView charts in my analysis.
❤️ Please, support our work with like & comment! ❤️
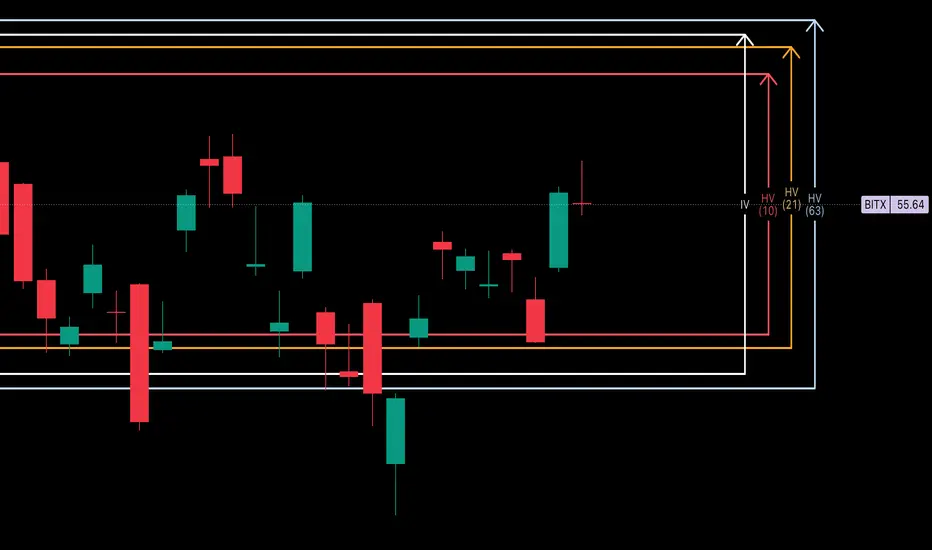
BITx -- Weekly Volatility SnapshotHello Bitcoin community 🤠👾🤑👾🤠
Good morning/Good afternoon, maybe goodnight to you pending where you are in the world!
Nonetheless, I'm glad you found me because here we are going to look over our weekly historical volatility ranges on CBOE:BITX and assess where IV is in perspective to what's trending. Then we will talk targets within my custom adjusted implied weekly ranges.
Entering the week, IV (76.86%) is projecting +17.74% more than what short-term trending markets are showing with HV10 (59.12%) holding a 'strength of IV' of only 76.91%. This is a price differential on the week of -$1.19. Our monthly values with HV21 (71.20%) are hinged slightly below IV, showing a 'strength of IV' slightly more at 92.64%.
In my opinion looking towards this week, IV may be painting the bigger picture of price distribution upwards towards quarterly trends. It is expansive from past weeks and above short-term trending markets with a wider range and with IV percentile slowly creeping up.
If the trend holds that started last week, my price target will be HV63 at $61.07 which draws confluence with the correction impulse wave top of $60.39 -- a price action to implied calculation difference of only +/-$0.69. Fantastic , right?!? This would take BTC approaching new ATHs again. If price action can find quarterly trends we will be seeing a 'strength of IV' of 108.44% -- only slight advantageous over IV premium.
In the end, markets are unpredictably wild and we can only assess and reduce our risk using the tools provided. Always remember your ABCs and to hedge your bias! Come back next week as we recap how the weekly volatility unfolded.
Cheers!
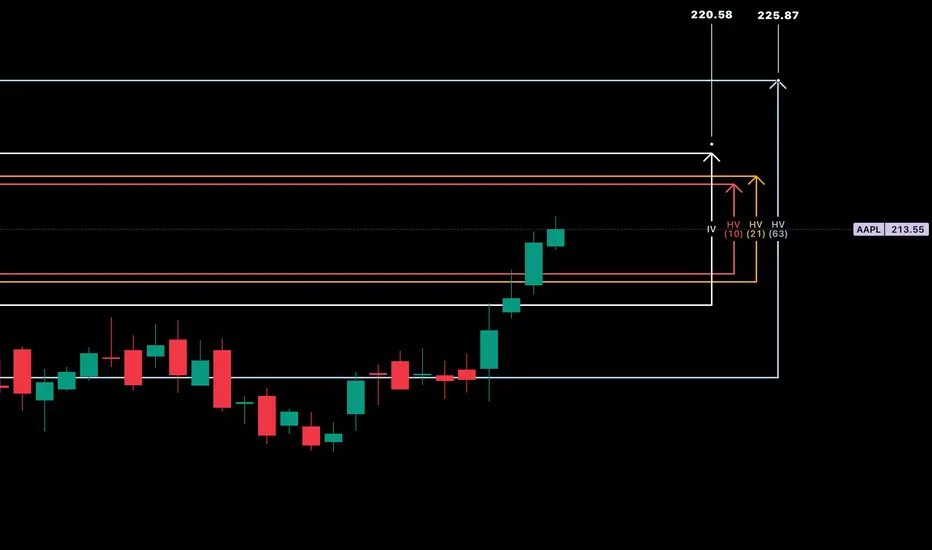
AAPL - Weekly HV/IV PerspectiveGood evening —
I wanted to do one more write up with that being on NASDAQ:AAPL as we enter the week with futures just opening.
HV10 (16.58%) is trending -11.56% below IV (28.14%) showing a weekly price gap differential of -$2.89 on the stated implied move to what trending markets are doing. This current IV value entering the week sits 69% within the sliding year spectrum.
Now, with Apple consolidating in range for almost eight weeks after selling off when it reached its 4T milestone in December of 2024, has now begun advancing back upwards in price. The strength here is obvious and the quality of company is well, Apple.
My price targets on the week is first the upper band of stated IV ($220.58) then moving on towards the upper implied range of HV63 ($225.87). I believe the markets are going to push apple higher while balancing the indices out selling off in other areas. This would start to accelerate HV10, as it is now 91.23% coiled to its yearly lows and needs to unwind. Hopefully with a few short-term trending days increasing we find our regression.
Please come back next week and see how our position and volatility progressed forward.