Learning#04 : PDH & PDL🎯 Learning#04 : PDH & PDL
- The 2 Levels Every Intraday Trader Must Watch
Turn Yesterday’s Levels into Today’s Profits – PDH/PDL Playbook
In intraday trading, simplicity often beats complexity.
You don’t always need fancy indicators, dozens of lines, or complicated systems. Sometimes, two levels are all it takes to stay in sync with the market:
👉 Previous Day’s High (PDH)
👉 Previous Day’s Low (PDL)
These levels may look basic, but they carry psychological weight and often mark where real action — and opportunity — unfolds.
Let’s break it down into a practical strategy you can start using as early as tomorrow morning 👇
🧠 What Are PDH and PDL?
PDH = The highest price the market reached yesterday
PDL = The lowest price the market reached yesterday
That’s it. No calculations. No indicators. Just two simple levels from the previous session.
But here’s why they matter:
They’re visible to everyone — retail traders, institutional desks, even algo systems. These are “memory zones” where the market often reacts — bouncing, breaking, or trapping traders in fakeouts.
Think of them as psychological boundaries.
When price approaches these levels, traders ask:
“Will it break or bounce?”
That hesitation — that moment of decision — is your opportunity.
⚡ Why These Levels Work So Well
✅ They’re objective — no subjectivity involved. Anyone can mark them.
✅ They’re reaction zones — price often stalls, breaks, or rejects here.
✅ They reflect sentiment — how price behaves around them reveals market strength or weakness.
PDH and PDL often act like turning points — or springboards for continuation. The key is in reading how price behaves when it gets there.
📊 3 Smart Ways to Trade Around PDH/PDL
Let’s look at three powerful setups based on how price behaves near these levels:
1️⃣ Rejection at PDH or PDL (Classic Reversal)
This is the simplest setup — and one of the most effective.
When price tests PDH or PDL but fails to break, it often leaves signs:
Long upper/lower wicks
Rejection candles (like pin bars or inside bars)
Sudden volume drop
💡 Example:
Nifty rallies to PDH at 22,180, prints a long upper wick, then forms a red candle closing below. That’s a reversal clue.
You could enter short below the rejection candle, with a stop just above the high and a target near VWAP or mid-range.
🎯 Why this setup works: Tight risk. Logical context. High clarity.
2️⃣ Breakout and Retest (Trend Continuation)
If price breaks through PDH/PDL with strength, don’t chase it.
Wait for price to pull back and retest the level.
If PDH was broken, wait for a bullish retest — former resistance becomes support.
If PDL was broken, wait for a bearish retest — former support becomes resistance.
💡 Example:
BankNifty breaks PDH, pulls back, then prints a bullish engulfing candle right at the level — confirmation to go long.
📌 This setup works best on trending days and offers cleaner entries than chasing breakouts.
3️⃣ The Failed Breakout (Trap Setup)
One of the most high-probability setups — and one that traps many.
Here’s how it plays out:
Price breaks PDH/PDL
But immediately snaps back inside the range
Traders who chased the breakout are now trapped
💡 Signal to watch:
A candle closes above PDH, followed by a candle that closes back below — that’s your short signal. Reverse for long setups around PDL.
🚨 Even more effective when the breakout happens on low volume — no real conviction behind the move.
🔧 Tools That Amplify These Setups
These setups work great with a clean chart — but a few tools can boost your edge:
VWAP: Check if price is extended or supported near PDH/PDL. When VWAP aligns with these levels — confluence zone!
Candlestick patterns: Look for pin bars, inside bars, or engulfing patterns at the level.
Opening range: If price breaks PDH/PDL early in the day,
especially within the first 30 minutes, it signals directional intent.
Volume: Strong breakouts need volume. Weak volume = likely fakeout.
🔑 Remember: You don’t trade the level — you trade the reaction at the level.
✅ Why This Simple Strategy Works
Don’t underestimate the power of PDH and PDL. These levels:
Show where emotions exist — greed and fear often play out here.
Create natural reaction zones — ideal spots for clean entries and exits.
Let you trade with structure, not guesswork.
Instead of chasing price all day, do this:
Mark PDH and PDL
Wait for price to approach the zone
Watch how it behaves
React with a plan — not emotion
✨ Simple, repeatable, and highly effective — if you stay patient and disciplined.
✍️ Final Thoughts
In a world full of overcomplicated strategies, PDH/PDL trading is a refreshing reminder that clarity often comes from simplicity.
These levels won’t give you 10 trades a day — but they will give you high-quality, context-driven opportunities that align with how real price and volume work.
See you in the next one — and until then:
Keep it simple. Trade with structure. Trust the levels.
— Kiran Zatakia
Previousdaylow
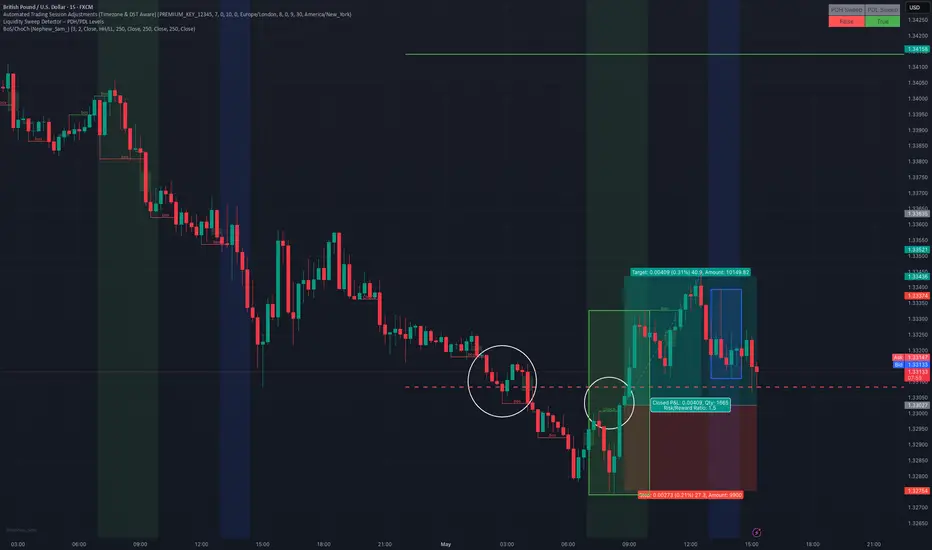
How to Trade Liquidity Sweeps Using PDH/PDL Levels (Smart Money This guide shows how to use the **Liquidity Sweep Detector – PDH/PDL Levels** script, now live on my profile.
**What It Does:**
- Accurately plots the previous day's high and low on intraday charts (15m, 1H)
- Detects when price *sweeps* above or below those levels (potential liquidity grabs)
- Visually marks sweeps with a dashed line and alerts you in real time
- Optional table to show current sweep status (can be toggled off)
**How I Use It:**
- Wait for a sweep above PDH or below PDL
- Look for rejection candles or structure shift afterward (e.g., CHoCH or BOS)
- Combine with session timing (e.g., London/NY) for confluence
**Pro Tip:**
Set alerts to catch sweeps even when you're away from the screen. Just click "Add Alert" and use:
- `PDH Sweep Triggered`
- `PDL Sweep Triggered`
This is part of how I approach Smart Money trading — combining market structure with real liquidity events.
Script is open and free to use — find it on my profile:
**Liquidity Sweep Detector – PDH/PDL Levels**