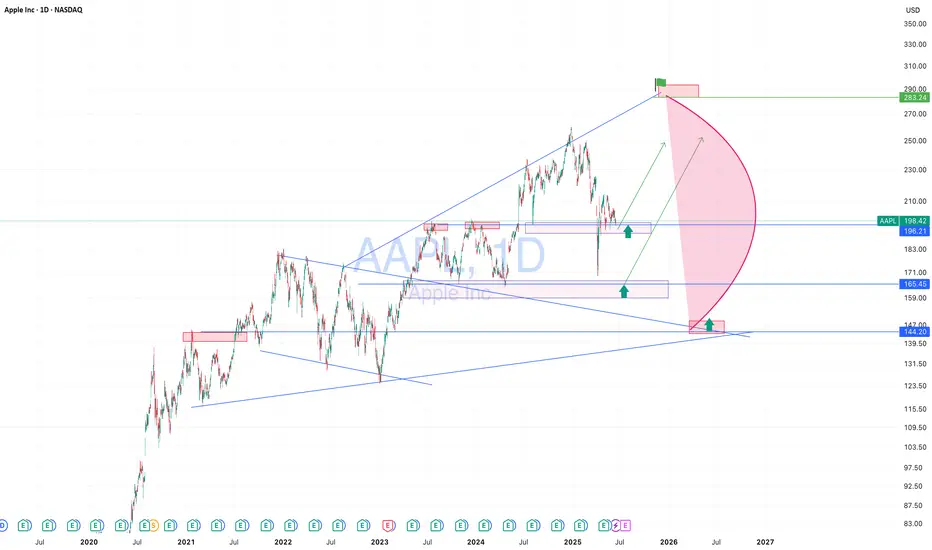
AAPL — Broadening Range and Accumulation Phase. Targeting $300Apple stock has been moving in a broadening pattern for an extended period, showing signs of accumulation. This price behavior suggests a potential bullish breakout. The upside target in the coming months is around $300, possibly by fall or winter. However, a corrective scenario remains on the table, with a potential pullback toward the $165–144 range, which could present a strong long entry opportunity. From a fundamental perspective, investor interest is likely to increase ahead of Apple’s expected product presentation in the fall, which historically supports bullish sentiment in the stock.
Priaction
+$30K Unrealized | Still Long, Is ATH Next?Even after the strong rally that pushed Bitcoin past the 100K level, the price continues to hold critical support zones without breaking recent lows. We're seeing a steady, stair-step climb ("grinding higher")—absorbing previous supply through sideways consolidation while still making higher highs.
After forming a local high near 105,000, we’ve seen some pullback—but so far, there’s been no breakdown of major support, especially on lower timeframes. The structure still favors continuation to the upside, and the broader uptrend from the 74K–83K zone remains intact.
That said, we haven’t seen any major correction yet. With the market now testing the final supply zone before all-time highs, failure to break out could trigger a wave of profit-taking. This could lead to short-term selling from traders who bought lower, anticipating new highs.
We're now in a zone where volatility can spike in both directions, making it a tough area for clean entries. Long positions may feel risky due to the high level, and shorting too early might get squeezed out by another high. But this environment also presents great short-term opportunities—as long as you're quick and manage risk tightly.
If the current bounce fails to break above 105K, it may signal a larger corrective move. The first support zone to watch is 103K, followed by 99K. Even if price pulls back to these levels, the overall trend may still be valid—these are key zones where the uptrend could resume.
At this point, we must observe whether this bounce leads to further continuation or becomes a “trap” before a larger move down. If price holds the previous supply zones as support, we could see another leg up. If not, a deeper retracement may unfold.
This is also a zone where many traders may FOMO in, expecting an immediate breakout, only to get caught in a fakeout or shakeout. Personally, I think the market is more likely to test this final supply zone with increased volatility and a deeper correction before making a real move to new all-time highs. Risk management is crucial here.
We’ve had a strong rally with no significant retracements, and while the uptrend may continue, failure to break out soon—or if profit-taking kicks in—could lead to meaningful corrections. Be prepared.
To summarize, we are in a very important decision zone:
Will price continue holding the lows and grind higher to new ATHs,
or will it reject from supply and trigger a larger retracement?
Whatever happens next, don't rush into a position out of fear of missing out.
Wait for structure, wait for confirmation, and remember: entering one step later at a better level is far better than entering too soon and getting stopped out.

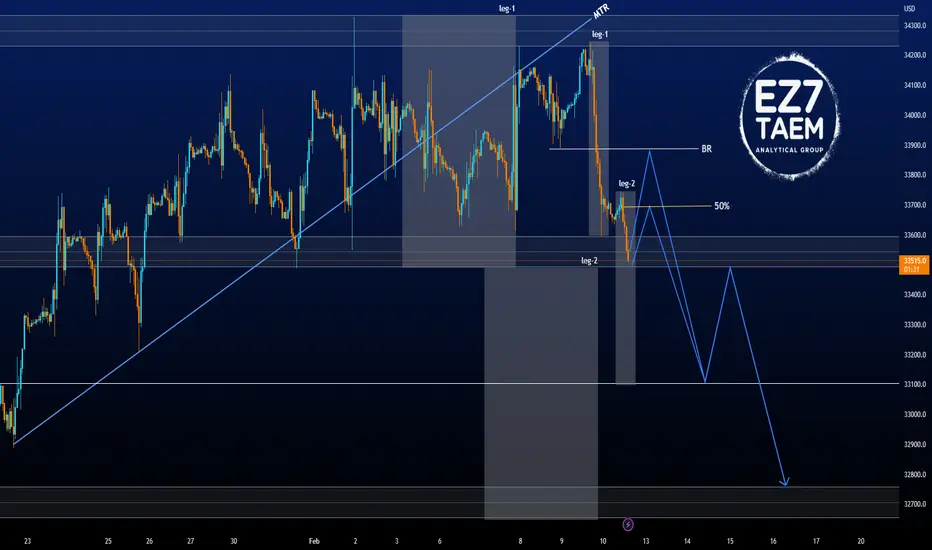
Strong Short with news "UoM"Use by... #ez7_strategy🥇
Legs
M.T.R (major trend reversal)
big_body 50%
Breakeven
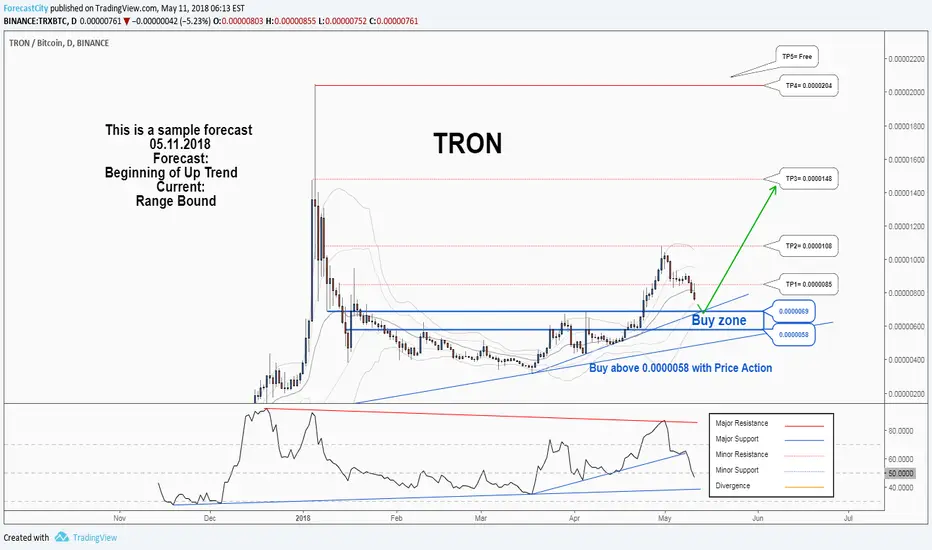
There is a possibility for the beginning of uptrend in TRXBTC .Technical analysis:
TRON/BITCOIN is in a range bound and the beginning of uptrend is expected.
The price is below the 21-Day WEMA which acts as a dynamic resistance.
The RSI is at 48.
Trading suggestion:
The price is in a range bound, but we forecast the uptrend would begin.
There is a possibility of temporary retracement to suggested support zone (0.0000069 to 0.0000058). if so, traders can set orders based on Daily-Trading-Opportunities and expect to reach short-term targets.
Beginning of entry zone (0.0000069 )
Ending of entry zone (0.0000058)
Entry signal:
Signal to enter the market occurs when the price comes to "Buy zone" then forms one of the reversal patterns, whether "Bullish Engulfing" , "Hammer" or "Valley" , in other words,
NO entry signal when the price comes to the zone BUT after any of reversal patterns is formed in the zone.
To learn more about "Entry signal" and special version of our "Price Action" strategy FOLLOW our lessons:
Take Profits:
TP1= @ 0.0000085
TP2= @ 0.0000108
TP3= @ 0.0000148
TP4= @ 0.0000204
TP5= Free