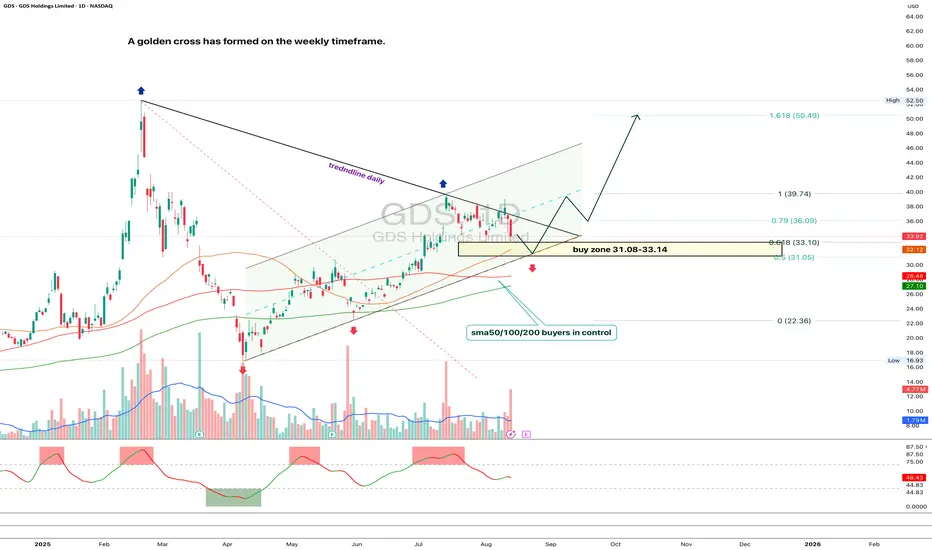
GDS 1D - golden cross and key buying zoneOn the daily chart of GDS, price is moving within a steady ascending channel and is now correcting toward the key support zone at 31.08–33.14. This zone is reinforced by the 0.618 Fibo level (33.10), the lower channel boundary, and the cluster of SMA50/100/200 averages, which remain under buyers’ control. On the weekly timeframe, a golden cross has formed, signaling a long-term bullish momentum.
The current structure suggests a pullback into 31.08–33.14, followed by a potential bounce. If demand confirms in this area, the technical target lies at 39.74, with an extended bullish scenario aiming for the 1.618 Fibo at 50.49. A break below 31.00 would invalidate the bullish outlook.
Fundamentally , GDS continues to benefit from rising demand for data centers in China and active infrastructure expansion. The long-term trend is supported by strong capital inflows into the tech sector, though short-term corrections within the channel remain part of the normal cycle.
Tactical plan: watch for reaction in the 31.08–33.14 zone; a confirmed buy signal could trigger entries targeting 39.74 and 50.49. Strong setup, but requires disciplined execution.
Priceacrion
US 10Y Government Bond Initial Weekly Analysis I think it is a great idea at this time to see how the bond market is looking with all the talk about the debt ceiling crisis. It will also give us an idea of where the US dollar can go! Currently, the price action has been rolling over to the downside. I think it best to keep that narrative until we see a conformational move that would change this higher timeframe trend. In my opinion, the most important area that I believe has many traders are focused on is the closet supply area which is also the previous higher low. Evetually, this instrument will liquidate the sellers in this market. Lets keep this one on the list and update throughout the week.
Feel free to connect and chat about this instrument. :-)

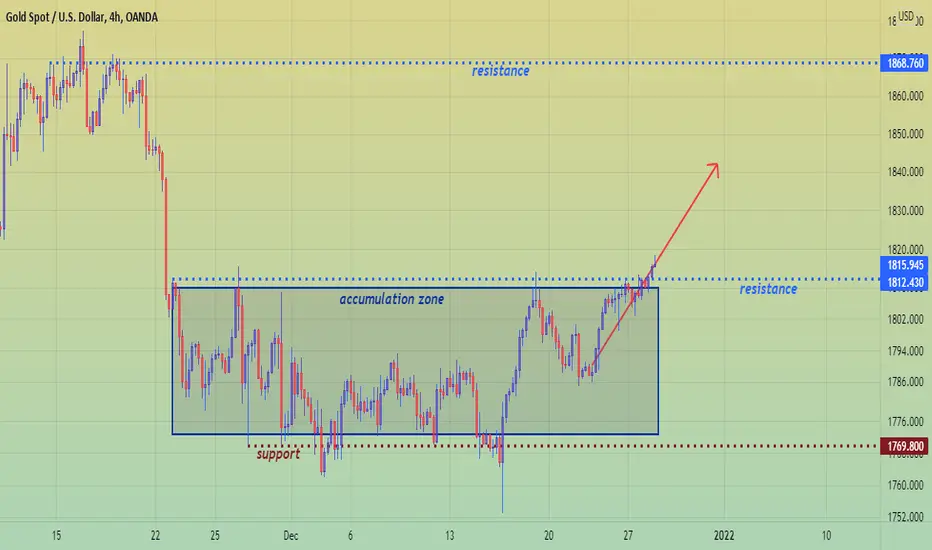
Gold still burst out of the accumulation zone.Gold still burst out of the accumulation zone.
Very strong further growth is possible.
You can even expect a move until the next resistance!
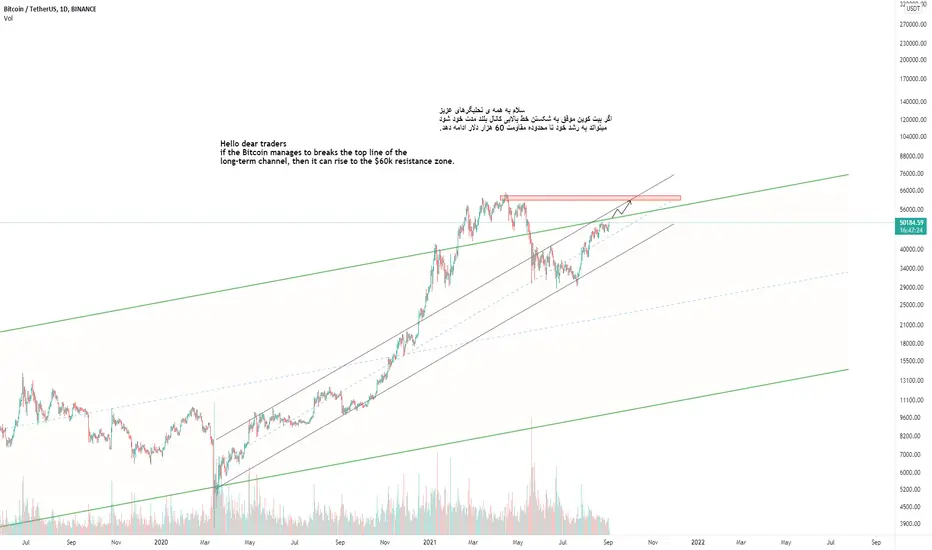
Bitcoin , Price growth scenarioBINANCE:BTCUSDT
Hello dear traders
if the Bitcoin manages to breaks the top line of the
long-term channel, then it can rise to the $60k resistance zone.