USDCHF - Bearish => Bullish => Now Bearish?Hello TradingView Family / Fellow Traders. This is Richard, also known as theSignalyst.
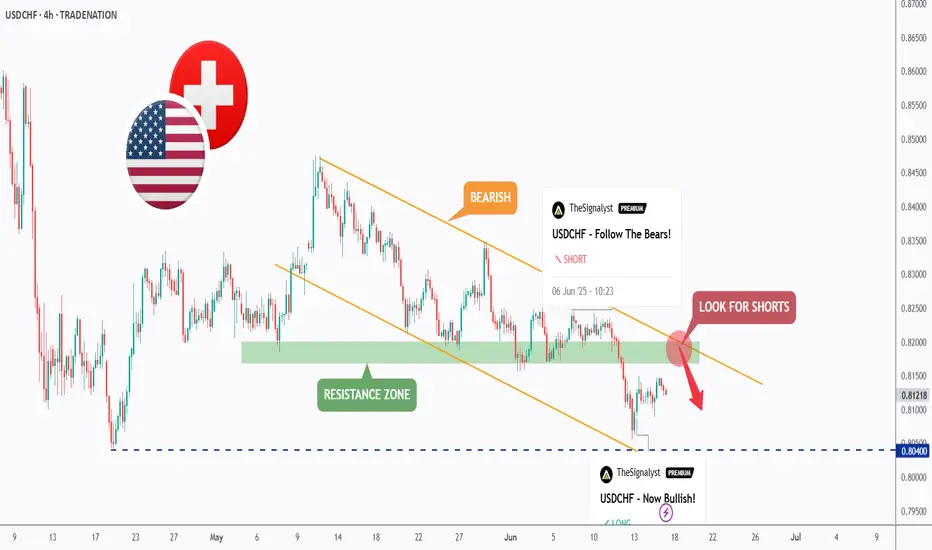
📈USDCHF has been overall bearish trading within the falling channel marked in orange. And it is currently retesting the upper bound of the channel.
Moreover, the green zone is a strong resistance.
🏹 Thus, the highlighted red circle is a strong area to look for sell setups as it is the intersection of the upper orange trendline and resistance.
📚 As per my trading style:
As #USDCHF approaches the red circle zone, I will be looking for bearish reversal setups (like a double top pattern, trendline break , and so on...)
📚 Always follow your trading plan regarding entry, risk management, and trade management.
Good luck!
All Strategies Are Good; If Managed Properly!
~Rich
Disclosure: I am part of Trade Nation's Influencer program and receive a monthly fee for using their TradingView charts in my analysis.
Priceaction
EURGBP - Bullish No More!Hello TradingView Family / Fellow Traders. This is Richard, also known as theSignalyst.
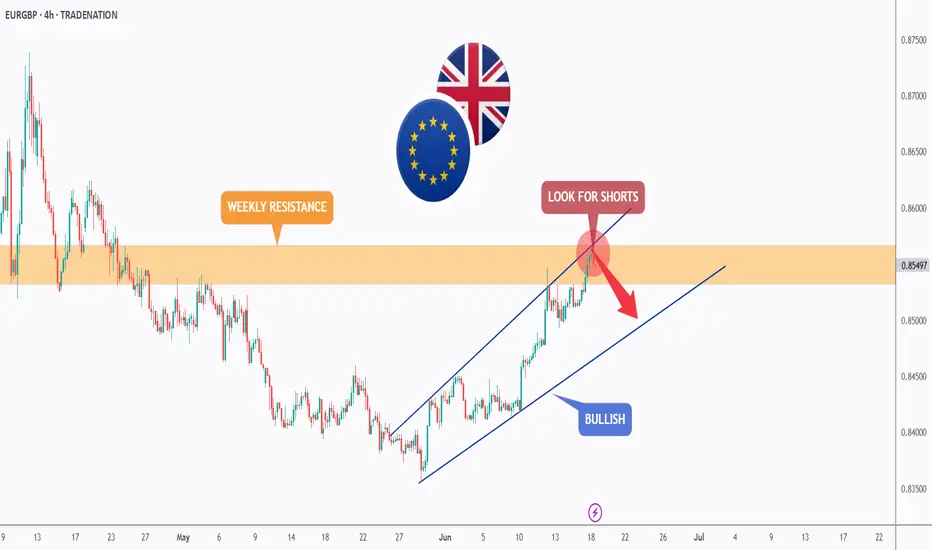
📈 EURGBP has been overall bullish trading within the rising channel marked in blue. And it is currently retesting the upper bound of the channel.
Moreover, the orange zone is a strong weekly resistance.
🏹 Thus, the highlighted red circle is a strong area to look for sell setups as it is the intersection of the upper blue trendline and resistance.
📚 As per my trading style:
As #EURGBP is around the red circle zone, I will be looking for bearish reversal setups (like a double top pattern, trendline break , and so on...)
📚 Always follow your trading plan regarding entry, risk management, and trade management.
Good luck!
All Strategies Are Good; If Managed Properly!
~Rich
Disclosure: I am part of Trade Nation's Influencer program and receive a monthly fee for using their TradingView charts in my analysis.
EURUSD - Shifting from Bearish to Bullish Soon!Hello TradingView Family / Fellow Traders. This is Richard, also known as theSignalyst.
📈EURUSD has been overall bullish trading within the rising wedge marked in blue.
Moreover, the orange zone is a strong support!
🏹 Thus, the highlighted blue circle is a strong area to look for buy setups as it is the intersection of support and lower blue trendline acting as a non-horizontal support.
📚 As per my trading style:
As #EURUSD approaches the blue circle zone, I will be looking for bullish reversal setups (like a double bottom pattern, trendline break , and so on...)
📚 Always follow your trading plan regarding entry, risk management, and trade management.
Good luck!
All Strategies Are Good; If Managed Properly!
~Rich
Disclosure: I am part of Trade Nation's Influencer program and receive a monthly fee for using their TradingView charts in my analysis.

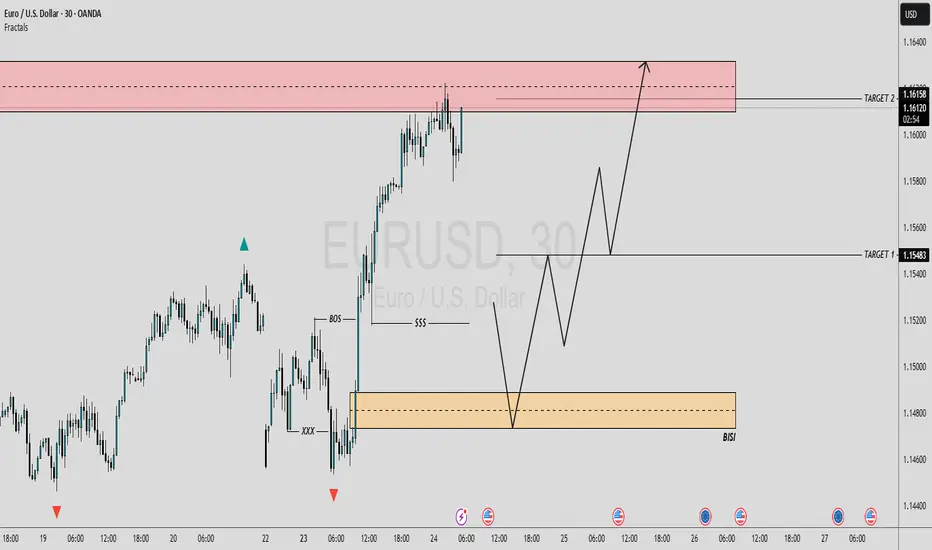
EUR/USD 30-MIN ANALYSISThis EURUSD setup showcases a clean bullish continuation scenario following a confirmed Break of Structure (BOS) and a sharp rally driven by momentum and liquidity imbalance.
After sweeping a key low (XXX), price impulsively broke structure to the upside, confirming a potential shift in market intent. A retracement is now expected to mitigate the Buy-Side Imbalance (BISI) zone.
BOS & SSS (Short-Term Structural Shift): Confirmed bullish intent.
Imbalance (BISI): Price left behind an unfilled imbalance zone a likely magnet for a pullback.
Re-Entry Zone: (BISI) provides a high probability area for long re-entry.
Upside Targets:
Target 1: 1.15483 – intermediate structural level.
Target 2: 1.16158 – premium supply / liquidity target.
#EURUSD 30M Technical Analysis Expected Move.
24.06.25 Morning ForecastPairs on Watch -
FX:AUDNZD
FX:USDJPY
FX:EURCAD
A short overview of the instruments I am looking at for today, multi-timeframe analysis down to what I will be looking at for an entry. Enjoy!

GU-Tue-24/06/25 TDA-Strong bullish push from GU, don't FOMOing!Analysis done directly on the chart
Follow for more, possible live trades update!
It's really easy to FOMOing when price is going
unilateral and I don't blame you. It's part of human
psychology to instinctively react like this.
But ask yourself: if you FOMOed this time and got
lucky, do you think long term it's a repeatable approach?
Sustainable long term?
When price pushes a lot and you are not in the trade,
usually good thing to do is wait for some sort of pullback
or some sort of support so you can put good sl placement.
So you know already your sl and tp before you enter a trade.
One good or bad trading day won't define you as a trader.
The consistent results will!
Active in London session!
Not financial advice, DYOR.
Market Flow Strategy
Mister Y

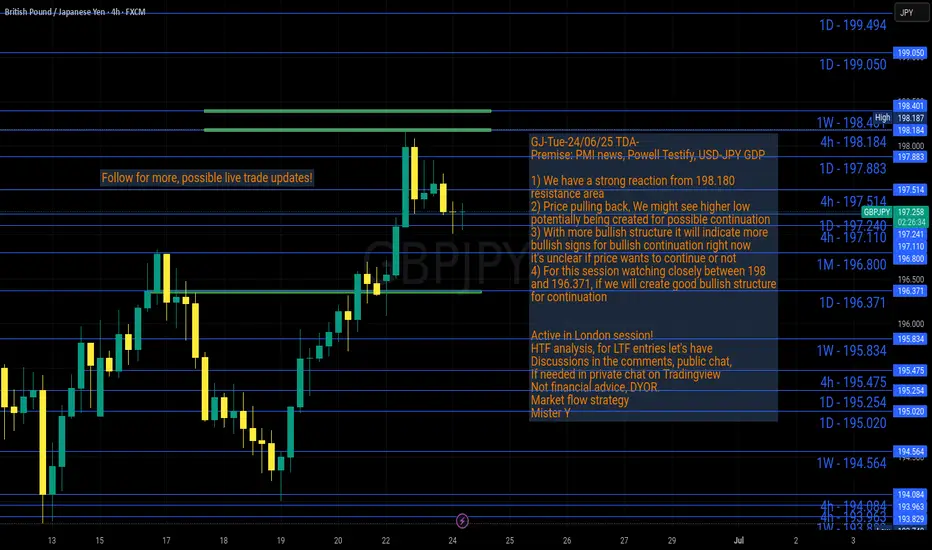
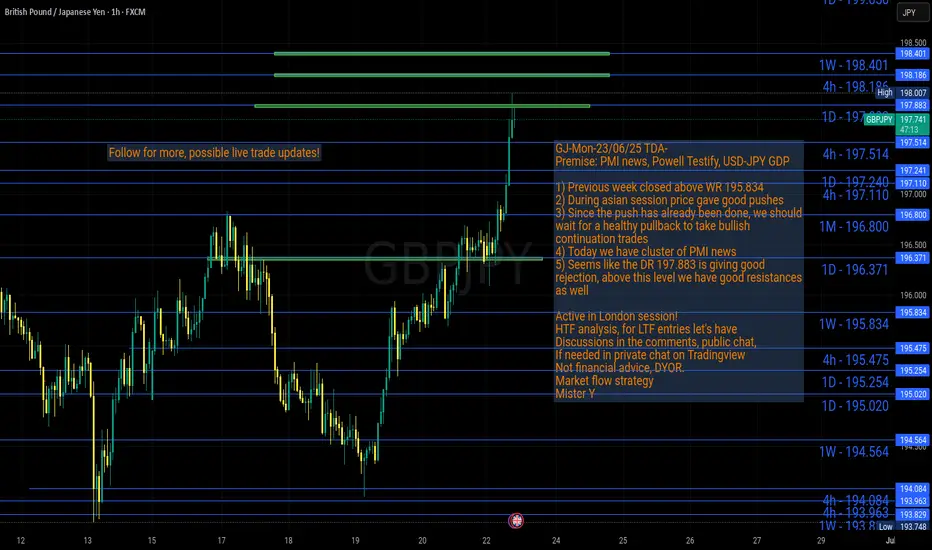
GJ-Tue-24/06/25 TDA-Strong resistance area 198.180Analysis done directly on the chart
Follow for more, possible live trades update!
A good advise is always to have understanding of the whole picture,
once you identified the full picture then come down to little details
that shapes the big picture.
Example trading related: understanding the
Higher timeframe structure (htf). This is what
We call the "Top Down Analysis" (TDA).
Once you identified the big picture, you go to
lower timeframe structure (LTF), these are the little details.
Comment down below if you agree or disagree!
Active in London session!
Not financial advice, DYOR.
Market Flow Strategy
Mister Y
ETH - ORDER BOOK - BIG LEVELS Ethereum Order Book Analysis | Key ETH Levels Revealed (Real-Time Liquidity Zones)
In this video, we dive into the Ethereum (ETHUSD) order book to uncover major liquidity levels that could influence price action in the short and medium term. By analyzing real-time data, we identify where whales and institutions are placing large orders, which often act as strong support and resistance zones.
What You’ll Learn:
• How to spot large buy/sell walls on the ETH order book
• Why these levels matter for short-term traders
• Real-time reactions to major liquidity zones
• Potential long/short trade setups around key areas
This is essential viewing if you’re trading ETH intraday or swing, and want to anticipate where the next major move may come from.
⸻
Tools Used:
• ETHUSD price chart
• Real-time order book data
• Volume heatmaps
• Liquidity zone mapping
• Sentiment Tool
⸻
Stay ahead of the crowd by understanding how the market reacts to big players’ order placements. Don’t forget to leave a comment with your ETH target, and follow for more pro-level crypto analysis.
⸻
#Ethereum #ETHUSD #ETHAnalysis #CryptoTrading #OrderBook #ETHOrderFlow #LiquidityLevels #CryptoTA #PriceAction #WhaleWatching

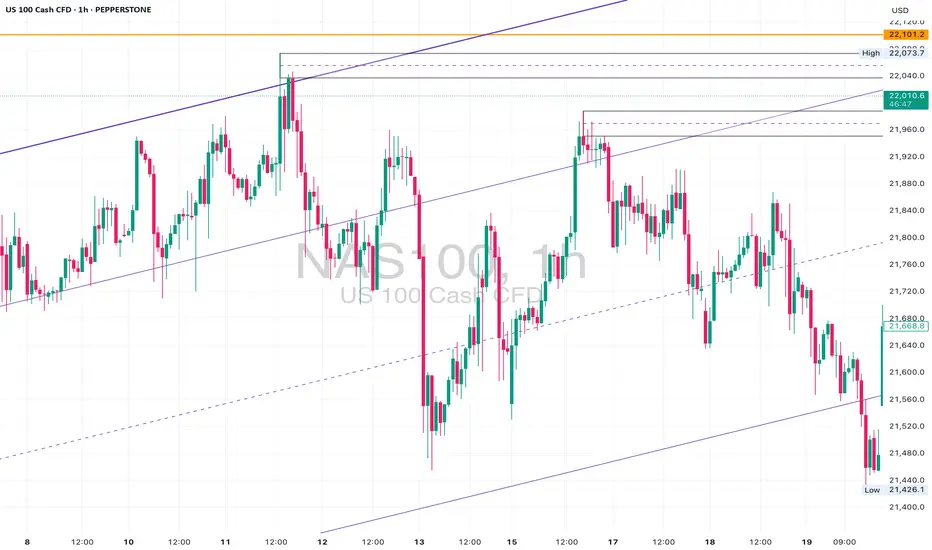
NAS100 Analysis – Structure Breakout or Trap?📍 Levels Marked: 22,101 Resistance | 21,880 Mid-Level | 21,375 Channel Support
⸻
📊 Technical Breakdown:
The NAS100 has surged into the 22,000+ range, breaking above the mid-level channel boundary after consolidating beneath it for days. This breakout takes us right back into an untested supply zone from March.
On the lower timeframes (1H & 23min), price cleanly cleared multiple lower highs with aggressive bullish momentum, printing a new intraday high at 22,015. However, structure is still trapped inside a long-term ascending channel on the 4H and D1 — and this move could be setting up a liquidity grab before reversal.
Key zone to watch:
• 22,101 – 22,200 (daily resistance + equal highs)
• 21,880 – 21,920 (possible retest zone)
• 21,375 (channel base support)
⸻
📉 Trade Ideas:
• Short Bias if price rejects the 22,100–22,200 area with bearish confirmation on lower timeframes. Target: 21,800 – 21,600.
• Long Bias only if price gives a bullish retest of the 21,880–21,920 zone with clean structure. Target: 22,222+ with tight risk.
⸻
💡 Final Thoughts:
A textbook case of a channel edge breakout — but breakout or fakeout? Always wait for confirmation and let structure guide the setup. We’re either about to print new highs or see a sharp correction.
📌 Mark your levels. Watch the retest. Execute with confidence.
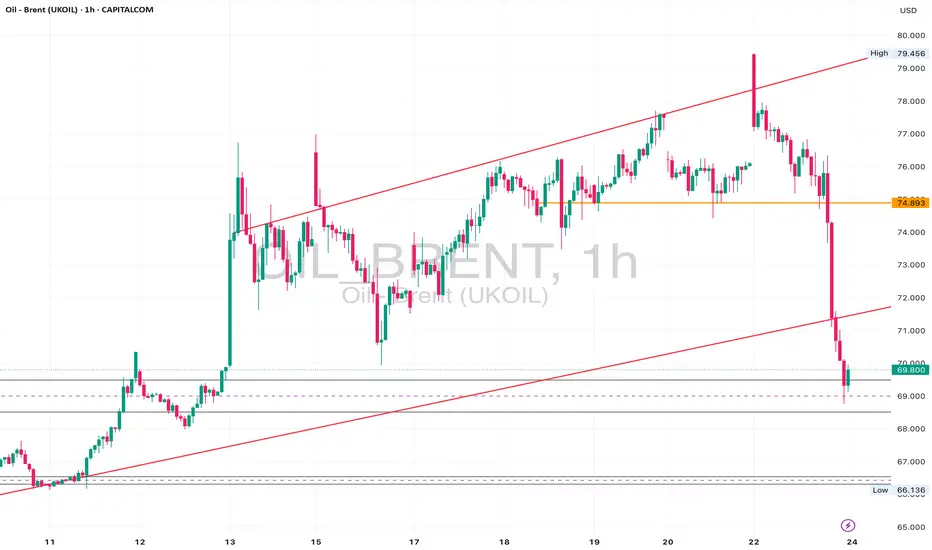
Brent Oil Breakdown – Rejection & Freefall From Channel HighsBrent Oil delivered a textbook reversal last week.
After weeks of climbing within a rising channel, price printed a strong rejection wick at the upper boundary (~$79.45), then followed through with a violent sell-off, slicing through structure and breaking the channel cleanly.
🔍 Key Levels:
• Rejection High: $79.45
• Structure Break: $74.89 (former support, now resistance)
• 4H Demand Zone: $66.00–$69.00
• Daily Demand Confluence: Aligned with 4H zone
On the 1H and 23min, we’re now seeing price trying to stabilise above $69.80 — right on top of the 4H and daily zone confluence.
📉 Bias:
Currently bearish below $74.89.
A clean retest of that level could offer continuation entries.
However, price is now in a high-probability reaction zone, so intraday longs are possible if price shows strength above $70.
⛽ Watch For:
• Bullish price action around $68.50–$70.00
• Weak retracements into $72–$73 for potential short entries
• Break below $66.00 could open floodgates back toward $63 and $60.00
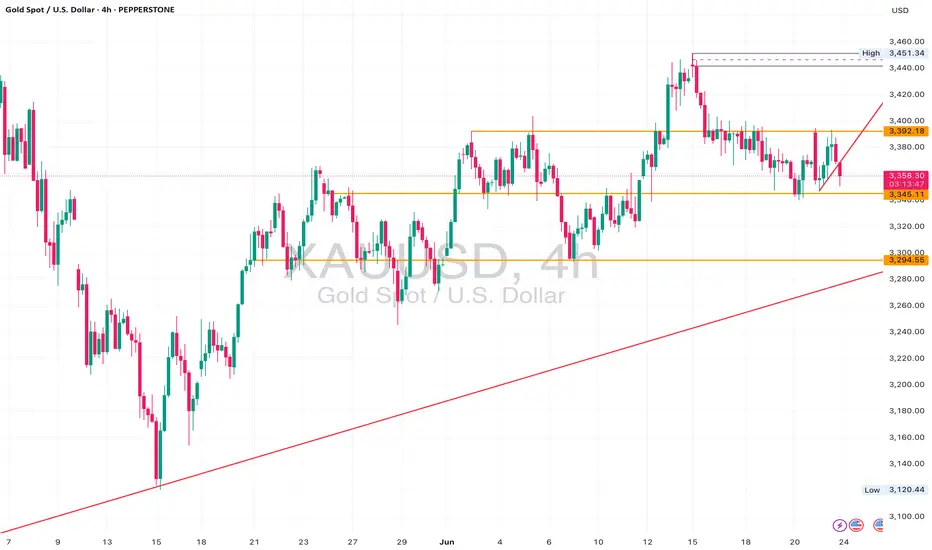
XAUUSD – Gold Forming Higher Lows with Range Bound CeilingGold remains bullish on the higher timeframes, holding a long-term ascending trendline from the daily.
However, price action has respected a clear horizontal resistance zone around 3392, forming a multi-tap ceiling.
On lower timeframes, we’re seeing a series of higher lows, suggesting buyers are still stepping in — but without clean breakouts, the market remains range-bound between 3345 and 3392.
⸻
🧠 Bias:
Neutral-Bullish
– Price is coiling into the triangle
– A breakout above 3392 could open doors toward 3450
– But if we fail to hold the rising trendline, a deeper pullback toward 3294 is likely
⸻
🎯 Trade Ideas:
📌 Break & Retest above 3392 = bullish continuation
📌 Break below trendline = short toward 3345 / 3294
⸻
⚠️ Key Levels to Watch:
• Resistance: 3392 → 3450
• Support: 3345 → 3294
• Daily Trendline Support (in play)
⸻
💡 Gold is compressing — breakout incoming. Watch the reaction at 3392 for directional clarity.
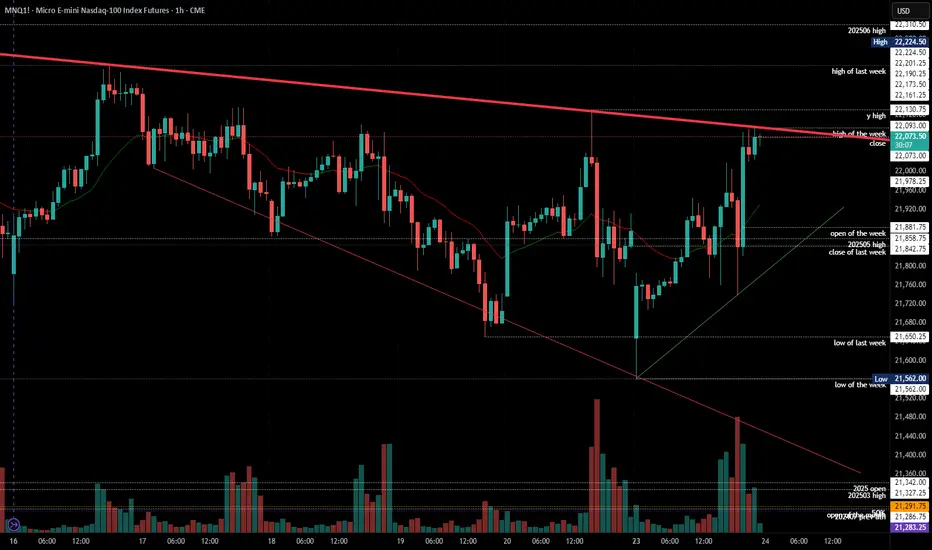
2025-06-23 - priceactiontds - daily update - nasdaq e-miniGood Evening and I hope you are well.
comment: Not even the US President joining a war can start the selling. Truly a special time. Above 22130 there is no reason this can’t test 22300 or higher. Market clearly does not care about the event and the pain trade seems up. Can’t hold bearish thoughts after today’s reversals. Very small chance that if we stay below 22130, bears come around and we test down to 21800 or lower.
current market cycle: trading range
key levels: 21500 - 22300
bull case: Bulls had the following legs up today: 380, 260, 350 points from swing lows to highs. On such a day, this is as bullish as it gets. They now need to print a higher high and then there is no more obvious reason why we can’t test back up to 22300 or higher.
Invalidation is below 21900.
bear case: Bears vanished after the double bottom in the US session and market closed at the high. Which is worst case for bears. Above 21130 they have to cover and I expect an acceleration upwards. If they somehow come around strongly and we go below 21950, then chances are decent that we can test down to 21800 again. Bears need to sell it early tomorrow or the bear trend line is gone and we could go much higher.
Invalidation is above 22130.
short term: Neutral. Only interested in shorts if we stay below 22130. I still think markets are grossly miss-priced and complacent but for now that thesis is wrong.
medium-long term - Update from 2024-06-22: Daily close below 21500 is my validation for the new bear trend which has the first bigger target at 21000 but I think we will printed below 20000 again this year. Structure is obviously not yet bearish, so don’t be early if you want confirmation and can’t/won’t scale in to shorts higher. Getting into longer term shorts above 21500 seems like the banger trade right now.
trade of the day: Buying literally every dip was good.
GBPCAD : SELL SETUP FORMED IN 4RSell @ 1.8460 or below
Target : 1.8225, 1.8000
Stoploss : 1.8560
Sell breakout and pullback done. Short entered at 1.8460

GBPUSD short re-entryGBPUSD – I Got Clipped. Now I’m Coming Back With Intent.
📅 Monday | June 23, 2025
Yes — I got stopped out. That’s execution, not failure.
Clean sweep of Asia’s high. Textbook.
Liquidity taken. Weak hands shaken. Now the real move can begin.
🔁 This 1H close is my greenlight for re-entry.
I don’t hesitate when the market gives me the same setup twice —
It’s still:
✅ Downtrend dominant
✅ Upthrust confirmed
✅ Sellers stepping back in
✅ Price under key rejection zone
If this bar closes bearish, I’m short again — this time with full intent.
📉 Target: 3r+ and beyond
🔥 London

GU-Mon-23/06/25 TDA-Lots of PMI news incoming today!Analysis done directly on the chart
Follow for more, possible live trades update!
Middle east tensions intensify, follow closely
what's happening as it might influence hugely
on price movement, volatility, fluctuation.
Active in London session!
Not financial advice, DYOR.
Market Flow Strategy
Mister Y

GJ-Mon-23/06/25 TDA-Asian session push, waiting for pullbackAnalysis done directly on the chart
Follow for more, possible live trades update!
Asian session push, if this is not your trading time.
There's nothing you can do to catch good moves,
The best thing we can do now is to wait for healthy
pullback before continuation!
Active in London session!
Not financial advice, DYOR.
Market Flow Strategy
Mister Y
23.06.25 Morning ForecastPairs on Watch -
FX:EURAUD
FX:EURNZD
FX:EURUSD
A short overview of the instruments I am looking at for today, multi-timeframe analysis down to what I will be looking at for an entry. Enjoy!

GBPUSD London Session | Live Forex Analysis & Trade ideasIn today’s London session, we conducted a detailed intraday analysis on the GBPUSD currency pair using wave structure analysis on the 5-minute (M5) timeframe.
Price action confirmed a break below bullish market structure that had previously formed the Asian session high, signalling a potential shift in market sentiment to the downside. This breakdown confirmed short-term bearish momentum shift.
Following the completion of the bearish wave, the price retraced to form a structural pullback (trend reset), providing a discounted price zone for new short positions and offering profit-taking opportunities for earlier sellers.
Our trading plan for this session is to sell GBPUSD at 1.3488, anticipating a move below the midline (ML) support at 1.3462. The technical target for this trade, based on our London-New York session projection, is set at 1.3417.
The stop-loss for this setup is placed above MH of the bearish structure at 1.3505, maintaining proper risk management.
This trade idea aligns with our trend-following strategy and is supported by real-time price action analysis.
📉 Short Bias Confirmed
🎯 Entry: 1.3488
🛑 Stop Loss: 1.3505
✅ Take Profit: 1.3417
Trade safe, manage your risk, and stay blessed.

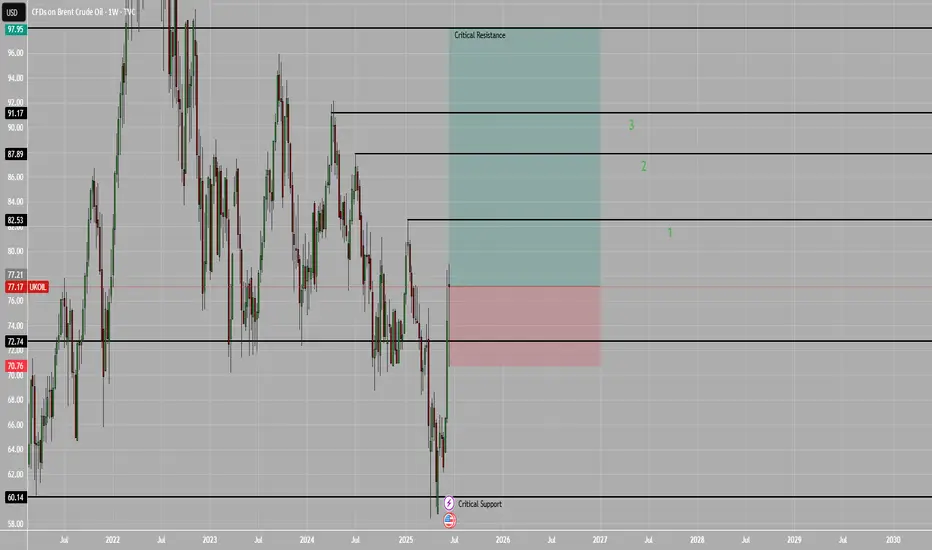
UKOILHello Traders
Oil will be Bullish in the next months
Bottom Support in 60$
and Goals 87, 91, 94, and 98
The most Important Resistance
is 98
If the Price closes this month above 72.74$, The target in the next goal will be achieved
Hope you Good luck
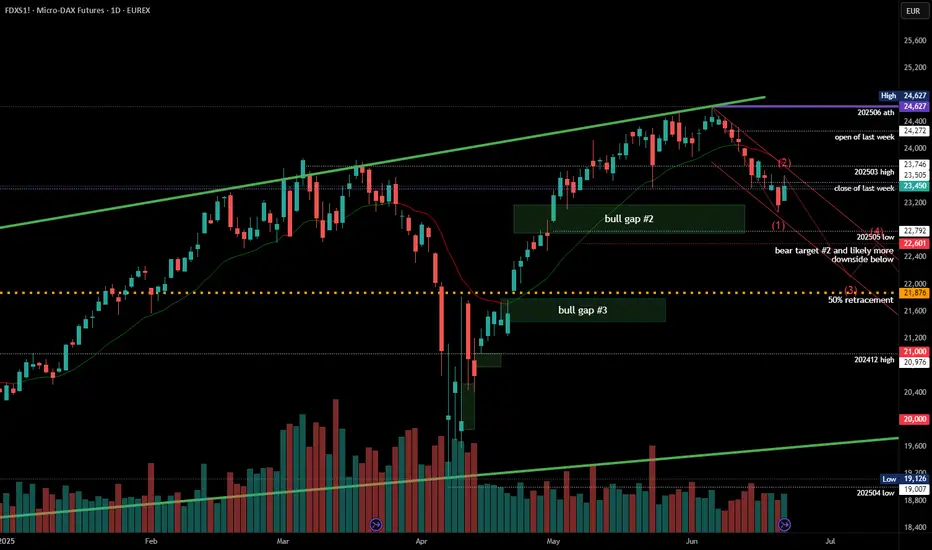
#202525 - priceactiontds - weekly update - dax futuresGood Day and I hope you are well.
comment: Full bear mode. Bulls tried 3 times to get some pullback going but only huge rejections on every try and since we have crossed the daily ema, we have not touched it or came close to it. Maybe we see some sideways movement around 23000 but given my uber bearish expectation due to US bombs on Iran, I can see a giant move down to 22000 and some stalling around it. Any price above 23700 means I am wrong and markets continue to ignore every risk under the sun.
1500 points down by the bears in two weeks is decent enough for a first leg. I market two potential W5 targets for the next weeks.
current market cycle: most likely new bear trend which can bring us to 21k or 20k over the next weeks
key levels for next week: 22000 - 23700
bull case: Can they try another “ignore the risk” move after the weekend news? I doubt it but anything can happen, so my invalidation for the bears is 23700. If they print it, we move sideways but I can not, for the life of me, see this printing new highs. If you are still holding long term longs on anything, I think you are late on running for the exit.
Invalidation is below 22900
bear case: Bears have been given another gift by orange face. The selling started two weeks ago, so it has nothing to do with Iran but it will likely help in confirming the trend and maybe accelerate it. The drawn channel is a rough guess for now. We have seen slow and steady liquidation the past 2 weeks and now we could see a shift to a huge “run for the exits” and type of “liberation-day” markets. 22000 is the big next target for bears since I expect 23000 or lower to get hit immediately on futures open.
Invalidation is above 23700
short term: Full bear mode. 23000 is almost a given and we could move quickly to 22000 over the next days. If we produce an island gap with the previous bull gap 22800-23100 (don’t take those numbers per tick value, this is not an exact science, many algos see the gap differently) it’s a huge confirmation and it could not be closed for months. If we do a big gap down and bulls close it, much less chance for the bears to continue down faster.
medium-long term from 2025-06-22: New bear trend has likely started on 2025-06-05 and we saw W2 conclude on Friday. Daily close below 23000 will be the confirmation for the bears and I have drawn 2 potential final W5 targets. I have written that we will see 20000/21000 again over the summer for many weeks/months now, this even is just another excuse for “analysts” to justify the move down.
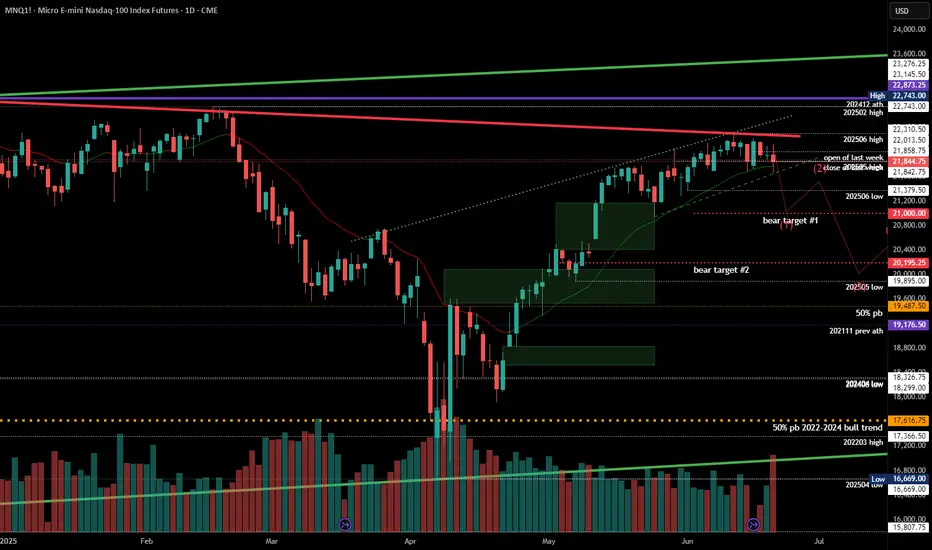
#202525 - priceactiontds - weekly update - nasdaq e-mini futuresGood Day and I hope you are well.
comment: Full bear mode. Below 21600 we see 21000 come real fast and bulls can kiss 22000+ goodbye for months or years. Market has not found enough buyers above 22000 for a month and we not got another potential huge risk-off event which will likely be too much for big institutions to ignore. Print above 22000/22100 means I am wrong.
Last week my bearish thesis was that we go down from last Friday but since market did not touch the daily ema for so long, we got another week sideways. Now bears got help from orange face and I can not see them coming back from this as well.
current market cycle: trading range - daily close below 21500 confirms my thesis
key levels for next week: 20900 - 21800
bull case: Still no close below daily ema but markets failed to print higher highs for 2 weeks now. If we gap down and print below 21500, you can not hold long on hope. Got nothing for the bulls unless they print above 22000 again and even then we can only expect sideways.
Invalidation is below 21500
bear case: I have laid out my bear case for the markets enough by now. I see a move below 21500 as confirmation and especially a daily close below. 21000 is the next obvious target before we can expect a pullback. 20400ish would be my next target below since that is the big bull gap close.
Invalidation is above 22000/22100
short term: Full bear mode. Expecting a big futures gap down on open and a daily close below 21500 if not 21000, which would mean we are in W1 which could be a spike and then only move sideways before W3 comes around. I have drawn a probably path down over the next weeks.
medium-long term - Update from 2024-06-22: Daily close below 21500 is my validation for the new bear trend which has the first bigger target at 21000 but I think we will printed below 20000 again this year. Structure is obviously not yet bearish, so don’t be early if you want confirmation and can’t/won’t scale in to shorts higher. Getting into longer term shorts above 21500 seems like the banger trade right now.
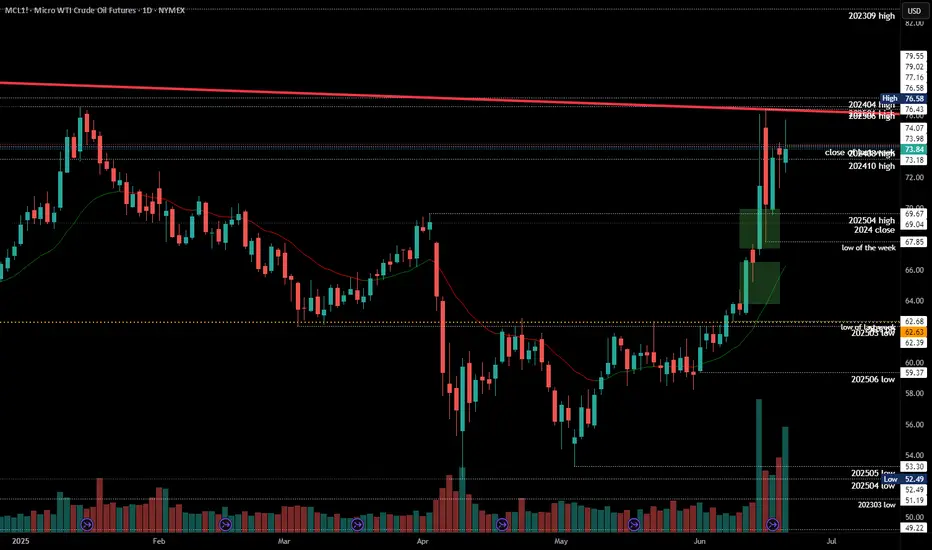
#202525 - priceactiontds - weekly update - wti crude oilGood Day and I hope you are well.
comment: Many gaps on different time frames and I only marked the ones from the daily. Next targets above for the bulls are 80 and the 2023-09 high at 82.91. I think we can see a futures gap up above 81 and then another huge pullback. Supply shock for Oil is still not there or we would not see the market pull back that much. Given the current macro risk we can only expect higher prices but the swings are too wild for me tbh.
current market cycle: bull trend but trading range on 1h tf
key levels: 67 - 83
bull case: Bulls have all the arguments on their side. Their only issue is that we are still seeing 5-10% intraday swings to both sides and only if the pull backs become smaller and we leave gaps behind, can we go meaningful higher and stay there. We have two open gaps on the daily chart but market would have to stay above 70 now to confirm them. 77 is the next target for the bulls which would be a higher high above the 2024-04 high.
Invalidation is below 70 - if we drop below, we most likely continue sideways inside the big range until we maybe get another big breakout above
bear case: US bombs on Iran. Interesting to see if we stay below 77 and move sideways. I can not see it but I obviously did not saw the 11% pullback on Monday as well. That was insane. Best bears can hope for is to move sideways and continue with the deep pullbacks. Bears can also make big money on these wild swings, which is not something seen in strong bull trends.
Invalidation is above 77
short term: Bullish but too cautious to trade it. Future gap ups were sold heavily and market has not found acceptance above 73 for the entire week. Still expecting 77 to get hit and there is no reason why we can’t see 80$ on oil over next 2 weeks.
medium-long term - Update from 2025-06-22: No bigger opinion other than “don’t be a bear here”. No idea if market can sustain the buying and stay above 70 for longer or even 80 for that matter. Too many big risks which will move the market big time.
#202525 - priceactiontds - weekly update - bitcoinGood Day and I hope you are well.
comment: Full bear mode. Bulls still trying to make bears doubt it and we are not moving fast enough but we are also not making higher highs. We are close to my validation level for the bears, which is a daily close below 100k. I do think any print above 104k would invalidate my thesis. Targets for bears today/tomorrow are 98k and if we have enough momentum we see 90k.
We are still seeing bigger tails above daily bars which means bulls are trying but since are printing lower lows for two weeks, they are failing. Bears now need to move strongly below 100k and then we can start the acceleration down.
current market cycle: trading range until follow-through below 100k
key levels: 100k - 111k
bull case: Bulls are still hopeful, that’s why we are still above 110k but the next touch could break it and I doubt many will hold long or scale into new ones there. Best bulls can get right now is to go sideways for longer and stay above 100k. I mean… Staying above 100k is as bullish as it get’s if you be honest.
Invalidation is a daily close below 100k - next support below 100k is 98k and then comes 93k
bear case: Bears need to print below 100k and close below. That’s the whole story. Next targets below are then 98k and 93k, breakout-re-test prices. Until they achieve that, it’s slightly higher probability that we move sideways but this market won’t be able to hold above 100k if big indexes sell-off.
Invalidation is above 107k
short term: Bearish but could wait for confirmation below 100k. I doubt we get above 107k again and continue inside the range
medium-long term - Update from 2025-06-22: Daily close below 100k is confirmation. First target below 100k is 97k the breakout retest and after that is the 50% retracement around 93k. I have no bullish for the next weeks/months. Once the gap to 97k closes we are likely in a bear trend again and I expect to hit at least 85k over the summer.
