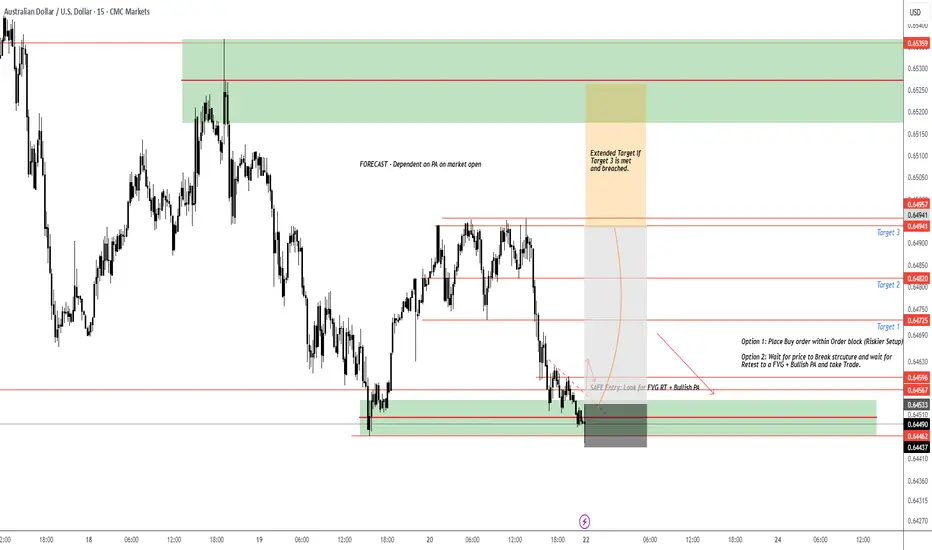
AUDUSD Potential Long - Dependent on PA Market openAUD/USD Long Setup – 15M Chart Analysis
Looking at a potential long on AUD/USD after price tapped into demand and swept liquidity. The area aligns with a fair value gap and previous order block, suggesting interest from larger players.
Two Entry Options:
1. Aggressive: Buy limit at the order block (riskier, no confirmation).
2. Conservative: Wait for break of structure, then retest into FVG with bullish price action for confirmation.
Targets:
Target 1: 0.6470
Target 2: 0.6480
Target 3: 0.6490
Extended Target: 0.6530 (only if 0.6490 is breached and price holds above)
Important Notes:
This setup is forecast-based and depends on how price opens and reacts.
Entry should follow a clear confirmation, especially after a liquidity sweep.
Ideal confirmation: Break of structure followed by a retest with bullish PA on lower timeframes (M5/M1).
Invalidation: A clean break and close below 0.6430 would invalidate this idea.
Stay disciplined. Trade the plan, not the prediction.
Priceaction
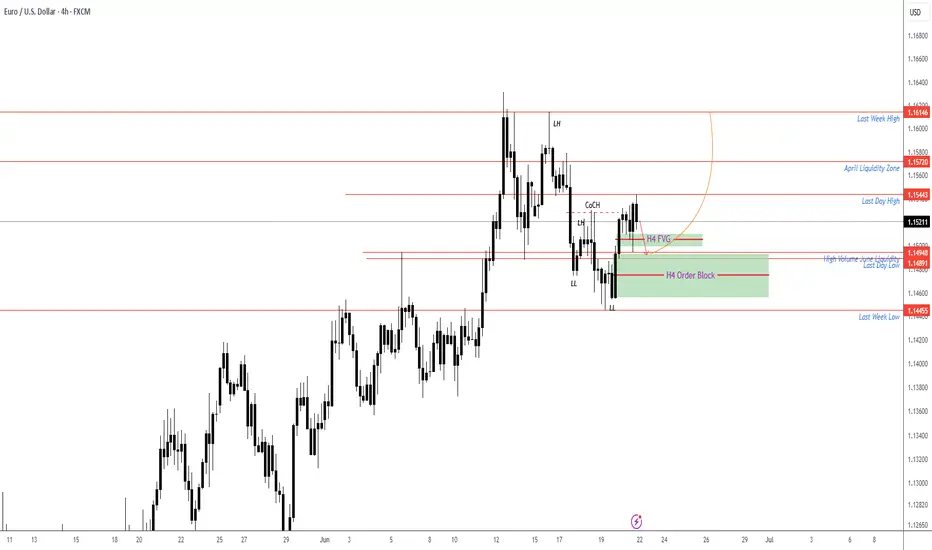
EURUSD M15 Forecast - Check related IdeaAs explained in previous post we are expecting a pull back down to our order block (H4) then a bullish reversal to retest last weeks highs (1.16) region. If price breaks and closes above the M15 supply zone will have to re-evaluate and potentially take a long position from a retest into a FVG.
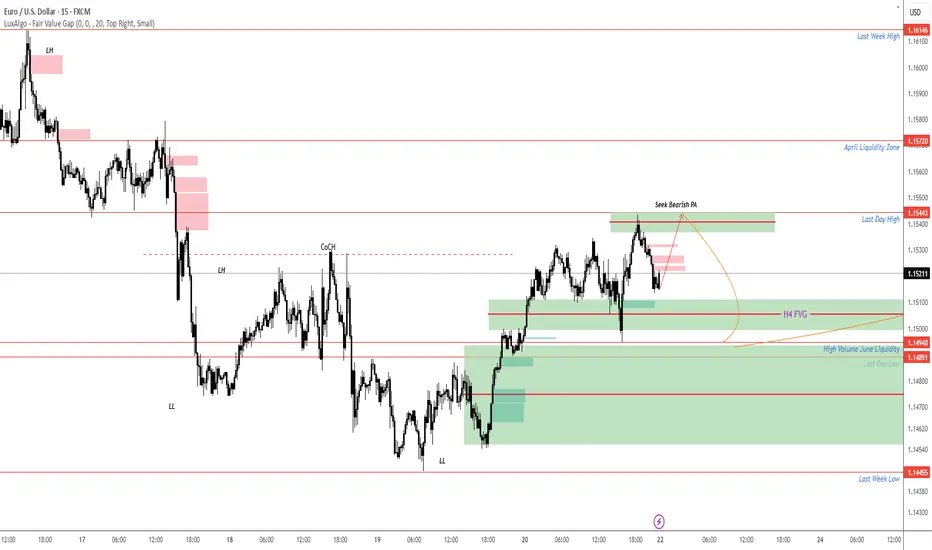
EURUSD to Retest 1.16 regionWatching the 1.1490–1.1450 zone for a potential bullish reaction. This area includes a 4H Fair Value Gap and Order Block. If price gives a 15M CoCH within this range, I’ll look to enter long.
Targets: 1.1540, 1.1570, and 1.1610
Invalidation below 1.1440
Patience until price delivers a clear setup.
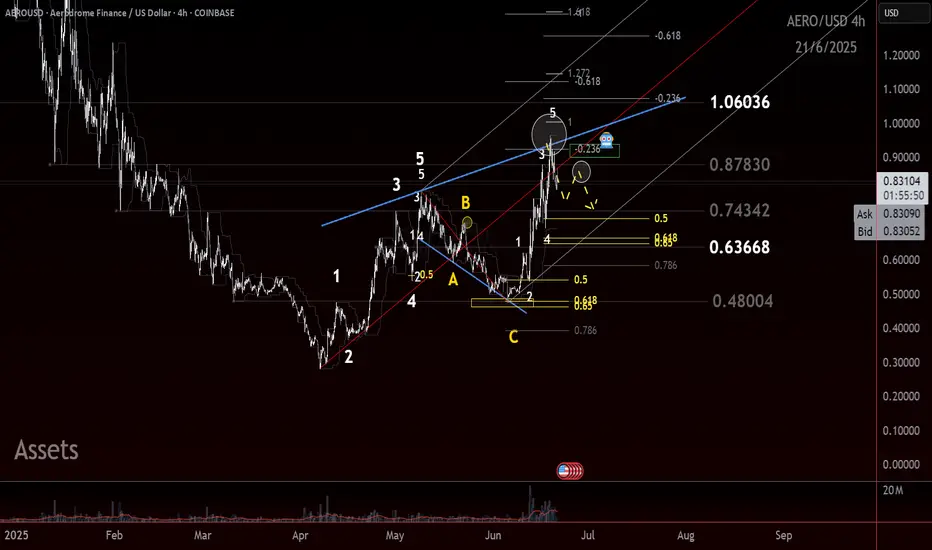
AERO: Clears the Runway! Can it gain altitude!?AERO gave a valid long setup
We were eye a possible retrace of an impulsive move and it displayed enough to trigger a rules-based entry.
Technical Breakdown
Key structural elements supported the setup:
Initial leg up showed impulse-like behavior
Pullback found support at a clearly defined AOI
Multiple MLT levels aligned with a common zigzag framework
Swift bounce off the Golden Corner Pocket (GCP)
Break and close above 0.54 completed the impulse structure
Prior resistance flipped into support
Volume confirmed the move, and price reached the first algo target, producing a reactive wick and confirming potential of algo activity.
This created a textbook TDU-style GCP/Algo/C-3 setup with measured entry and exit.
Risk Management
Partial profit was taken at the first MLT zone
Stop loss was moved into profit post-structure break
Scenario planning:
If move continues: positioned
If move stalls as a larger zigzag: no loss
Outlook
Attention now shifts to the next actionable level, possible second entry long
0.62 is the AOI for re-entry atm
Ideal scenario = Continuation in a wave 3, obvi
Alt scenario = Clean corrective to AOI + long
Bear scenario = Zig Zag complete
Conclusion
The trade played by the book!
Confluence across AOI, GCP, MLT, and volume created a qualified entry — not a guess.
This remains a great example of structure over sentiment and waiting for the market to meet criteria before engaging.
ETHUSD 4H Chart | ETH Bearish SetupThis chart highlights a possible bearish breakdown scenario for Ethereum (ETHUSD) on the 4H timeframe.
🔍 Key Levels:
Breakdown Confirmation Level: $2,362
Target 1: $2,151
Target 2: $1,954
(Optional Target 3: $1,750 if added)
📉 After multiple failed attempts to break above resistance, ETH price is now testing a critical support zone. A confirmed breakdown below this level could trigger further downside towards the mentioned targets.
Ichimoku Cloud shows weakening bullish momentum, supporting the potential for a bearish move.
Use Proper Money Management

+177% in last hour $1.33 to $3.69 $NXTTThis is what I mean when I say Power Hour 🚀 NASDAQ:NXTT
The move triggered exactly at 15:00 and went into power vertical
Can't wait for market to open next week, hot summer coming 🤑

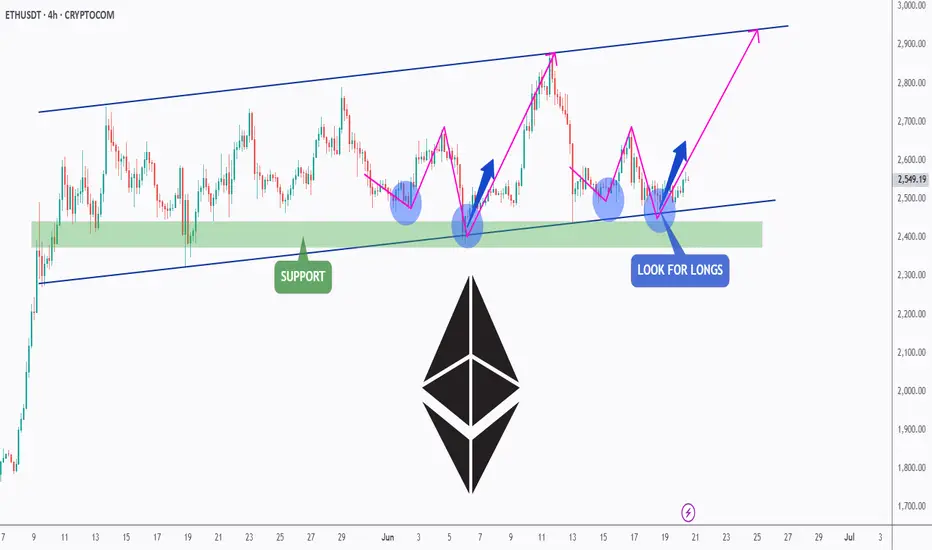
ETH - Do you Notice a Pattern here? I DO...Hello TradingView Family / Fellow Traders. This is Richard, also known as theSignalyst.
📈I find ETH 4h chart as it looks like history repeating itself.
Previously in 1 to 5 June, it formed a slight lower low before starting the next big bullish impulse leading towards the upper bound of the channel.
📚 Today, ETH just formed the slight lower low we are looking for.
Is it time for the next bullish impulse to start? well it will be confirmed after breaking above the last major high at $2,600.
What do you think?
📚 Always follow your trading plan regarding entry, risk management, and trade management.
Good luck!
All Strategies Are Good; If Managed Properly!
~Rich
20.06.25 Morning ForecastPairs on Watch -
FX:EURJPY
FX:EURNZD
FX:EURUSD
A short overview of the instruments I am looking at for today, multi-timeframe analysis down to what I will be looking at for an entry. Enjoy!

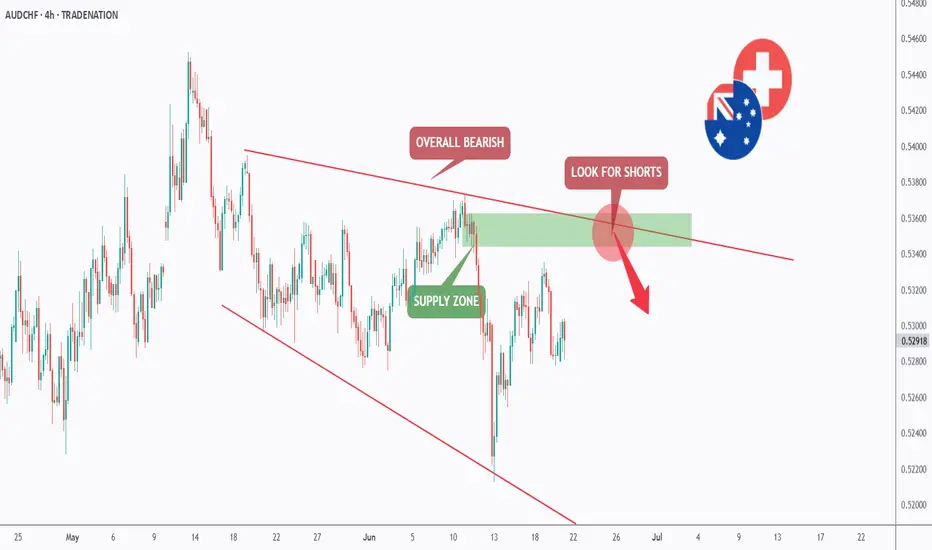
AUDCHF - Wait For it!Hello TradingView Family / Fellow Traders. This is Richard, also known as theSignalyst.
📈AUDCHF has been overall bearish trading within the flat falling broadening wedge pattern marked in red.
Moreover, the green zone is a supply.
🏹 Thus, the highlighted red circle is a strong area to look for sell setups as it is the intersection of the upper red trendline and supply.
📚 As per my trading style:
As #AUDCHF approaches the red circle zone, I will be looking for bearish reversal setups (like a double top pattern, trendline break , and so on...)
📚 Always follow your trading plan regarding entry, risk management, and trade management.
Good luck!
All Strategies Are Good; If Managed Properly!
~Rich
Disclosure: I am part of Trade Nation's Influencer program and receive a monthly fee for using their TradingView charts in my analysis.
GU-Fri-20/06/25 TDA-DR 1.34921 hit, potential bearish continue!Analysis done directly on the chart
Follow for more, possible live trades update!
I trade from level to level and see how price
reacts to interest zone. I adapt my sl and tp
based on market conditions and as well the
risk per trade but generally 1% max risk or
lower.
Active in London session!
Not financial advice, DYOR.
Market Flow Strategy
Mister Y

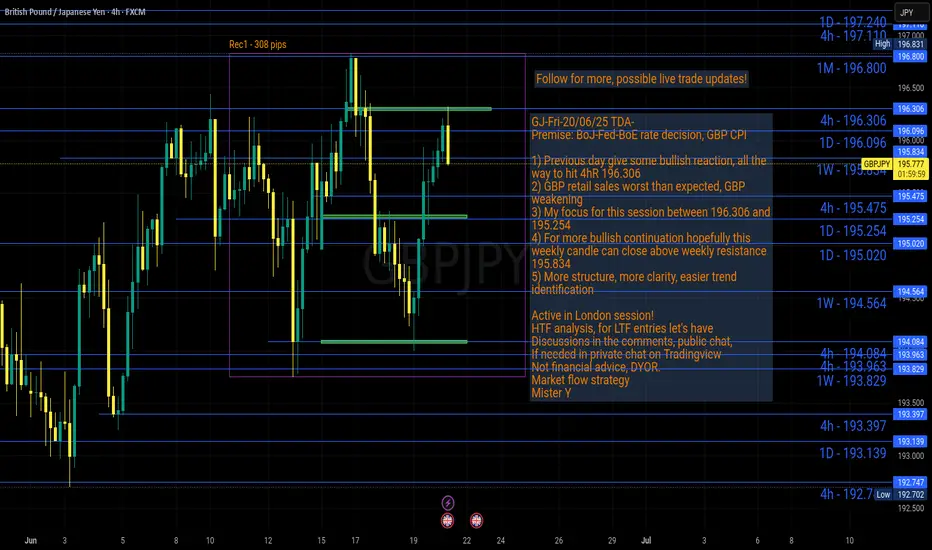
GJ-Fri-20/06/25 TDA-Will weekly candle close above WR 195.834?Analysis done directly on the chart
Follow for more, possible live trades update!
Feedback from you guys:
1) Is daily posting really helpful or better focus on
less posts?
2) Is there any way to improve more the quality
of posts?
Comment down below, really appreciate the responses!
Active in London session!
Not financial advice, DYOR.
Market Flow Strategy
Mister Y
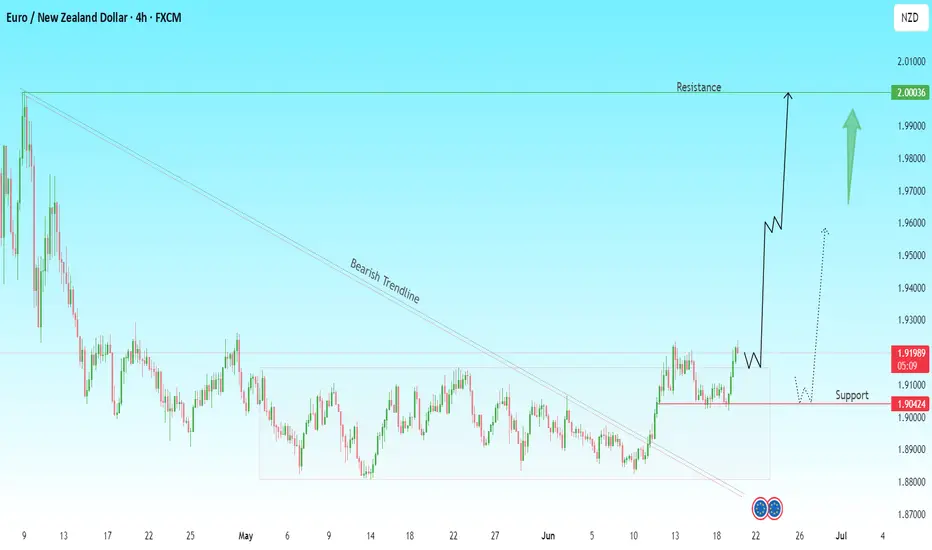
EURNZD Breakout Incoming? Watch This Zone Closely!The Euro has broken out of a long-standing bearish trendline, signaling a potential shift in momentum.
🔍 Key Levels to Watch:
Resistance: 2.0000 (psychological & technical level)
Support: 1.9042
Current Price: 1.9202
What I'm Seeing:
Price has broken the descending trendline and is consolidating above support.
A successful retest of the 1.9042 support zone could trigger a bullish wave toward 2.0000.
Two scenarios to watch:
Aggressive move: Price continues upwards from current consolidation.
Retest play: Price pulls back to support, forms a higher low, and then launches.
📊 Trade Idea (Not Financial Advice):
Buy zone: 1.9050–1.9100 (upon confirmation)
Target: 2.0000
Invalidation: Clean break below 1.9000
Momentum is building, and a rally toward 2.0000 could be on the horizon. Patience is key — wait for confirmation.
What are your thoughts on EUR/NZD? Bullish or bearish?
Another Banger $2.82 to $13.10 with 364% total move $APVOCatching just a piece of this kind of move pays a lot when moves are 300%+
Sitting at +72% realized gain over the past 3 days since the week started, from just 5 trades!
More to come this market is awesome
NASDAQ:APVO

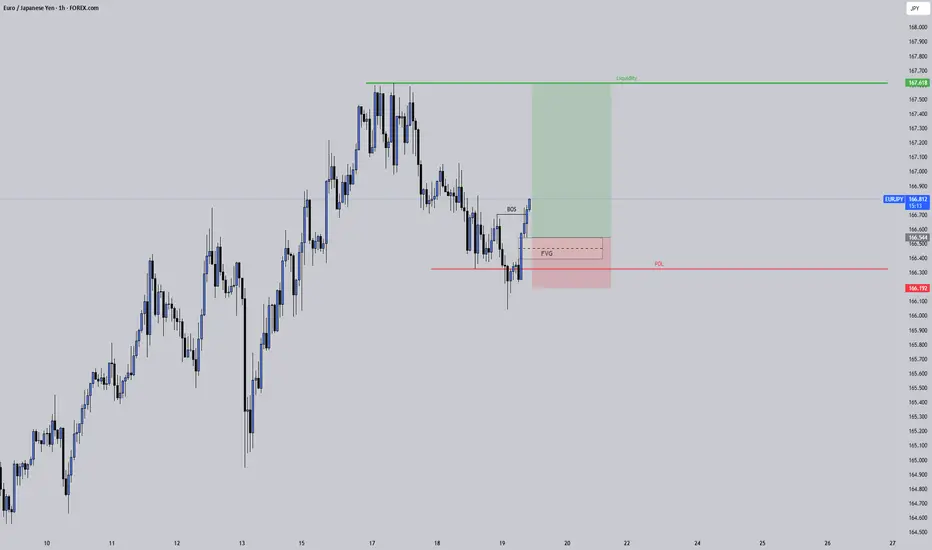
EURJPY – The Sweep That Sparked the ShiftSometimes the cleanest moves start with discomfort.
This EURJPY setup began with a sweep below the Previous Day’s Low (PDL), clearing out weak hands and gathering liquidity. That was our first clue.
Then came the Break of Structure (BOS), a confirmation that the market had shifted bullish.
Now will be waiting for price to retrace back to the FVG, where it found its footing and launched upward. Smart money cleared the lows, shifted structure .
Stick to the process. Trust what the chart is telling you.
Don’t chase, align.
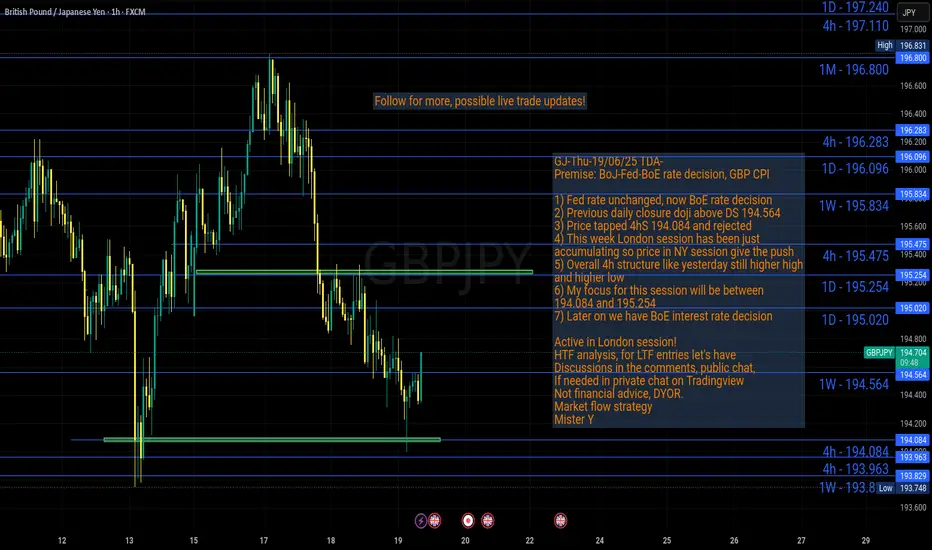
GJ-Thu-19/06/25 TDA-Eyes on BoE interest rate decisionAnalysis done directly on the chart
Follow for more, possible live trades update!
Focus on your trading time. If you have missed
a move but it wasnt in your trading time
then you haven't missed anything.
Active in London session!
Not financial advice, DYOR.
Market Flow Strategy
Mister Y
19.06.25 Morning ForecastPairs on Watch -
FX:EURGBP
FX:EURAUD
FX:AUDNZD
A short overview of the instruments I am looking at for today, multi-timeframe analysis down to what I will be looking at for an entry. Enjoy!

GU-Thu-19/06/25 TDA-Fed rate unchanged, now BoE rate decisionAnalysis done directly on the chart
Follow for more, possible live trades update!
Few beneficial things by posting public ideas
1) I improve a lot by doing this every single day
2) People can benefit from my analysis
3) Everyone can still trade their own style and
Strategy and having general idea on htf.
4) Taking myself accountable and be consistent in what I do
5) I can watch and rewatch as many times I
Want and learn more and more
Active in London session!
Not financial advice, DYOR.
Market Flow Strategy
Mister Y

2025-06-18 - priceactiontds - daily update - daxGood Evening and I hope you are well.
comment: Market has not traded above prior day’s high for 9 sessions. Can we do 10 and accelerate down? I would love it but it’s getting a bit unlikely without a better pullback. I can not see bulls coming back from this tbh but I have been wrong about this before. Bears need a big breakout below and accelerate down. Bulls some higher highs to continue sideways between 23000/24000.
current market cycle: broad bull channel on the weekly chart. Daily chart is in a trading range 23000 - 24500
key levels: 23000 - 24000
bull case: Any higher high will do and could lead to couple of legs up for 24000. Whole story because right now they don’t have any arguments besides having support around 23300 and bears unable to make meaningful lower lows. Time-wise we have been going down for 9 sessions and at some point bulls will give up hope and we flush down if they don’t reverse strongly over the next 1-2 sessions.
Invalidation is below 23000.
bear case: Clear target for bears is 23000 and leaving behind a decent gap 23700-24000. They are favored since we are only printing lower highs. Bears have to keep it below 23400 or risk hopeful bulls buying for 23505 which was last week’s close and if we close this week above it, it will be a weekly bull bar and likely a doji. That’s neutral and good for bulls. For this to go down, bears have to print a weekly bar closing on it’s low and below prior support.
Invalidation is above 23500.
short term: Neutral around 23300 but I think we can do 23000 this week. Don’t bet on the breakout before it happens. Shorts closer to 23500 are likely good, unless strong bulls overwhelm the bears tomorrow.
medium-long term from 2025-06-15: Bull trend has most likely concluded. Long term shorts are fine. Stop has to be at least 24508. I see it 70% or more that we will see 22000 before end of August.
trade of the day: Selling anything close to 23400 and buying anything at 23300. The early pump before EU open was a nasty bull trap but shorts with stop above yesterday’s high 23567 were the obvious trade.

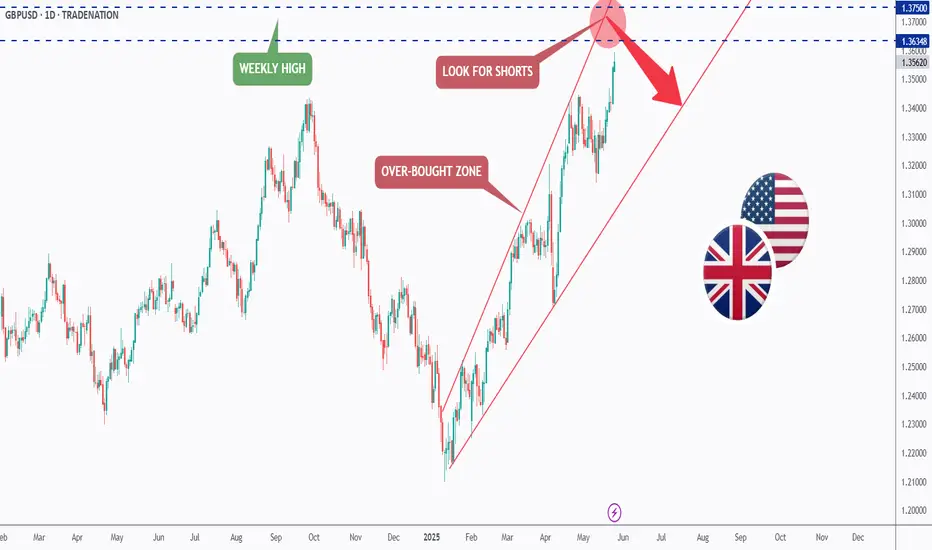
GBPUSD - One More Leg for Bears to Take Over!Hello TradingView Family / Fellow Traders. This is Richard, also known as theSignalyst.
📈GBPUSD has been overall bullish trading within the rising broadening wedge pattern marked in red.
However, it is currently approaching the upper bound of the wedge acting as an over-bought zone.
And the $1.365 - $1.375 is a strong resistance zone.
🏹 Thus, the highlighted red circle is a strong area to look for sell setups as it is the intersection of resistance and upper red trendline acting as a non-horizontal resistance.
📚 As per my trading style:
As #GBPUSD approaches the red circle zone, I will be looking for bearish reversal setups (like a double top pattern, trendline break , and so on...)
📚 Always follow your trading plan regarding entry, risk management, and trade management.
Good luck!
All Strategies Are Good; If Managed Properly!
~Rich
Disclosure: I am part of Trade Nation's Influencer program and receive a monthly fee for using their TradingView charts in my analysis.
CHFJPY - Bullish... but not for long!Hello TradingView Family / Fellow Traders. This is Richard, also known as theSignalyst.
📈CHFJPY has been overall bullish trading within the rising channel marked in blue. However, it is currently retesting the upper bound of the channel.
Moreover, the red zone is a strong structure and resistance.
🏹 Thus, the highlighted red circle is a strong area to look for sell setups as it is the intersection of the upper blue trendline and resistance.
📚 As per my trading style:
As #CHFJPY is around the red circle zone, I will be looking for bearish reversal setups (like a double top pattern, trendline break , and so on...)
📚 Always follow your trading plan regarding entry, risk management, and trade management.
Good luck!
All Strategies Are Good; If Managed Properly!
~Rich
Disclosure: I am part of Trade Nation's Influencer program and receive a monthly fee for using their TradingView charts in my analysis.

18.06.25 Morning ForecastPairs on Watch -
FX:GBPJPY
FX:EURCAD
FX:CADJPY
A short overview of the instruments I am looking at for today, multi-timeframe analysis down to what I will be looking at for an entry. Enjoy!

GU-Wed-18/06/25 TDA-Amid middle east tensions, USD strengtheningAnalysis done directly on the chart
Follow for more, possible live trades update!
Just like a person that wants to become a doctor,
an engineer or whatever. It needs to study, learn,
apply, improve, and repeat the process again and again.
You can't pretend to know how to trade, if you haven't
gone through the process of study, learning, applying
and improving.
Active in London session!
Not financial advice, DYOR.
Market Flow Strategy
Mister Y
