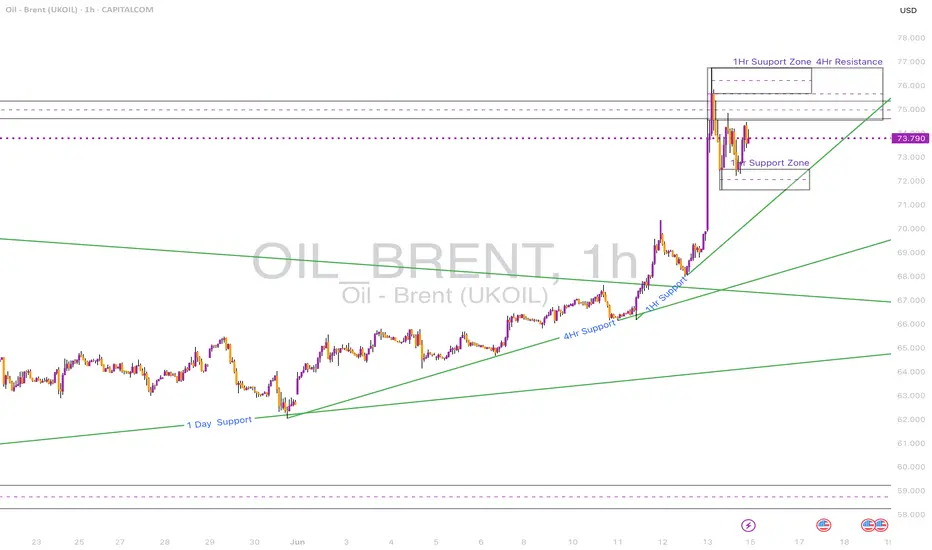
Brent Crude Hits Key Supply Zone After BreakoutPrice has aggressively broken out from the descending wedge and reached a strong 4H & 1D resistance zone between 74.50–76.00.
• 1D Chart: Sharp breakout from long-term descending trendline. Approaching resistance from Feb-April supply area.
• 4H Chart: Bullish structure confirmed by higher lows and breakout of ascending channel.
• 1H & 23m Chart: Consolidating beneath resistance, forming a triangle structure.
Key Zones:
• Support: 71.50–72.00
• Resistance: 74.50–76.00
Bias: Neutral short-term (range). Bullish if 76 is broken and held.
Priceaction
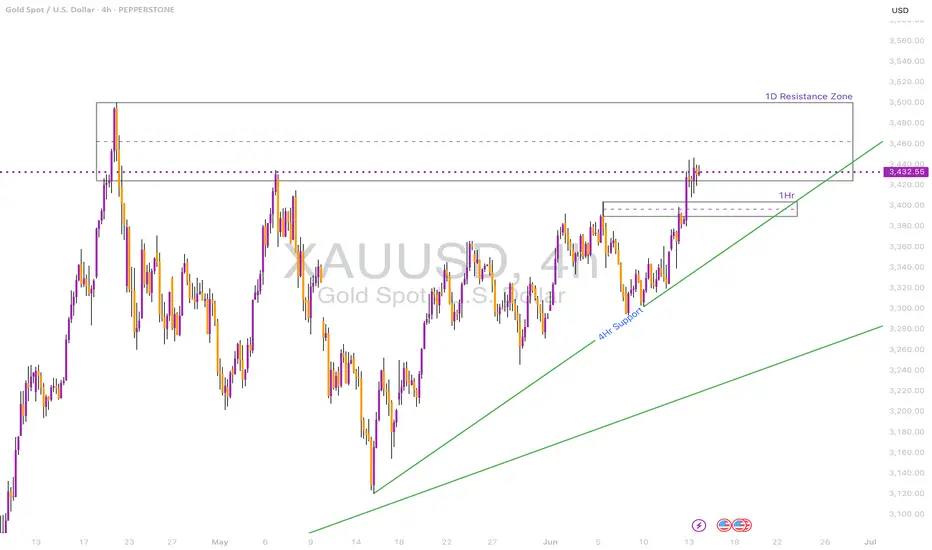
Gold Testing Daily Resistance – Will the Breakout Hold?Gold is currently testing a major 1D resistance zone at 3432–3450 after a strong bullish move.
• 1D Chart: Price has rallied back into the resistance zone after bouncing from ascending trendline support.
• 4H Chart: Strong momentum candle broke through the prior 4H resistance zone at ~3360, confirming bullish pressure.
• 1H & 23m Chart: Price is holding within a bullish channel, but showing signs of consolidation under key resistance.
Key Zones:
• Support: 3380 / 3360
• Resistance: 3432–3450
Bias: Bullish above 3360. Needs daily close above 3450 for continuation.
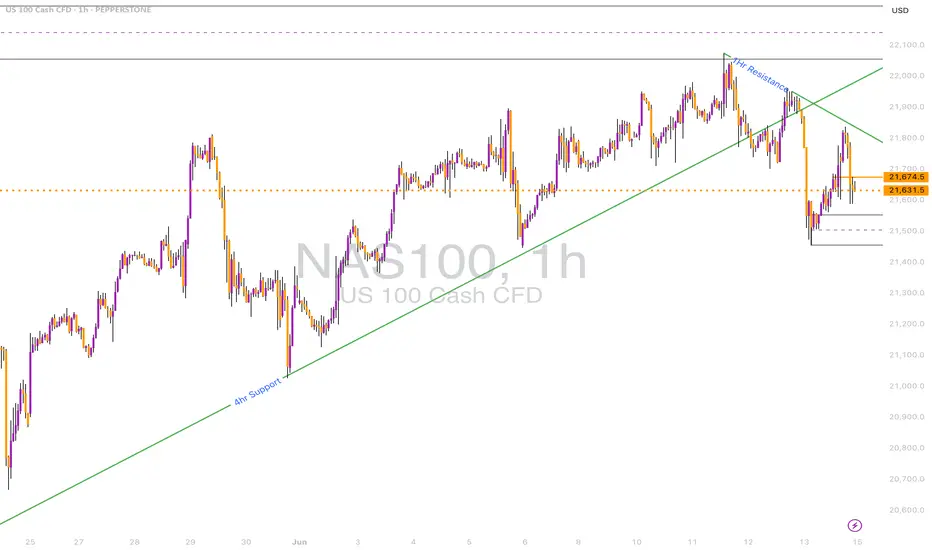
NASDAQ Pullback or Reversal? Watching 4H Support ZonePrice is reacting from the 1D resistance zone around 21,950 and now hovering near a 4H support zone at ~21,520.
• 1D Chart: Long wick rejection from resistance.
• 4H Chart: Break of rising wedge and rejection from 1H trendline.
• 1H & 23m Chart: Clear bearish order block formed. Price consolidating under broken structure.
Key Zones:
• Support: 21,500 / 21,325
• Resistance: 21,900 / 22,000
Bias: Bearish below 21,750. Retest of support expected.
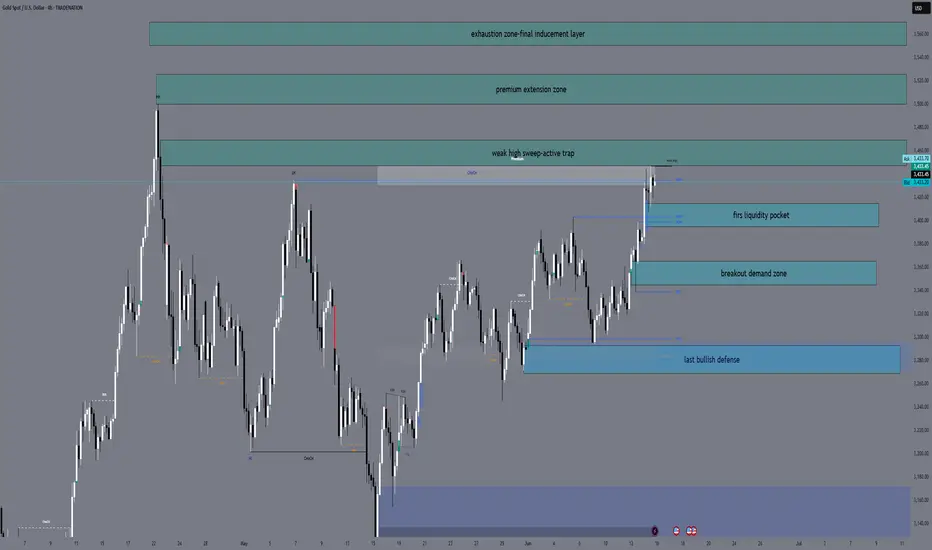
XAUUSD H4 Outlook — 16 June 2025👋 Hello team, here’s where we stand before the upcoming key week:
🔎 The Narrative
Gold remains in bullish control after weeks of controlled expansion.
The clean breakout above previous major highs triggered liquidity resets that cleared significant weak-handed positions.
Last week’s sweep into 3447 activated premium liquidity, trapping late buyers at the edge of impulsive highs. But the game is far from over — smart money continues to rotate liquidity at these extreme levels, using premium expansion to build further trap pockets both above and below.
Behind this technical expansion, macro tensions continue to fuel underlying gold demand. Geopolitical uncertainties remain elevated with the Middle East escalation risk growing, while recent Fed positioning keeps rate path expectations flexible.
The upcoming FOMC decision later this week will likely act as the true liquidity catalyst — until then, gold remains positioned for further inducement cycles as both buyers and sellers continue to get baited into traps.
🔼 Premium Supply Zones
Price Zone Description
3447 – 3470 Weak high sweep — premium liquidity trap fully active
3500 – 3525 Main extension liquidity pocket — Fibonacci cluster (1.272 & 1.414 extensions)
3550 – 3570 Exhaustion inducement — full 1.618 premium extension stack
🔽 Demand Defense Zones
Price Zone Description
3415 – 3395 Minor imbalance recalibration — short-term liquidity refill zone
3365 – 3345 Core breakout OB + FVG overlap — main recalibration zone if pullbacks extend
3285 – 3265 HTF bullish structure base — BOS origin + deep recalibration defense level
🎯 Where We Stand Right Now
✅ Smart money holds full control inside premium expansion.
✅ Inducement layers remain open both above and below current price.
✅ We expect short-term liquidity sweeps before any major expansion unfolds.
✅ No change in bias — bullish structure remains valid while 3285 holds.
🔐 The Mindset
👉 This is not the place for aggressive chasing.
👉 Liquidity will continue to hunt both sides into key events ahead.
👉 Our job is not to predict, but to position with discipline once liquidity confirms displacement inside the calibrated zones.
🚀 If this breakdown helps you stay locked:
💬 Drop a 🚀, leave your thoughts & follow for full sniper-level updates as we approach a volatile week ahead.
Stay sharp — the trap is already in play.
— GoldFxMinds
USDJPY Trading RangeUSDJPY saw some corrections late on Friday. Overall, the pair remains sideways in a wide range of 143,000-145,100 and has yet to establish a clear continuation trend.
The wider band in the sideways trend is extended at 146,000 and 142,000.
The trading strategy will be based on the band that is touched.
Pay attention to the breakout as it may continue the strong trend and avoid trading against the trend when breaking.
Support: 143,000, 142,000
Resistance: 145,000, 146,000

Gold: silence on the charts—because the real money already movedThe gold market isn't reacting — it's confirming. The Israeli strikes on Iran? That’s the trigger. But the move started earlier. Price was already coiled, already positioned. All the market needed was a headline. And it got it.
Price broke out of the accumulation channel and cleared $3,400 — a key structural level that’s acted as a battleground in past rotations. The move from $3,314 was no fluke — it was a textbook build: sweep the lows, reclaim structure, flip the highs. Volume spiked exactly where it needed to — this wasn’t emotional buying. This was smart money pulling the pin.
Technicals are loaded:
— Holding above $3,396–3,398 (0.618 Fibo + demand re-entry zone)
— All major EMAs (including MA200) are now below price
— RSI strong, no sign of exhaustion
— Candles? Clean control bars — breakout, retest, drive
— Volume profile above price = air pocket — resistance is thin to nonexistent up to $3,450+
Targets:
— $3,447 — prior high
— $3,484 — 1.272 extension
— $3,530 — full 1.618 expansion — key upside target
Fundamentals:
Middle East is boiling. Iran is ready to retaliate. Israel is already escalating. In moments like these, gold isn't just a commodity — it's capital preservation. The dollar is rising — and gold still rallies. That means this isn’t about inflation, or rates. It’s about risk-off. Pure, institutional-level flight to safety.
Tactical view:
The breakout is done. Holding above $3,396 confirms the thesis. Pullbacks to that zone? Reloading points. While gold remains in the channel and momentum is clean, the only side that matters right now — is long.
When price moves before the news — that’s not reaction. That’s preparation. Stay sharp.

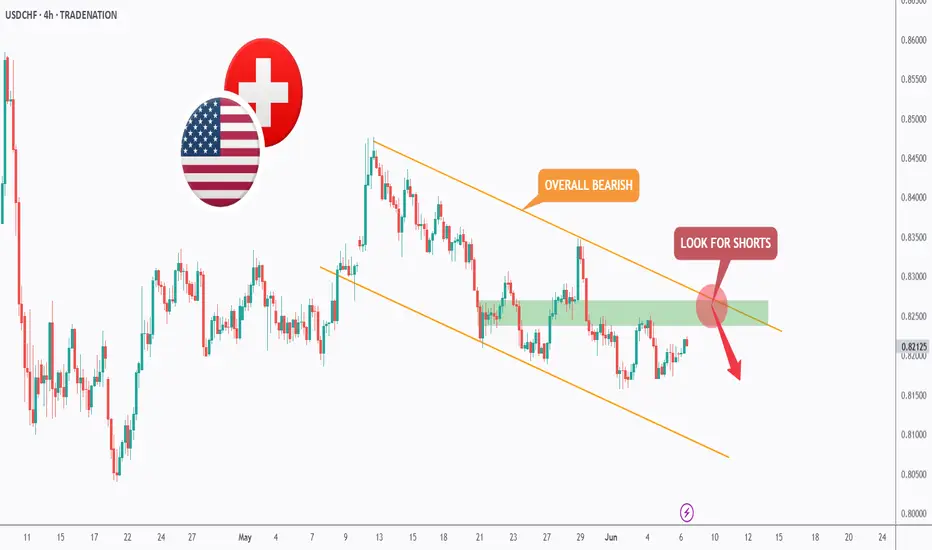
USDCHF - Follow The Bears!Hello TradingView Family / Fellow Traders. This is Richard, also known as theSignalyst.
📈USDCHF has been overall bearish trading within the falling channel marked in orange. And it is currently retesting the upper bound of the channel.
Moreover, the green zone is a strong structure.
🏹 Thus, the highlighted red circle is a strong area to look for sell setups as it is the intersection of the upper orange trendline and structure.
📚 As per my trading style:
As #USDCHF approaches the red circle zone, I will be looking for bearish reversal setups (like a double top pattern, trendline break , and so on...)
📚 Always follow your trading plan regarding entry, risk management, and trade management.
Good luck!
All Strategies Are Good; If Managed Properly!
~Rich
Disclosure: I am part of Trade Nation's Influencer program and receive a monthly fee for using their TradingView charts in my analysis.
ETH - Medium-Term Bulls Confirmed Control!Hello TradingView Family / Fellow Traders. This is Richard, also known as theSignalyst.
📈 As per our previous ETH analysis (shown on the chart), ETH rejected the green support zone and pushed higher, reaching our target near $2,750.
What’s next?
After breaking above the $2,750 structure marked in red, the bulls have confirmed medium-term control.
🏹 As long as the last major low at $2,700 holds, ETH is expected to remain bullish, with a potential move toward the $3,500 resistance zone.
📚 Always follow your trading plan regarding entry, risk management, and trade management.
Good luck!
All Strategies Are Good; If Managed Properly!
~Rich

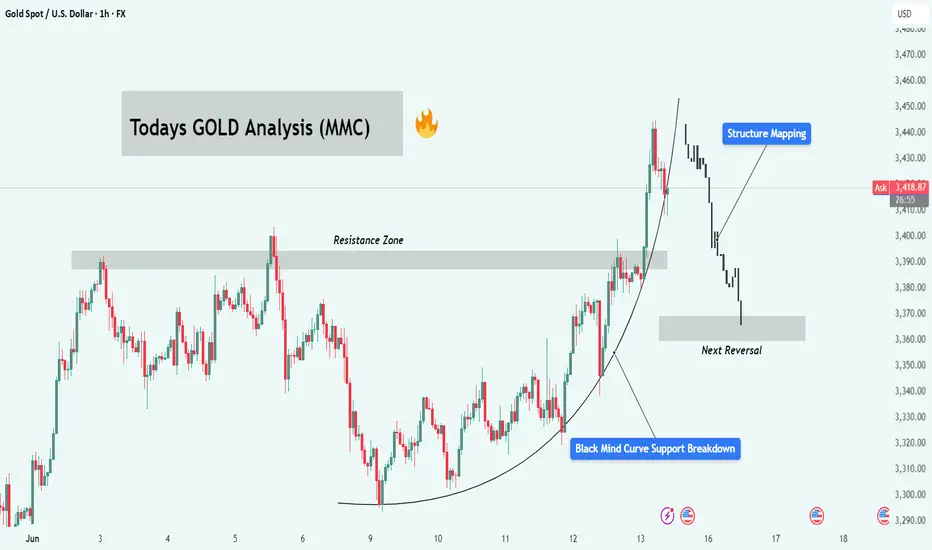
Gold (XAUUSD) Technical Breakdown : Structure Shifting + Target📍 Overview:
Gold (XAUUSD) has been displaying a classic technical development that traders need to pay close attention to. What initially looked like a smooth parabolic rally has now transitioned into a clear structure shift, as evidenced by the breakdown of a rounded support curve and rejection from a major resistance zone. The market is signaling a bearish retracement or even a deeper correction, and this setup offers potential trading opportunities both for short-term scalpers and swing traders.
📊 Chart Breakdown:
🔸 1. The Rounded Support Curve (Black Mind Curve):
The curve outlines a strong upward acceleration phase starting from the June 9 low.
This curve often acts like a dynamic support — similar to a parabolic trendline.
As long as price stays above it, the momentum remains intact.
In this case, Gold broke below the curve, which is a sign of exhaustion and potential bearish control.
🔸 2. Major Resistance Zone (~$3,417 – $3,427):
This level has acted as a ceiling multiple times in the past, visible in earlier highs from June 5 and 6.
Upon re-approaching this zone, price showed aggressive wicks to the upside followed by strong bearish candles — signaling institutional selling and profit-taking.
This triple rejection reinforced the resistance’s significance.
🔸 3. Structure Mapping and Transition:
After the breakdown, we observed a clean market structure shift: the formation of lower highs and lower lows, a key sign of bearish trend development.
The current price action is flowing downward in an organized pattern, suggesting further downside unless a strong reversal or bullish engulfing setup occurs.
🔸 4. Next Reversal Zone (~$3,360):
This area is identified as a high-probability support zone based on:
Past price reaction.
Previous accumulation zone from June 10–11.
Psychological round number proximity (e.g., $3,350 – $3,360).
Traders should monitor this level for potential reversal setups such as bullish engulfing candles, pin bars, or RSI divergence.
🧠 Market Psychology:
This pattern reflects a classic distribution phase at resistance after an emotionally driven uptrend:
Retail traders jump in late as the price approaches highs.
Institutions begin distributing (selling into strength).
Support breaks down as retail stops get triggered.
Price drops into a demand zone where accumulation may begin again.
Understanding this psychological cycle helps traders align with the smart money rather than chasing price action blindly.
🛠️ Potential Trading Plans:
✅ Scenario 1: Bearish Continuation
Wait for a retest of the broken structure (~$3,390 – $3,400).
Look for rejection patterns (e.g., bearish engulfing, shooting star).
Entry: ~$3,395–$3,400 | Target: ~$3,360 | SL: Above $3,420.
✅ Scenario 2: Bullish Reversal from Support
Monitor price action around $3,360 zone.
Look for bullish structure forming: higher lows, reversal candles, divergence.
Entry: On confirmation (e.g., bullish pin bar on 1H or 4H).
Target: Back to structure at ~$3,400–$3,410.
⚠️ Risk Considerations:
Avoid entering in the middle of the range.
Use proper stop-loss positioning to manage volatility.
Keep an eye on macro catalysts like:
US inflation reports
Fed commentary or interest rate decisions
Geopolitical tensions that can spike gold
🧭 Summary:
The market is unfolding a textbook technical setup:
Resistance rejection
Rounded support breakdown
Bearish structure
Approaching a high-probability support zone
Patience is key — let price come to your level. Watch the $3,360 zone for potential reversal, and use structure to guide entries and exits.
📌 Final Note:
This analysis is part of the MMC Methodology (Market Mapping Cycle), which focuses on identifying macro structure, confirming micro structure, and mapping turning points with precision.
Let the market reveal itself. Don't chase — plan and execute with clarity.
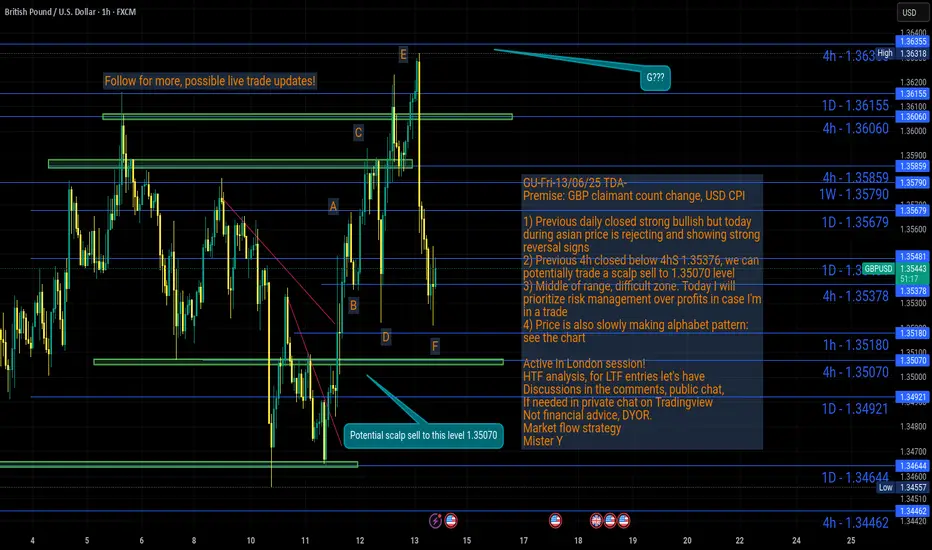
GU-Fri-13/06/25 TDA-Difficult zone, prioritize risk management!Analysis done directly on the chart
Follow for more, possible live trades update!
June definitely showing slower price action,
tighter range movement (average daily movement).
This is how markets work! Some months it gives
good push, wide average daily movement. Some others,
it gives less average daily movement and slower pushes.
Active in London session!
Not financial advice, DYOR.
Market Flow Strategy
Mister Y
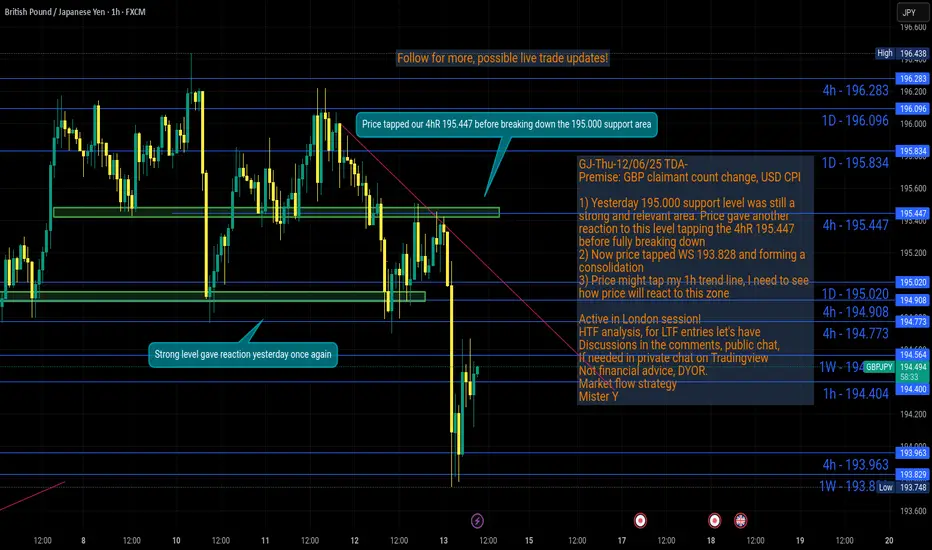
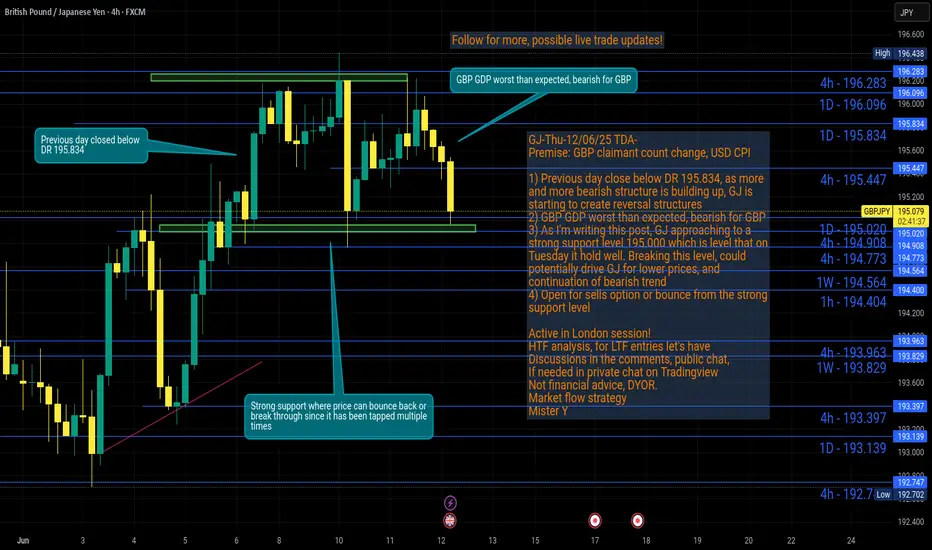
GJ-Thu-12/06/25 TDA-GJ breaking 195.000 support levelAnalysis done directly on the chart
Follow for more, possible live trades update!
No strategy has 100% win rate, this is when
risk management comes in handy.
We are humans, we all make humans errors
if you are manual trading and executing the
trades.
Active in London session!
Not financial advice, DYOR.
Market Flow Strategy
Mister Y
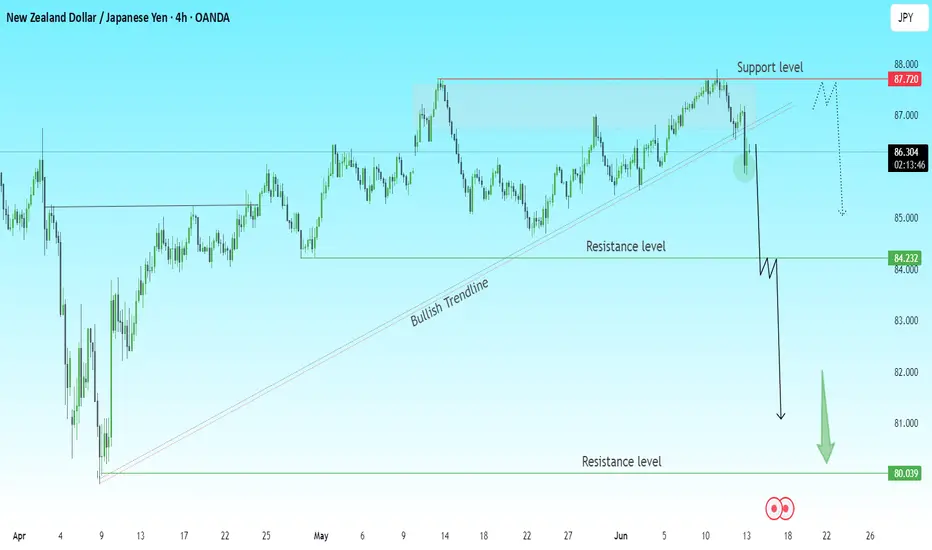
NZDJPY Breakdown Setup Alert | Technical AnalysisThe NZDJPY pair has broken the bullish trendline, signaling a possible shift in momentum.
Key Observations:
Price rejected the 87.720 resistance level
Clear break and close below the trendline
Pullback expected before continuation down
Targets:
📉 First support: 84.232
📉 Final support: 80.039
🔄 A retest of the broken trendline or horizontal resistance could offer a clean short entry opportunity.
Bearish Bias remains valid unless price reclaims and closes above 87.720.
💬 What do you think? Is this the start of a deeper correction for NZDJPY?
📈 Drop your thoughts and let’s discuss!
#NZDJPY #Forex #PriceAction #TrendlineBreak #TechnicalAnalysis #TradingView
13.06.25 Morning ForecastPairs on Watch -
FX:GBPUSD
FX:EURUSD
A short overview of the instruments I am looking at for today, multi-timeframe analysis down to what I will be looking at for an entry. Enjoy!

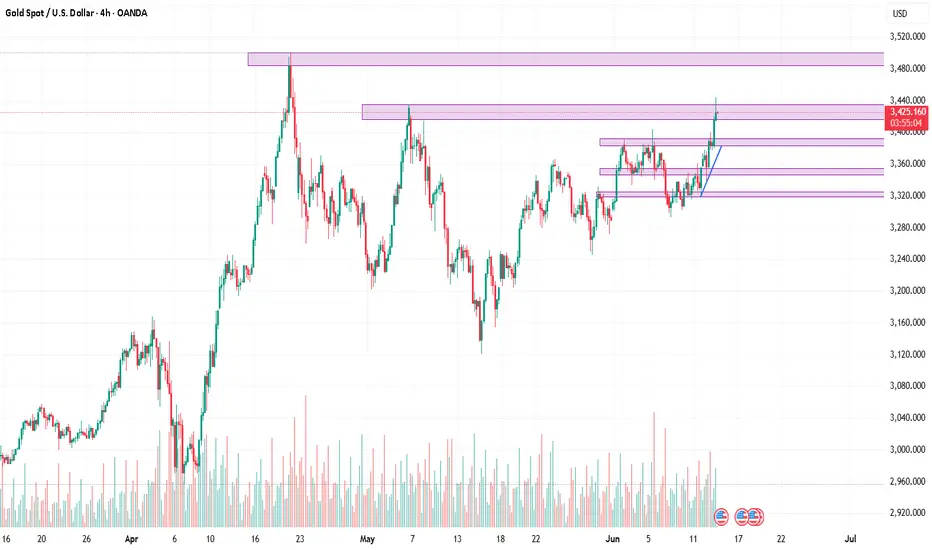
XAU/USD 4H Technical Analysis 13 June 2025Market Structure & Bias:
On the 4H chart, gold has broken out of a recent sideways range and formed a sequence of higher highs and higher lows. This “break of structure” (BOS) through the old swing high confirms a bullish bias.
Price action respects key support zones (demand areas) on retracements, suggesting underlying buying interest. The overall bias is bullish, driven by risk‐off sentiment. Support and resistance act as natural pause/reversal zones
For example, a demand zone/order block around ~3390–3400 (from the prior swing low) has been tested and held, fueling the recent rally.
Likewise, an imbalance (fair value gap) left below 3400 could attract buyers if price returns. We also note that a change of character (CHOCH) would occur only if price breaks below a higher-low; so far that has not happened.
In short, gold’s 4H market structure is bullish (higher highs/lows) and the trend looks set to continue upward unless a strong reversal forms. Key Levels (4H): We use classic pivot points to mark critical levels (using the last 4H high, low, close). Pivot points can project future support and resistance.
Based on recent swings, key levels are:
Pivot: 3424 (calculated from last bar’s H/L/C)
Support 1: 3413
Support 2: 3399
Support 3: 3374
Resistance 1: 3438
Resistance 2: 3449
Resistance 3: 3474
Price currently hovers just below R1. These levels align with congestion zones and Fib retracements (50–61.8% of the last $3290–3427 upswing), so expect active bidding near S1–S2 and selling around R1–R2.
Intraday 1H Trade Setups
Buy Zone ~3395–3405 (Bullish OB/Demand):
Entry: Long on dips into the order-block/demand area near 3395–3405 (just above S1).
Stop: ~3385 (≈$10 below entry zone).
Targets: TP1 ≈ 3438 (Resistance 1), TP2 ≈ 3450 (near R2).
Reason: This zone aligns with a prior institutional order block/demand and a 61.8% Fib retrace of the recent rally. Price has shown bounce here before, so a bullish reaction is likely.
Trigger: Look for a bullish reversal candle (e.g. bullish engulfing or pin bar) on 1H in this zone, or a market structure low (MSL) turning point. A break back above the high of that candle can serve as confirmation to enter.
Sell Zone ~3435–3445 (Bearish Retrace):
Entry: Short near resistance around 3435–3445 (just below R1–R2).
Stop: ~3455 (≈$10 above entry zone).
Targets: TP1 ≈ 3413 (Support 1), TP2 ≈ 3399 (Support 2).
Reason: This area is the upper end of the recent range. It contains a minor supply zone and the R1–R2 pivots. A liquidity sweep (stop-hunt) may occur above recent highs.
If price loses momentum here, expect a pullback.
Trigger: Watch for a bearish price action signal (e.g. a bearish engulfing candle or a double-top swing) on 1H. A break of the immediate lower low (lower than the last minor swing) would confirm a short-term change of character and signal entry.
Breakout Long ~3449+:
Entry: Long on a sustained break above R2 (≈3450). Confirm entry when price closes above 3449 on 1H.
Stop: ~3424 (just under the Pivot).
Targets: TP1 ≈ 3474 (Resistance 3), TP2 ≈ 3495+ (new highs).
Reason: A clean breakout of 3450 would indicate strong bullish order flow and trigger stop-run triggers. This would be a continuation trade in line with the 4H uptrend.
Trigger: A bullish candle closing above 3449 (ideally with above-average size) or a 1H break of structure (higher high over 3449) would signal entry.
Takeaway: Gold remains in a bullish 4H trend; focus on buying dips into demand zones and watch for clear candlestick triggers at support/resistance.
Strongest stock of the day with 3 Buy $CGTL1st and 3rd alert paid for the whole day, including 2nd which was cut quick at $1.70

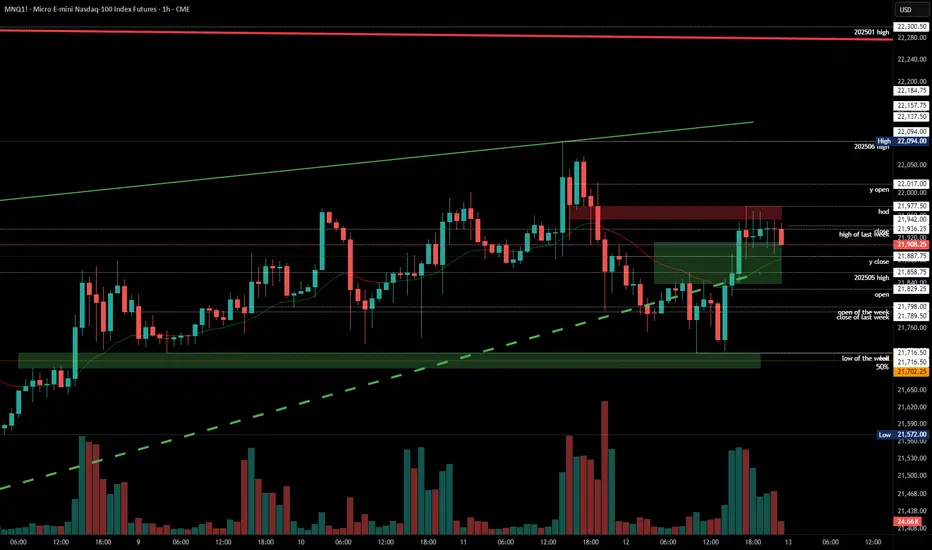
2025-06-12 - priceactiontds - daily update - nasdaq
Good Evening and I hope you are well.
comment: Neutral around 21900. 21700 was the lowest I expected and we printed 21716.5. Weekly close around 21900 is the most likely outcome for me. We have no acceptance above 21900 and none below 21800 as well. A trend day tomorrow would surprise me.
current market cycle: trading range
key levels: 21700 - 22100
bull case: Bulls want to close the week above 21800 to print a green one. They had spikes above 21900 but nothing else. They are still somewhat in control because we are not making meaningful lower lows and are still at the highs but price action is neutral since last week so no side has the clear advantage. Weekly close above 22000 would be a surprise to me.
Invalidation is below 21680.
bear case: Bears have to close the gap down to 21680 if they want more downside. Until then they have to fade everything above 21900 since that has been profitable for a week now. A weekly close below 21800 would be a decent sell signal going into next week and a clear break of the wedge. Problem for the bears is the same as for bulls on the other side. On the 4h chart we have big tails above and below bars. Market is completely in balance around 21850ish and therefor I expect a weekly close around that price.
Invalidation is above 22100.
short term: Completely neutral. New high or low would surprise me tomorrow. I expect a choppy session where mean reversion will likely be king.
medium-long term - Update from 2024-05-24: Will update this section more after the coming week but in general the thesis is as for dax. Down over the summer and sideways to up into year end. I don’t think the lows for this year are in.
trade of the day: Longing 21730 because it was support all week and the obvious trade.
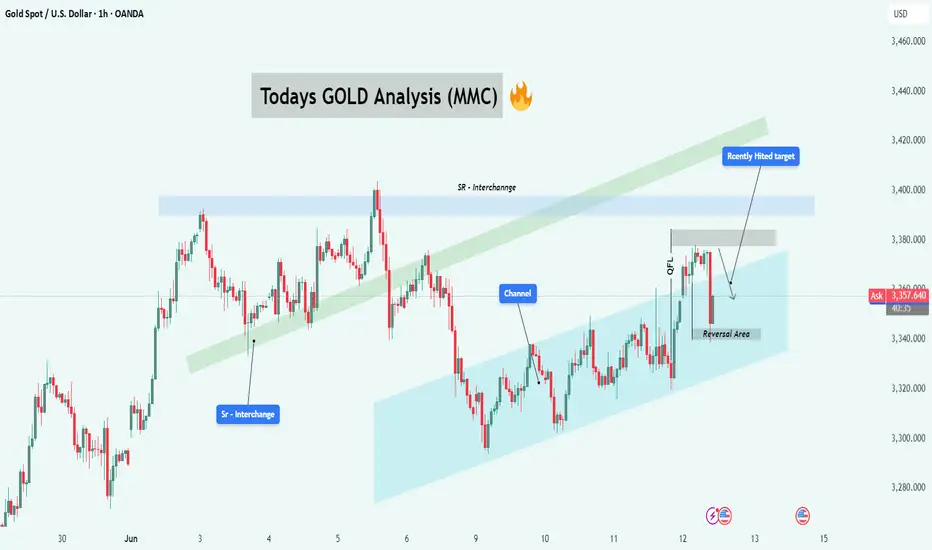
GOLD (XAU/USD) Technical Analysis: Bull Trend Pausing or Reverse🧠 GOLD (XAU/USD) Technical Analysis
GOLD has been trading in a broad bullish trend, supported by global uncertainty and consistent interest in safe-haven assets. However, today’s intraday structure shows signs of potential exhaustion after a clean tap of a major resistance/QFL zone.
In this analysis, I break down the key zones, trader psychology, market structure, and potential playbook for upcoming moves.
📊 Technical Structure Breakdown:
🔷 1. SR Interchange Zone – The Flip Level
Marked early in the chart, the SR Interchange area served as a major resistance, which was broken and then retested — confirming a classic S/R flip. This level added confluence to the uptrend that followed.
Trader Insight: This is where buyers got confident after the retest. Smart money often leaves footprints at such interchange zones.
🔷 2. Ascending Channel – The Guiding Rail
GOLD has been respecting an upward channel for several days. Price bounced multiple times off both upper and lower channel boundaries. This gives a clear roadmap for intraday traders to watch for bounces, midline reactions, and possible breakouts.
Channel dynamics: Right now, price has rejected from the top of the channel, suggesting possible movement back toward the midline or bottom rail.
🔷 3. QFL Rejection – Trap Zone Activated
Price recently hit the QFL zone, which aligns closely with previous highs and liquidity pools. This level acted as a liquidity trap where buyers got over-leveraged or late entries piled in — only to see a strong rejection right after.
This sharp drop from the QFL area signals institutional sell pressure or heavy profit-taking. It’s not just a pullback — it’s a signal.
🧱 Key Zones to Watch:
Zone Type Relevance
$3,380 - $3,400 QFL / Resistance Rejection point, likely full of stop-losses and liquidity
$3,340 - $3,320 Reversal Area / Demand Potential buyer re-entry and bounce zone
$3,300 and below Liquidity Pool If demand fails, price could slide into this liquidity zone
📉 Bearish Case: Reversal in Motion?
If the current rejection from QFL continues without any strong bounce at the reversal zone:
Expect price to retest the lower channel and possibly breakdown.
Sell pressure could increase due to trapped long positions trying to exit.
Target: $3,320 → $3,300 → possible $3,280 extension.
✅ Entry: Look for failed retests of the QFL zone or lower highs
📍 SL: Above $3,385
🎯 TP: First target near $3,320, then trail stops.
📈 Bullish Case: Controlled Pullback Before Lift-Off
If price finds strong support in the Reversal Area:
Look for bullish engulfing, hammer, or double bottom patterns in the area.
Could be a healthy pullback before continuation to $3,400+.
Target: $3,380 → $3,420 and even higher if breakout is strong.
✅ Entry: Confirmation after bullish reaction at $3,340 zone
📍 SL: Below $3,315
🎯 TP: $3,380+, trail if breakout holds
🔄 Trader Psychology in Action:
Late buyers entered after the breakout toward $3,380.
Smart money exited near the top or flipped bias near QFL.
Retail panic selling might happen if support fails, offering re-entry for institutions at better prices.
Discipline Tip: Let price confirm your bias. Don’t chase.
📌 Final Thoughts & Trade Plan:
GOLD is at a decision point. Whether you're trading intraday or swing, your focus should be on:
Watching how price reacts to the Reversal Area
Identifying fakeouts vs true breaks at channel boundaries
Staying patient for confirmation (don’t jump in on impulse)
This setup provides an excellent opportunity for both bullish and bearish traders — just stay unbiased and reactive, not predictive.
12.06.25 Morning ForecastPairs on Watch -
OANDA:JP225USD
FX:AUDJPY
FX:USDJPY
FX:GBPJPY
A short overview of the instruments I am looking at for today, multi-timeframe analysis down to what I will be looking at for an entry. Enjoy!

GJ-Thu-12/06/25 TDA-Bearish structure building up, will go down?Analysis done directly on the chart
Follow for more, possible live trades update!
If 195.000 support zone breaks, we can definitely
see GJ pushing lower and continue its bearish
momentum especially after GBP GDP worst than
expected which is bearish for GBP.
Active in London session!
Not financial advice, DYOR.
Market Flow Strategy
Mister Y
GU-Thu-12/06/25 TDA-Higher US CPI, why GU pumped? explained!Analysis done directly on the chart
Follow for more, possible live trades update!
Here's the tricky part of CPI, this year 2.4% higher
than last year 2.3% but GU still pumped, why?
Because consensus was 2.5% and since it released
2.4% which is lower than consensus, bad for dollar
thus GU pumping.
Active in London session!
Not financial advice, DYOR.
Market Flow Strategy
Mister Y

2025-06-11 - priceactiontds - daily update - daxGood Evening and I hope you are well.
comment: Much more reasons to buy below 23900 than to sell. I do think bulls showed strength today by printing 24193 and this could become a lower low, major trend reversal. Long stops have to be 23750 but there is decent chance could get there as well. I still think they will fail at the gap again and market will close the week closer to 24000 than to 23800. Anything above 24200 tomorrow would be a huge bull surprise and could lead to 24500 again.
current market cycle: broad bull channel
key levels: 23700 - 24500
bull case: Bulls need to keep this a higher low if they want 24500 again. Bulls see the 4 legs down and with today’s huge bull spike, they are likely confident that buying down here is great value. R:R is on their side since the upside is 700 points but they maybe have to risk 200. They reason that what bears wants to sell down here at huge prior support, the bull trend line and the open gap to 23750. Don’t be too early and wait for strong momentum to join.
Invalidation is below 23700.
bear case: Bears outdid themselves for 3 days now, compared to the price action the weeks before. But what now? Big support below us and who wants to sell this? If they see a strong 15m or 1h bar tomorrow, they just have to give up. If they don’t it likely means opex forces institutions to keep the market below 23900 because options need to expire worthless. I would never sell down here. If it goes to 23500, so be it.
Invalidation is above 24550.
short term: Neutral but waiting only for bulls to come around. I think 24200 is much more likely than 23500.
medium-long term from 2025-05-25: My rough guess from early May was down over the summer and up into year end. POTUS certainly helped with the 50% tariffs. I need to see market reaction next week and if there is no 180° reversal until Friday, they will become reality the week after and dax should do 20-30% down over the next months. Markets were not positioned for any risk what so ever. Now we got the atomic trade bomb.
trade of the day: Buying the strong 1hm bull bar 2 hours before EU opened or selling the news spike up to 24193. Both were easy to spot and went for many points without testing above the signal bar.

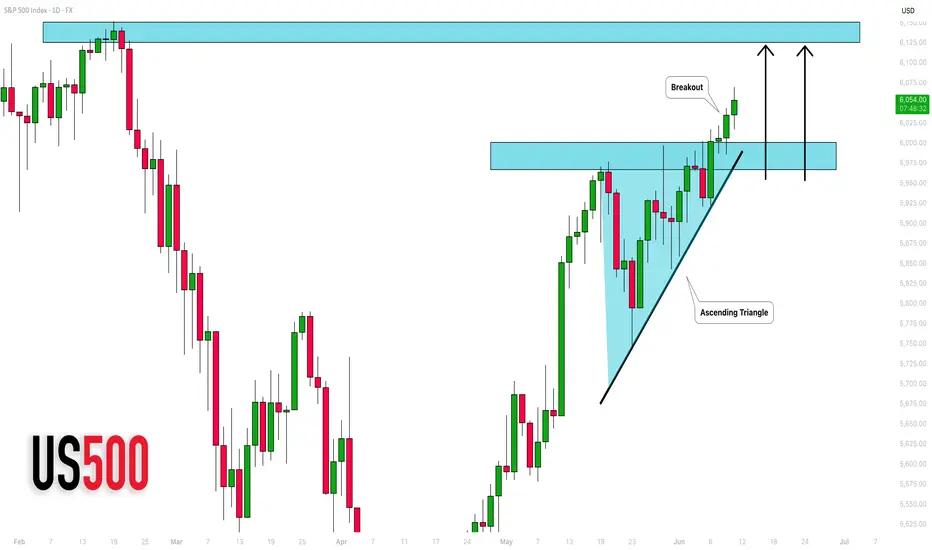
S&P500 INDEX (US500): More Growth Ahead
US500 broke and closed above a neckline of an ascending triangle
pattern on a daily time frame.
It is a strong bullish pattern that indicates a strong bullish interest.
With a high probability, buyers will push at least to 6124 resistance.
❤️Please, support my work with like, thank you!❤️
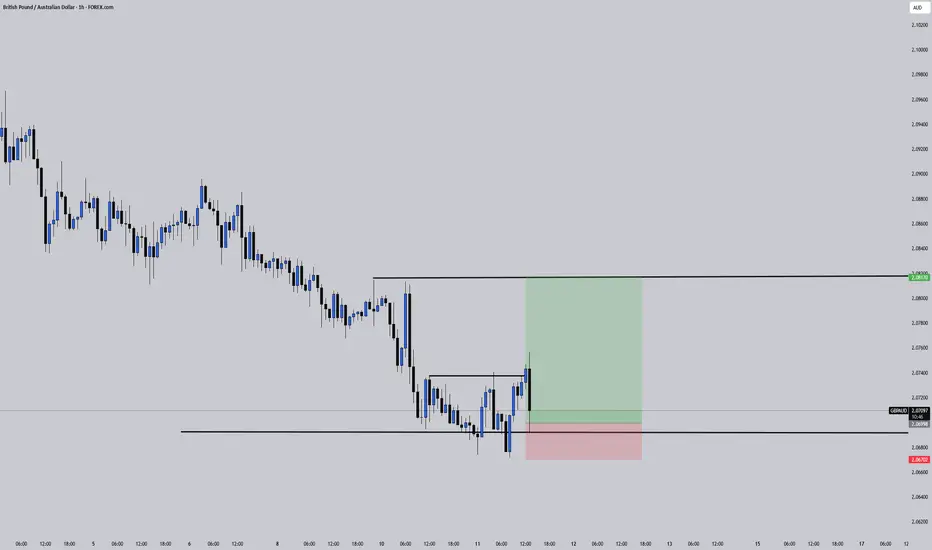
Did You Catch the Sweep & Shift on GBPAUD?Sometimes the market whispers its intentions before making a move — and this was one of those moments. This GBPAUD setup was built on the core principles of Candle Range Theory (CRT):
Sweep of the Previous Day’s Low (PDL)
Break of Structure (BOS) confirming a shift in momentum
Entry retracement into the Fair Value Gap (FVG)
What stood out here was the precision of the sweep and how price reacted cleanly after BOS, tapping into the FVG zone and immediately pushing toward the high-probability target.
No indicators, no noise, just clean market structure and smart money behavior.
The temptation to enter early was real, but the edge came from waiting for price to validate itself. A textbook example of how patience and plan adherence outweigh prediction .