EURUSD Direction | Daily Timeframe OutlookThese are the points we can take from the daily time frame :
1.EURUSD has broken through quite strong resistance, and we have not seen any wicks on any time frame, this indicates that EURUSD is still strong for buying
2.After finishing its uptrend, Eurusd fell to the weekly support that I marked,
3.After completing the correction phase, this week there was a fairly strong closing in the market structure shift (MSS) area
4.The conclusion is, eurusd will continue its upward trend, this is useful for daily traders as a direction to determine which trading positions are profitable
Priceaction

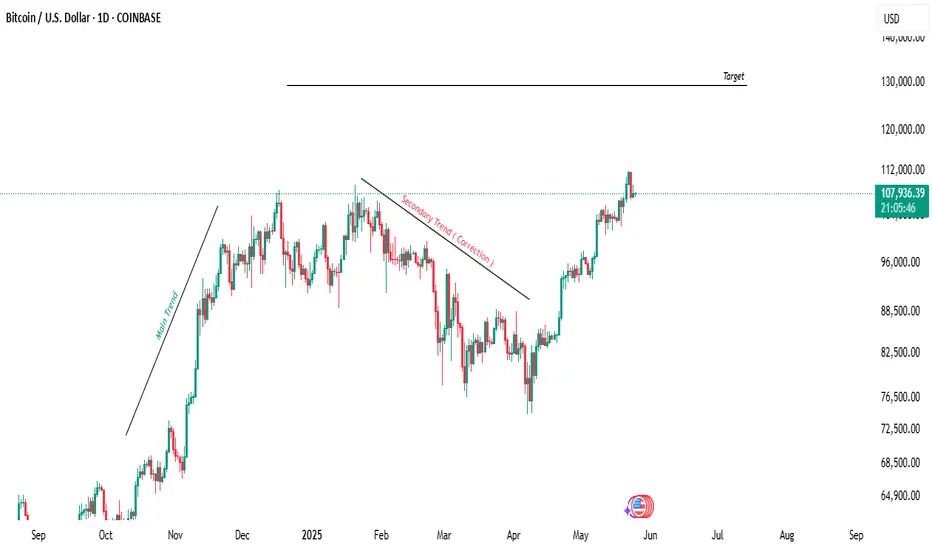
Bitcoin Daily Timeframe TargetAs we can see at Daily Timeframe :
1. As we have learned about market structure, bitcoin has finished its correction phase, and now in daily view, as the initial target bitcoin will touch the level that I have determined
2.Daily view will lead us to buy trade direction, this means the probability of buy is greater than sell, whoever takes sell trade will be eaten by whales
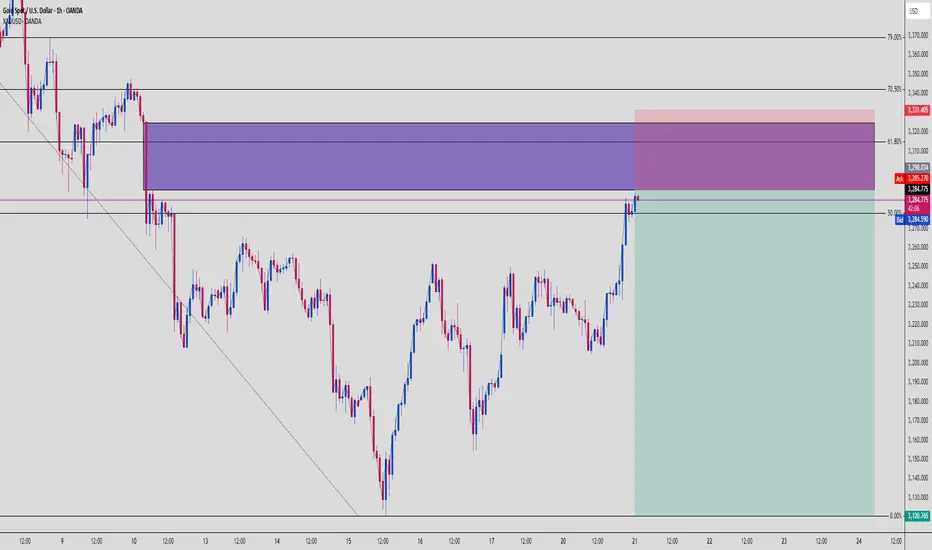
XAUUSD Taps Premium OB – Bearish Liquidity Trap Incoming!📉 XAUUSD Smart Money Setup – Bearish Rejection from Premium Supply Zone
Let’s get straight into it, fam. Gold (XAUUSD) just made a textbook move into a premium Order Block, and it’s screaming liquidity trap + reversal opportunity.
🧠 Market Structure Breakdown:
✅ Clean internal bearish structure
✅ Lower highs and lower lows maintained
✅ Current price rally = retracement into OB, not a reversal
This is a pullback into premium, designed to bait breakout buyers before slamming back down. Smart Money 101.
🔮 Key Confluences:
🟣 Order Block Zone:
3,290.000 – 3,331.405
Origin of impulsive bearish move
Aligned with supply imbalance and unmitigated sell orders
Tapped perfectly at 61.8%–79% Fib levels
🔻 Fibonacci Retracement (Swing High to Low):
50.0% → Current market price (3,286.370)
61.8% → OB mid zone
70.5% – 79% = ideal entry zone for institutional short positions
📍 Target Zone:
3,120.765 (0% Fib)
Solid RR with minimal drawdown potential
🧠 Smart Money Narrative:
Market induced sellers at the low
Rallied back up aggressively to entice breakout longs
Now entering sell-side OB where Smart Money is looking to unload positions
Retail sees a “breakout” — we see distribution. 💼
💡 Entry Strategy:
📌 Entry: 3,290 – 3,331 (OB + 70.5%–79% Fib)
📌 Stop Loss: Above 3,333 zone
📌 TP1: 3,210
📌 TP2: 3,150
📌 Final TP: 3,120
🎯 RRR: 1:4.5++ – chef’s kiss for swing traders
🔁 Risk Flow Checklist:
✔️ Structure confirms bearish bias
✔️ OB unmitigated + untouched since initial drop
✔️ High-volume price sweep prior to tap
✔️ Clean internal liquidity grabs before entry
This is the kind of setup you wait for — not force.
🧘 Pro Tip:
Let the OB do the heavy lifting. Don’t chase price — wait for the rejection signal:
Wick rejection
Bearish engulfing
Shift in internal market structure
Patience = profits. 💸
🧨 Summary:
This XAUUSD chart is a Smart Money masterclass:
Clean bearish BOS
Premium OB with Fib confluence
Trap setup above liquidity
Big RRR with minimal exposure
🗣️ Comment “GOLD SNIPER” if you caught the tap!
🚀 Save and study this setup — they don’t come often, but when they do, they pay big.
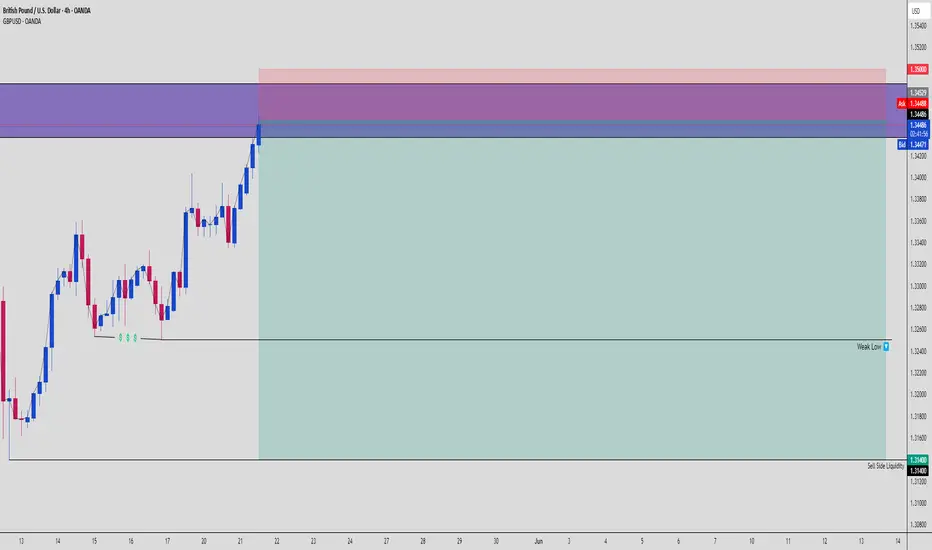
GBPUSD Hits Institutional Supply – Bearish Rejection Loading…⚠️ GBPUSD Smart Money Setup – Premium Price, Weak Low, Juicy Liquidity Below!
We’ve officially entered Smart Money playground territory on GBPUSD.
Here's what's happening:
🧠 Market Structure Narrative:
🔹 Price ran straight into a premium OB
🔹 Internal structure shift already played out
🔹 Now in distribution territory, prepping for a dump
Price has tapped into a high-probability sell zone (purple OB zone) between 1.34500–1.35000, where Smart Money is most likely positioned to unload shorts.
🟪 Order Block Confluence:
📌 OB Range:
Base: 1.34500
Cap: 1.35000
This zone caused the previous bearish impulse – unmitigated until now
Price reacted sharply upon entry = signs of institutional interest
💡 Clean, unmitigated supply = chef’s kiss setup.
🔻 Liquidity Engineering:
🧊 Below current price sits a “Weak Low” marked around 1.32400
💰 Below that: massive Sell-Side Liquidity at 1.31400
📌 This = high-probability magnet for Smart Money to drive price lower
🔁 Fibonacci Confluence (if applied):
Entry zone aligns with 70.5–79% retracement of previous impulse leg = premium risk zone for pro sellers.
💣 Entry Strategy:
🎯 Sell Zone: 1.34500–1.35000
📍 SL: Above 1.35100 (above OB + liquidity grab buffer)
📍 TP1: 1.32400 (Weak Low)
📍 TP2: 1.31400 (Sell-side Liquidity)
📍 RRR: Up to 1:5+ depending on entry precision
This is a swing trader’s dream — premium risk, maximum reward.
💡 Confirmation Tools:
✅ Bearish engulfing candle on LTF
✅ Internal BOS on M15-H1
✅ Rejection wick from OB or candle body stall = sniper entry
Be the sniper — not the FOMO chaser. 🎯
🧠 Key Lesson:
"Weak lows exist to be broken. OBs exist to be respected. Combine both = Smart Money sniper mode."
Let the trap trigger and ride the liquidity wave down.
🗣️ Drop a 💀 if you’re watching this setup play out!
📌 Save this chart — it’s a Smart Money blueprint.
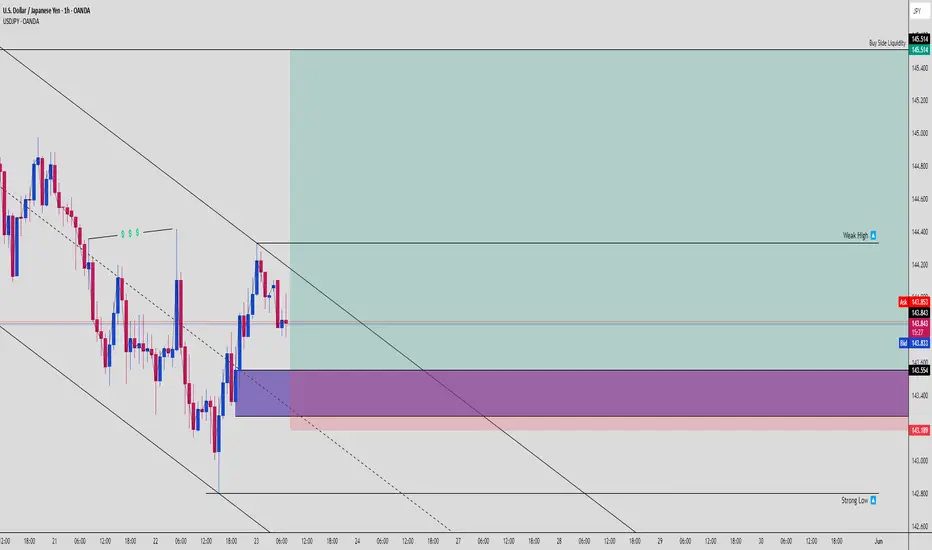
USDJPY: Smart Money Reloads at Demand ZoneThis pair is showing some next-level institutional behavior right now, and the play is looking ripe for a long position — here's why:
📉 Previous Sell-Off = Liquidity Engineering
USDJPY had a strong downward leg creating a perfect internal liquidity pool, then took out that internal high (marked by triple liquidity tags 💵💵💵) just above a descending channel. That was your classic fakeout / inducement trap.
🎯 Price Tapped Into a Fresh Bullish Order Block
Price dipped deep into a refined OB (purple zone) aligned with the lower channel and then wicked hard out of it. That move created a bullish rejection wick, confirming buyer interest from smart money.
You can see price forming a micro HL structure at the edge of the demand zone — premium setup for continuation.
📍 Key Confluences:
✅ OB sits right around the mid-channel EQ
✅ Demand zone is built on top of a strong low (142.680 area)
✅ Strong risk-to-reward setup aiming for weak high and buy-side liquidity
✅ Rejection aligns with a bullish change of character (ChoCh) from lower timeframes
💥 Targets:
🔹 TP1 - Weak High at 144.400
🔹 TP2 - Buy Side Liquidity sweep at 145.514
🔹 Extended Target - Ride it to channel top / HTF imbalance fill above 146.000
📈 Trade Idea Summary:
Entry Zone: Anywhere in the OB range from 143.554 to 143.189
Stop Loss: Below 143.000 or the strong low
Risk-Reward: Easily 1:5+ if targeting full range move
🚨 Why It Matters:
This chart screams smart money accumulation at the bottom of a channel. Retail traders might still be shorting the retracement — but smart money is loading longs while price consolidates at demand.
If price clears the weak high, it could ignite a bullish rally into the upper supply zones where liquidity lies.
💬 Comment "UJ MOVE" if you're entering this sniper long!
🔁 Repost this if you’re tracking it with your team!
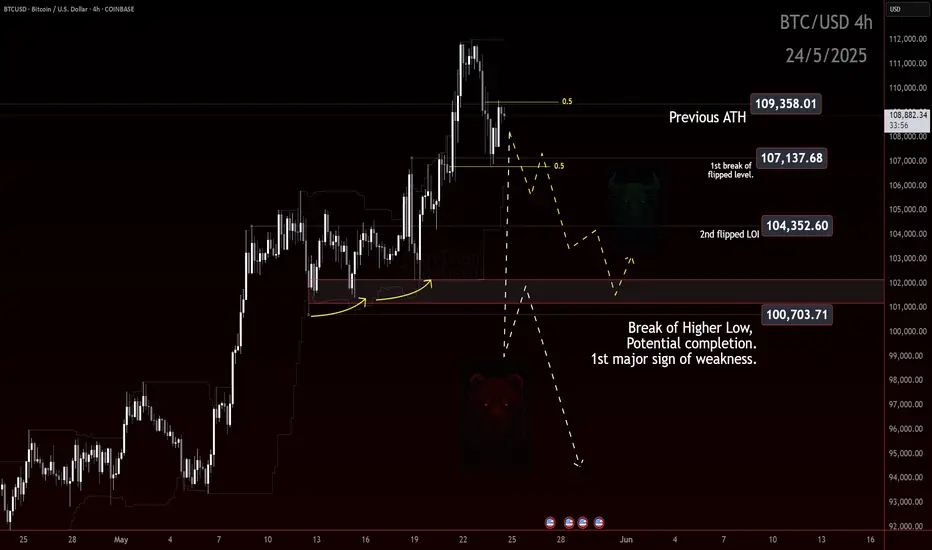
Bitcoin: LEVELS LOOKOUT!If you find this information inspiring/helpful, please consider a boost and follow! Any questions or comments, please leave a comment!
BTC on Watch: Short-Term Levels That May Show the Market’s Hand
#Bitcoin is hovering around all-time highs, but traders should be on high alert. There’s a visible level just beneath price that’s acting as the current line in the sand.
What to Look At
Rather than overanalyze, just focus on the chart. A clean level around $100k is marked — if that gives way, it may not just be a smaller degree pullback on news. It could be the start of something more revealing and deeper.
What Comes Next?
If price breaks that 107k zone, watch what the market prints in response. Does it flush impulsively? Does it grind? Those reactions will show intent — and possibly confirm or deny a larger corrective wave unfolding.
Outlook
We’re not guessing the future — we’re waiting to observe the market’s decision point. Eyes on that level. If it breaks, the chart will speak louder than words.
Trade Safe!
Trade Clarity!
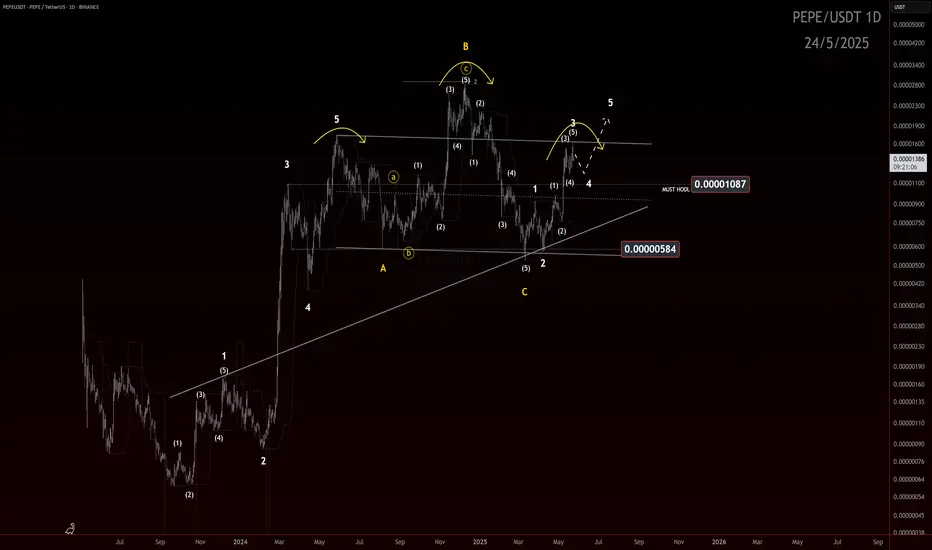
Impulse or Illusion? Key Level to Watch If you find this information inspiring/helpful, please consider a boost and follow! Any questions or comments, please leave a comment!
Recap
Since the price surge off the March 11 low, structure appears to be developing into a potential 5-wave impulse. However, with only three legs printed so far, it remains premature to confirm the full impulse structure.
Structure Assessment
The move resembles a possible ABC zigzag, but the center leg (possible wave 3) is showing strong impulsive characteristics — momentum, follow-through, and vertical lift. That raises the probability of it being an unfolding wave 3, rather than just a C wave.
What’s missing? A clear wave 4.
Until a fourth wave correction is established, and followed by a decisive wave 5, the bullish impulsive count remains tentative.
Outlook
📌 Key level: 0.00001087
The hold of this level will make the look of the structure ideal.
A break below 0.00001087 would dip into unacceptable territory for a developing wave 4 and opens the door to a bearish reassessment — and if the PA enters the price territory of the wave 1 cause a conclusive invalidation of the potential impulse.
✅ If price holds the level and a shallow wave 4 consolidates, we can then watch for signs of wave 5 to confirm the impulse and unlock bullish continuation potential.
Watch this level. Structure will confirm or collapse soon. More updates to follow.
Trade safe, trade smart, trade clarity.
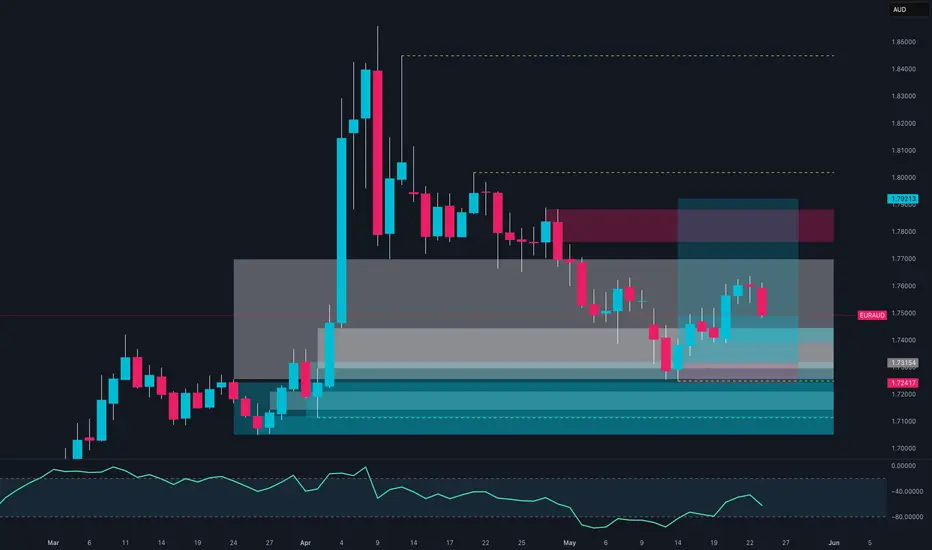
EURAUD – Bullish Breakout from Inverse Head & Shoulders + Target🔍 Pattern Insight: Inverse Head & Shoulders – A Powerful Reversal Formation
On the weekly timeframe, EURAUD has completed and broken out of a textbook Inverse Head & Shoulders (IHS) pattern — a highly regarded bullish reversal setup that often signals the end of a downtrend and the beginning of a sustainable uptrend.
Let’s break it down:
Left Shoulder: Formed in mid-2021 after a strong downtrend, price found support and rebounded, forming the initial shoulder low.
Head: A lower low was established around early 2022, marking the deepest point of the pattern. This represents the last dominant push by sellers before exhaustion.
Right Shoulder: In late 2022 to early 2023, bulls stepped in earlier than before, establishing a higher low — a strong sign of decreasing bearish momentum and accumulation.
Neckline : A descending resistance trendline connecting the peaks between the shoulders and the head. Once broken, it confirms the IHS breakout and trend reversal.
This multi-year formation reflects a major psychological shift: sellers lost control at the head, and buyers gradually regained dominance at the right shoulder, eventually breaking resistance.
📉 Retest in Progress – High Probability Entry Zone
Post-breakout, price action has pulled back for a technical retest of the neckline and curve line support — a dynamic trendline representing growing bullish momentum. This retest is essential for validating the breakout and building the base for a continuation rally.
The convergence of support zones (neckline + curve line) around the 1.70–1.72 area provides a strong confluence zone where buyers may step in again. This is often viewed as a second-chance entry for traders who missed the breakout.
🎯 Measured Target Projection & Resistance Levels
The IHS pattern gives us a clear measured move:
Measured Move Target: Distance from the head to neckline (~2,800+ pips) projected from the breakout point.
Target Zone: 1.92 – 1.95, just above the major resistance zone.
Resistance Zone: 1.85 – 1.87 is a historically significant supply area and may act as interim resistance.
Break and close above the resistance zone would further validate the bullish trajectory and open the door for higher targets.
📌 Risk Management – Defined Parameters
To manage risk effectively, consider:
Stop Loss: Below the recent retest low and curve line support, ideally placed at 1.63848, protecting against a false breakout.
Entry Idea: If bullish confirmation (e.g., bullish engulfing candle, higher low on lower timeframe) appears at retest zone, initiate a long position.
Risk-to-Reward (RR): Targeting 1.92 from an entry around 1.72 offers a 4:1 RR or better — highly attractive for swing and position traders.
🧠 Psychological and Structural Significance
This pattern is not just technical — it represents behavioral change in the market:
The head shows capitulation — a final wave of bearish pressure.
The right shoulder indicates growing confidence in bulls and waning selling interest.
The neckline breakout is where sentiment flips — traders recognize the change and enter long positions, fueling the breakout.
The current retest phase is crucial. Many professional traders wait for this moment to confirm that support holds before fully committing.
🔎 Final Thoughts & Strategy
Trend has shifted bullish on the weekly chart after years of consolidation and decline.
We’re seeing a classic breakout–retest–continuation setup.
A breakout above 1.85 would likely trigger momentum traders and institutions, driving price swiftly toward the 1.92–1.95 range.
Invalidation: Break below 1.63848 would invalidate the pattern and shift sentiment back to neutral or bearish.
📈 Trade Plan Summary:
Pattern: Inverse Head & Shoulders (weekly)
Bias: Bullish
Entry Zone: 1.70 – 1.73 (retest area)
Target: 1.92+
Stop Loss: Below 1.63848
Risk Level: Medium (weekly setup, but long-term play)

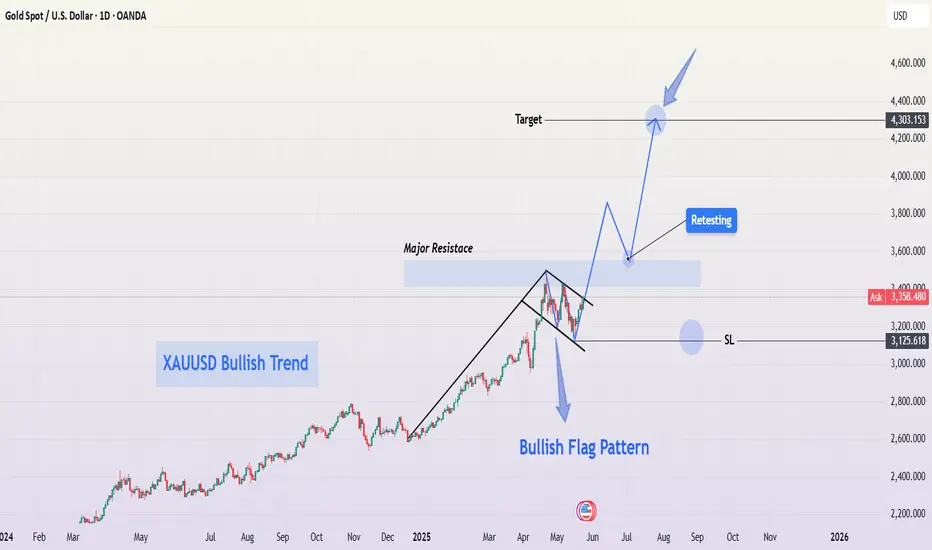
XAUUSD Bullish Flag Breakout – $4,300 Target in SightGold (XAU/USD) continues its strong bullish momentum in 2025, and the current price structure reveals a classic bullish flag pattern on the daily chart, suggesting further upside. This setup presents a potential continuation of the prevailing uptrend, possibly leading to new all-time highs in the coming months.
🟢 1. Clear Bullish Trend Foundation
Gold has been in a strong uptrend since late 2024, supported by:
Global inflationary pressures.
Geopolitical instability.
Central bank gold purchases and dollar weakness.
This uptrend is visually supported by a well-defined rising structure, with higher highs and higher lows.
📐 2. Bullish Flag Pattern Formation
The current price action has formed a bullish flag, a bullish continuation pattern that appears after a sharp rally. The flag represents a period of consolidation or pullback before the next impulsive move up.
The flagpole is the sharp rally that took place from mid-February to April 2025.
The flag itself is a downward-sloping channel or wedge, indicating temporary profit-taking or market indecision.
Volume typically decreases during the flag formation, then surges on breakout—confirming trend continuation.
This pattern is now showing signs of a breakout to the upside, suggesting the bulls are regaining control.
🔍 3. Key Technical Levels
🔹 Major Resistance Zone (~3,500–3,600):
This zone has acted as a supply region in the past.
Price is now testing this level and attempting a breakout.
A successful retest of this zone as new support will confirm the breakout.
🎯 Projected Target: $4,300+
Measured move target based on the flagpole’s height.
Clean projection points to the 4,300–4,350 area as the next major upside objective.
🛑 Support & Stop-Loss :
Strong support exists around $3,125, aligning with the flag base.
This area is a logical stop-loss zone for traders entering on the breakout.
🔁 4. Expected Price Behavior
Breakout: Price is expected to break above the flag resistance and the horizontal supply zone.
Retest Phase: A pullback toward the breakout zone (~3,600) could occur before the next impulsive move. This would offer a prime buy-on-dip opportunity.
Final Impulse: A sharp rally could follow, targeting the 4,300+ region.
💡 5. Trading Psychology Behind the Setup
During the flag formation, short-term traders take profit, and new buyers hesitate due to perceived overbought conditions.
However, the overall market sentiment remains bullish, with larger players accumulating during dips.
Once the resistance breaks, fear of missing out (FOMO) often drives prices sharply higher.
⚠️ 6. Risk Factors to Watch
Sudden USD strength or rising real yields.
Geopolitical de-escalation that reduces safe-haven demand.
FOMC rate surprises or unexpected hawkish policy shifts.
✅ Conclusion: Bullish Breakout Setup in Play
Gold is poised for another leg up after completing a textbook bullish flag pattern. With macroeconomic tailwinds and a solid technical base, this setup offers a high-probability long opportunity targeting the $4,300 zone. Watch for a confirmed breakout and possible retest to load long positions with solid risk-reward.
EUR/JPY Technical Breakdown: Rising Wedge Breakdown + Target🔺 1. Rising Wedge Pattern Explained
A Rising Wedge is formed when:
Price action creates higher highs and higher lows, but
The slope of the support line is steeper than the resistance line.
This signals that buyers are losing strength, and momentum is fading.
In this chart:
The wedge began forming around mid-February 2025.
Price was compressing within converging trendlines.
After multiple failed breakouts near resistance (~165.50), the pair finally broke below the lower trendline, confirming a bearish breakout.
This pattern is considered reliable because it traps late buyers and shifts sentiment from bullish to bearish quickly once the lower boundary is breached.
🔻 2. Key Technical Zones
📌 Major Resistance Zone (~165.00 – 166.00)
Strong supply area; price has rejected here multiple times since late 2023.
Resistance was confirmed again during the wedge formation.
High volume spike noted near this level, followed by a steep drop—evidence of distribution and smart money exiting long positions.
📌 Major Support Zone (~156.00 – 157.00)
Historically held as a demand zone.
Previous bounces suggest it is structurally significant.
However, repeated tests can weaken the zone, increasing the likelihood of a breakdown.
🎯 Target Price: 153.433
Measured by taking the height of the wedge and projecting it from the breakout point.
Coincides with a previously tested level (support turned target).
Bears could aim for this level as a swing target.
📉 3. Market Psychology Behind the Pattern
As price climbs inside a rising wedge, volume often declines, showing buyer exhaustion.
False breakouts near the top of the wedge trap breakout traders, adding fuel to the downside move once price breaks the lower boundary.
The sharp selloff post-breakout is often driven by stop-loss cascades and aggressive short positioning.
🔁 4. Potential Price Path & Trade Plan
Retest in Progress: Price may retest the broken wedge support (now resistance) near 163.00–164.00 before further decline. This retest zone offers a high-probability short entry opportunity with tight risk management.
Immediate Downside Levels: 160.00 (psychological level), 157.00 (support zone), and final target at 153.43.
Bearish Continuation Scenario: If the pair maintains below the wedge and forms lower highs, it confirms ongoing bearish sentiment.
🛑 5. Risk Factors to Monitor
ECB or BOJ monetary policy shifts (rate cuts/hikes, yield curve control updates).
Risk-on vs risk-off flows, especially in times of geopolitical or macroeconomic shocks.
Intervention by the Bank of Japan to protect JPY from excessive weakening.
✅ Conclusion: A Tactical Short Opportunity
The EUR/JPY chart is setting up for a potential medium-term short swing trade following a confirmed rising wedge breakdown. With clear rejection from a long-standing resistance zone and fading bullish momentum, the technicals align for a move toward 153.43 over the coming weeks.
Traders should watch for clean retests and structure-based entries, managing risk around 164.50 with profit-taking at key support zones along the path.

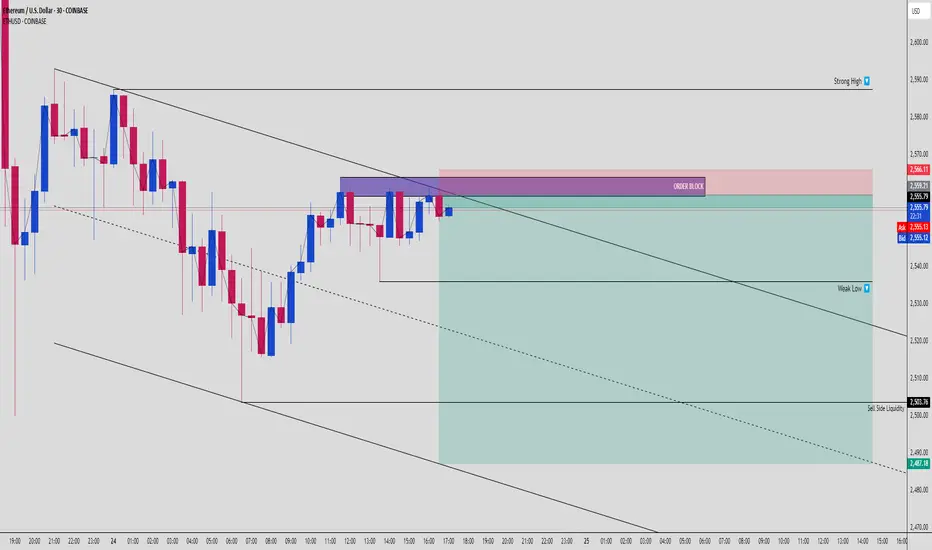
ETHUSD Bearish Trap Unfolding: FVG Fill Targets Sell-Side Liq!🚨 ETHUSD – Smart Money Bearish Setup (30-Min Timeframe)
Ethereum just gave us a beautiful SMC reversal setup after a short-term range liquidity sweep. Let’s break this down so you don’t miss the next leg. 👇
🔍 1. Structural Liquidity Sweep
A clean grab above internal highs pushed price into a well-defined premium zone where both Order Block (OB) and Fair Value Gap (FVG) reside. It’s not a bullish breakout – it's a liquidity trap.
The strong high at ~$2,566 hasn’t been breached, meaning structure still leans bearish.
🟪 2. Order Block Reaction Zone
Price is tapping directly into a bearish Order Block zone (~$2,559–2,566), showing hesitation and rejection candles.
💥 OB rejection confirmed with wicks and short-body closes
🔻 Follow-through expected down to clean up inefficiencies below
This is where Smart Money quietly enters short – right before the crowd realizes it wasn’t a real breakout.
🟦 3. Fair Value Gap (FVG) Below Price
A large FVG zone (~$2,553–2,503) is waiting to be filled. This is textbook Smart Money behavior – price rallies into premium, rejects OB, and aggressively seeks to rebalance inefficiency below.
📉 4. Weak Low & Sell-Side Liquidity
Below $2,530 lies a Weak Low, likely to be swept as price seeks out Sell-Side Liquidity. Final target sits at ~$2,487, right before the broader demand re-enters.
This is a liquidity vacuum move:
Price is engineered to sweep internal liquidity → break structure → mitigate deeper imbalance.
🎯 5. Trade Setup Breakdown
📍 Short Entry Zone: $2,555–2,566 (OB + trendline + FVG rejection)
🔐 Stop Loss: Above $2,570 (structure break level)
🎯 Take Profit Zones:
TP1: $2,530 (Weak Low sweep)
TP2: $2,503 (FVG base)
TP3: $2,487 (Sell-Side Liquidity)
⚖️ Risk:Reward Ratio – 1:3 or better
💡 Bonus: Add trailing stop after TP1 for locked-in gains
🧠 Market Psychology Lesson:
Retail sees a breakout of range = FOMO buys
Smart Money sees trapped longs = entry fuel for bearish move
Weak lows = targets
Your job = be the hunter, not the hunted. 🎯
✅ Summary:
ETHUSD is setting up for a classic bearish SMC reversal. Price tapped the OB, respected structure, and is showing a roadmap toward Sell-Side Liquidity below $2,500.
Don’t fade the confluence:
Premium OB + FVG
Rejection wick confirmations
Weak low + clean internal liquidity targets
⚠️ Keep emotions out, follow the setup, manage risk like a sniper.
💬 Type “ETH ON LOCK” if you’re tracking this beast with precision. Tag your trading squad!
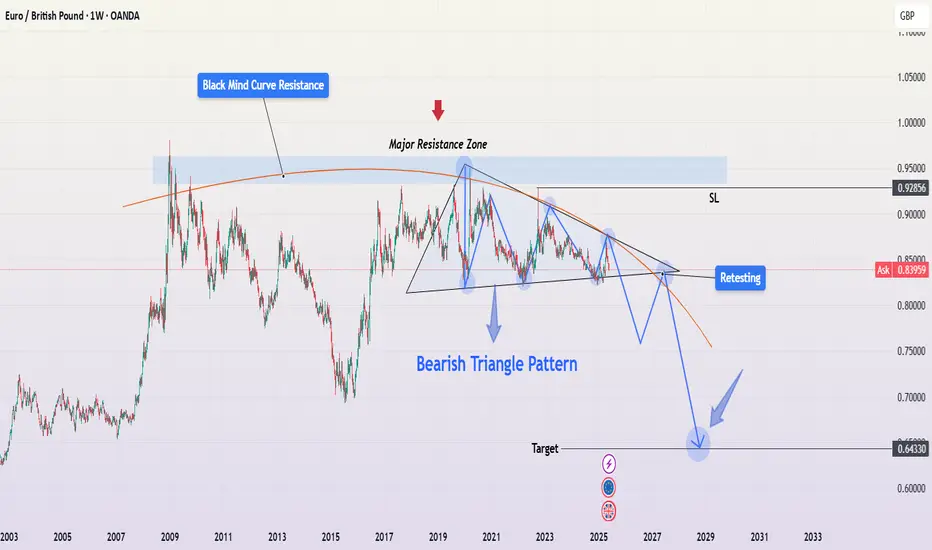
EUR/GBP – Bearish Triangle Breakdown in Play (Long-Term Setup)This EUR/GBP weekly chart is flashing a long-term bearish triangle pattern that has finally broken down, signaling potential for a major move to the downside. This setup is packed with high-confluence signals that traders should not ignore.
🔍 Pattern Breakdown:
📐 Bearish Triangle Pattern
The pair has been forming lower highs while maintaining a relatively flat support base, forming a descending triangle, a classically bearish continuation pattern.
The pressure has been building for over 6 years, with buyers failing to make new highs while sellers stepped in aggressively at lower levels.
The triangle support has now been broken, and price is entering a retest phase, which is critical for confirming the breakdown.
🟧 Black Mind Curve Resistance
A unique visual tool here is the Black Mind Curve — a curved trendline that mirrors the psychology of long-term resistance.
This curve has consistently capped price action since the 2009 peak, reinforcing the dominance of sellers in this zone.
Every time price reached this curve, it reversed — confirming it as a dynamic resistance.
🧱 Major Horizontal Resistance Zone
The shaded blue zone around 0.92–0.93 represents a long-term resistance area, which has repeatedly rejected price for over a decade.
This zone also aligns with the Black Mind Curve, adding to the confluence.
The most recent swing high failed to break this area, and the pair rolled over again.
🔄 Retesting in Progress
After the recent breakdown of triangle support, price is currently retesting the underside of the broken support line (now acting as resistance).
This is a textbook setup: break → retest → continuation.
If this retest fails (which is likely based on history), the bearish move should resume.
🎯 Bearish Target Projection
The projected move from the triangle breakdown points to the 0.64330 area, which aligns with a major support level from early 2007 and 2008.
This level is a high-probability magnet if the pattern plays out in full — giving a long-term swing trade or position-trading opportunity.
🧠 Why This Matters (Pro Insights)
This chart is powerful because:
It’s on the weekly timeframe – high conviction and larger moves.
It shows a long-term squeeze finally breaking.
Resistance is reinforced by multiple layers (curve + horizontal zone).
Retest confirms possible continuation sell setup.
This isn’t a short-term scalp — it’s a position trade idea that could develop over months or even a couple years, with a massive risk-reward potential.
⚠️ Trade Plan Summary
Bias: Bearish
Pattern: Descending Triangle (broken)
Current Action: Retesting broken support
Entry Zone: On bearish rejection near 0.8400–0.8450
Stop Loss: Above resistance zone (around 0.9285)
Target: 0.64330
Risk/Reward: Potentially >4:1 on a swing basis
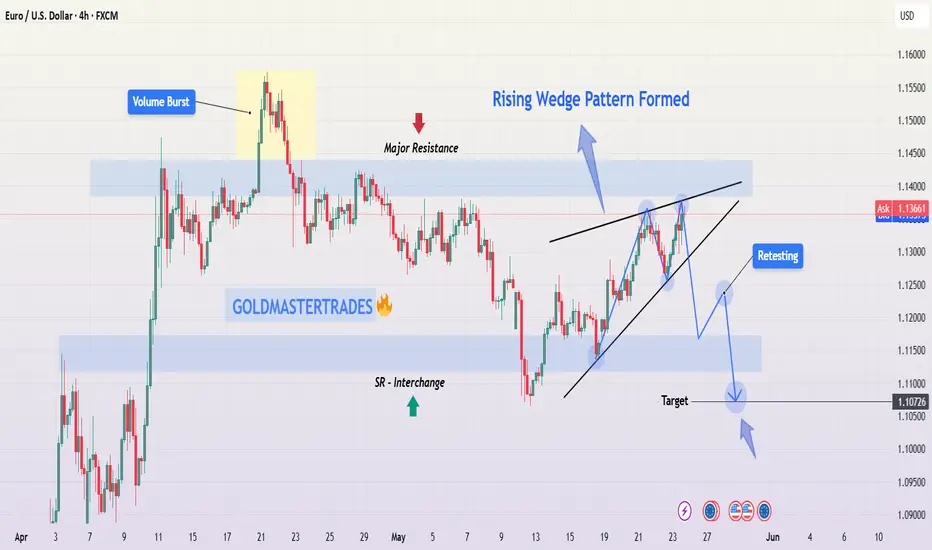
EUR/USD Rising Wedge Breakdown – Bearish Opportunity in Sight🔍 Technical Breakdown
🟦 1. Rising Wedge Pattern (Bearish)
The price has been moving within a tightening upward channel — forming higher highs and higher lows, but with decreasing momentum. This is a typical Rising Wedge, a pattern that signals exhaustion in an uptrend and typically resolves to the downside.
The pattern formed over several days.
Volume has been declining as the price pushed higher — a classic sign of weakening trend strength.
🚨 2. Major Resistance Zone
The wedge culminated near a major historical resistance zone (around 1.1400), which price failed to break multiple times — showing strong seller presence. This adds confluence to the bearish breakdown.
📉 3. Breakdown & Retest
Price broke below the lower wedge trendline, confirming the bearish reversal. After the breakdown, the pair appears to be retesting the previous support line — now acting as new resistance.
This retest is crucial — a successful rejection here typically confirms the breakdown and provides an ideal entry point for short positions.
⚡ Volume Clues
Note the "Volume Burst" earlier in the chart, followed by a sharp move up. But that rally was unsustainable — buyers couldn’t hold above resistance, and volume has since faded. This volume exhaustion is further evidence that bullish momentum is weakening.
🔄 Key Support Zones Below
Around 1.1200: A strong SR flip zone (support-turned-resistance), which could act as temporary support.
Final Bearish Target: Around 1.1070, a strong demand zone where price previously consolidated before the last bullish run.
This is the measured move target from the wedge height applied to the breakdown point.
🧠 Why This Matters (Trader Insight)
This setup combines:
A reliable bearish pattern (rising wedge)
Key horizontal resistance
A volume drop
A clean retest structure
That makes it a high-confluence short trade idea. These patterns don't always play out immediately, but when they do, they often drop hard.
📌 Trade Setup Summary
Bias: Bearish
Pattern : Rising Wedge (broken)
Current Action: Retesting the broken wedge
Entry Zone: 1.135–1.138 (retest confirmation)
First Target: 1.1200 (SR Flip)
Final Target: 1.1070 (Demand Zone)
Invalidation: Break and hold above 1.1410
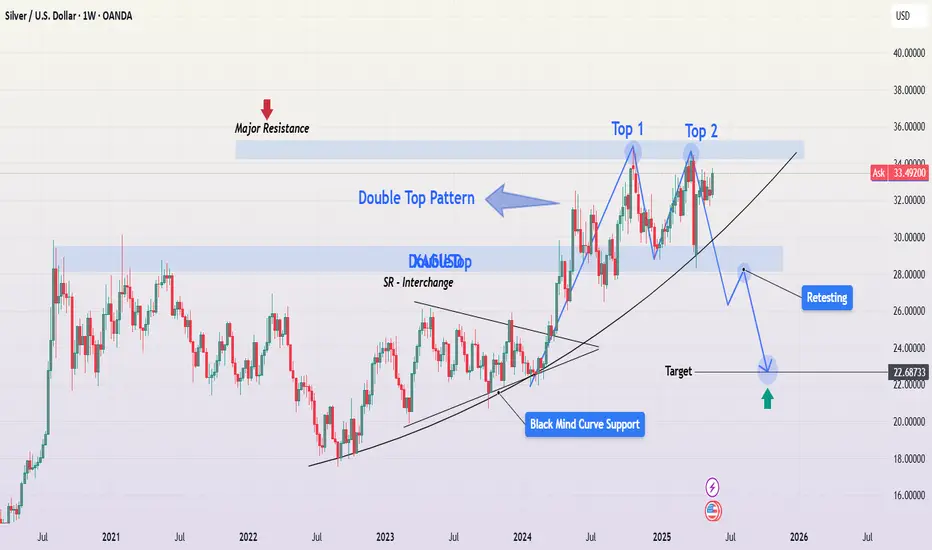
Silver Double Top at Major Resistance – Bearish Breakdown📌 Overview:
This chart shows a classic Double Top Pattern forming on the weekly timeframe for Silver (XAG/USD). Price has reached a multi-year resistance zone and failed to break above it twice, signaling potential exhaustion of bullish momentum and the possibility of a larger trend reversal.
🧩 Detailed Pattern Breakdown:
🔹 1. Double Top Pattern
The double top is one of the most reliable bearish reversal patterns, formed when the market tests a resistance level twice and fails to break it, creating two rounded or sharp peaks. In this case:
Top 1 and Top 2 occurred near the $35–36 zone, clearly marked as a major resistance level.
This indicates strong selling pressure from that zone.
🔹 2. Major Resistance Zone
The $35–36 price range has historically acted as a ceiling for Silver prices. It rejected price several times between 2021 and 2025. When this kind of level holds, it often precedes sharp corrections, especially when volume begins to drop and momentum weakens.
🔹 3. Rising Trendline Break
After forming the double top, price broke down through a key ascending trendline, a sign that the bulls are losing control. The breakdown is further confirmed by a strong bearish candle, closing below both the trendline and a critical SR (Support-Resistance) Interchange zone.
🔹 4. Retesting in Progress
Post-breakdown, the price action is now retesting the broken trendline and horizontal zone (~$28). This is a crucial moment:
If Silver gets rejected here, it confirms the bearish breakout and signals entry for sellers.
If it reclaims this level, the bearish setup could fail, and price might consolidate or resume uptrend.
🔹 5. SR - Interchange Zone
This zone is marked because it acted as resistance during the 2022-2023 period, and then flipped into support in 2024. Currently, it’s being tested from below, making it an SR flip retest. These zones often become inflection points.
🔹 6. Black Mind Curve Support
An important and unique addition is the “Black Mind Curve Support” – a curved dynamic trendline that has historically aligned with price retracements. The projected path shows that the curve and horizontal support (~$22.68) intersect, strengthening the significance of that level.
🔹 7. Measured Move & Target
Based on the height of the Double Top pattern (approx. $10 range from top to neckline), the measured move places the target near $22.68, which matches both:
Historical demand zone
Curve support
This alignment makes $22.68 a realistic and strong downside target.
🧭 Strategic Summary:
Pattern Type: Double Top (Bearish Reversal)
Key Resistance: $35–36 (Multi-year rejection level)
Trendline: Broken (Bearish confirmation)
Retesting Area: $28–29 zone (Watch for rejection)
Downside Target: $22.68 (Confluence of support zones)
Invalidation: Clean weekly close above $35
🔍 What Traders Should Watch:
✅ Bearish Candlestick Confirmation at the retest zone (e.g. bearish engulfing, shooting star).
✅ Increased volume on drop, confirming participation by larger players.
🚫 Invalidation signal would be a sustained move and close back above the resistance zone.
⚖️ Risk Management Tip:
This pattern offers a high risk-to-reward ratio trade setup. Short entries on the retest with stop loss above $36 can provide substantial downside potential toward $22–23, especially in a commodity market prone to sharp retracements.
📌 Final Thoughts:
Silver appears to be forming a clean double top reversal at a long-term resistance. If the current retest fails, a significant correction may follow, targeting the $22.68 level. This pattern, combined with key support-resistance dynamics and psychological zones, makes this setup worth monitoring for medium- to long-term traders.
EURAUD Ready to Launch? Institutions Positioning for a Big Move!🔍 1. COT REPORT (Commitment of Traders)
EUR:
Net Positioning (Non-Commercial): +75,253 → Bullish, but slightly reduced this week (-3,587 longs, +6,814 shorts).
Commercials: Heavily short (550,286 vs 423,456 longs) → Hedging against potential EUR strength.
Open interest change: +8,343 contracts → Higher market participation, active environment.
AUD:
Net Positioning (Non-Commercial): -59,077 → Strong bearish sentiment on AUD.
Commercials: Net long (121,279 vs 61,743 shorts) → Fundamental support for AUD at potential value areas.
Open interest down (-2,607) → Possible position unwinding or rollover.
📊 COT Conclusion: Speculators favor EUR long / AUD short, but commercials are positioned inversely, suggesting a potential reversal point.
📈 2. SEASONALITY
EUR in May:
Generally negative, with average monthly performance over 10y, 15y, and 20y ranging between -0.01% and -0.02%.
Only the 2y curve shows strength (≈+0.0194).
AUD in May:
Mixed performance: 10y and 5y negative, but 2y slightly positive (+0.0083) → sign of recent improvement.
📊 Seasonality Conclusion: Slight edge for AUD thanks to near-term seasonal resilience.
💡 3. SENTIMENT
Retail traders: 84% short on EURAUD.
Average short entry: 1.7002, current price ≈ 1.7491 → many are in drawdown.
High short congestion above 1.74 → Potential short squeeze setup.
📊 Sentiment Conclusion: Environment favors a bullish push to trigger stops and unwind retail shorts.
🧠 4. PRICE ACTION
Price reacted to a major demand zone at 1.7200–1.7350.
Last two weekly candles show compression and accumulation following strong bearish momentum.
Clear liquidity pocket above 1.76–1.77, targeting the 1.79–1.80 zone.
RSI showing recovery from oversold conditions.
📊 Technical Conclusion: Structure suggests rebound or reversal, aligned with sentiment and positioning dynamics.
🔚 STRATEGIC OUTLOOK
Primary Bias: LONG EURAUD (multi-day / swing setup)
🎯 Target: 1.7700 – 1.7920
🛡️ Stop: Below 1.7310 (weekly close under demand zone)
⚠️ Alternative (Scenario B): A clear weekly close below 1.7300 may reactivate the bearish trend toward 1.7200.
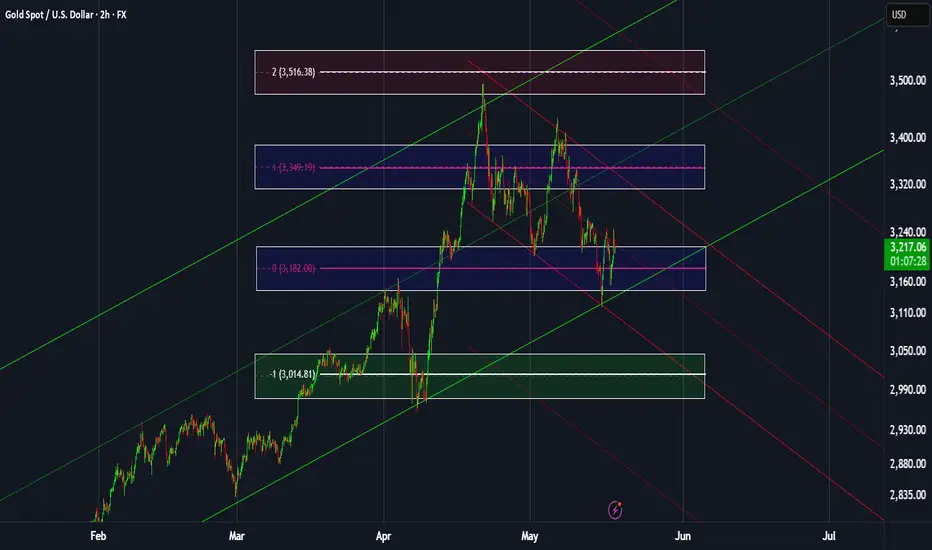
Gold: Weekly overviewHello Traders,
Political condition could cause unstable movements in the market.
The indicated levels are determined based on the most reaction points and the assumption of approximately equal distance between the zones.
These points can also be confirmed by the mathematical intervals of Murray.
After reacting to the following zones, you can enter the trade. Place the stop loss slightly above/below the zone to which the reaction was shown. The profit point is the next zone.
The drawn channels and their medians can also be considered as moving support and resistance. I usually use them as target points.
* A break is confirmed, only if price does not have any moving S&R on it's way.
This analysis is valid until the end of the week.
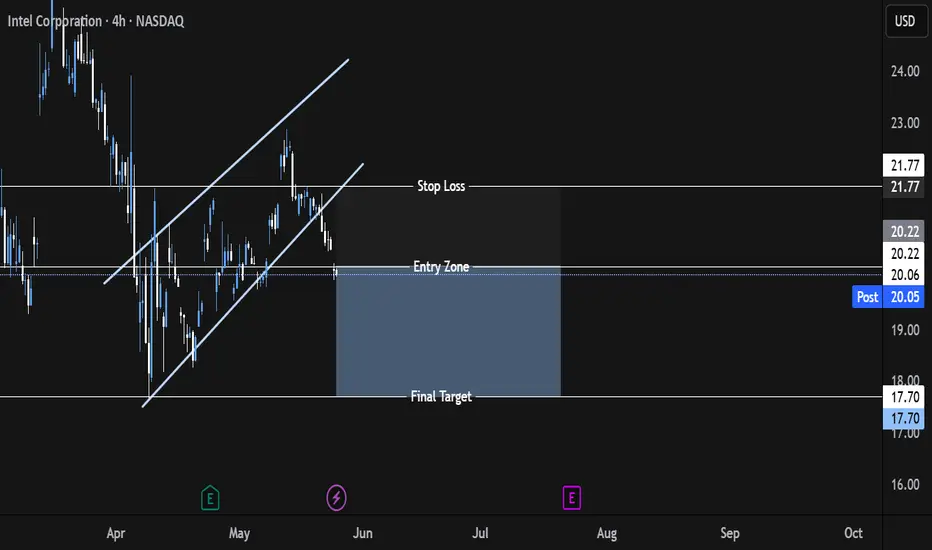
Intel Breakdown Alert! Bearish Setup with High R:R Opportunity !📉 Intel Corporation (INTC) – Bearish Setup Analysis
Timeframe: 4H | Ticker: NASDAQ:INTC | Exchange: NASDAQ
🔍 Technical Breakdown
We are currently observing a potential bearish reversal on Intel Corp. following a clear breakdown from a rising parallel channel on the 4H chart.
🟦 Pattern Observed
Price was previously moving within a rising channel, forming higher highs and higher lows – a typical short-term bullish structure.
Recently, price broke down below the lower boundary of this channel, signaling a potential shift in momentum from bullish to bearish.
📌 Trade Setup
Entry Zone: Between $20.22 – $20.06
Price is currently trading in this zone, presenting a potential short entry opportunity following the channel breakdown.
Stop Loss: $21.77
Placed above the previous resistance zone and the broken channel. If the price reclaims this level, the bearish thesis is invalidated.
Final Target: $17.70
This level represents a key support zone from previous price action and aligns with potential measured move from the channel breakdown.
✅ Why This Setup?
Channel Breakdown
A break below a well-defined channel often marks a change in trend. This gives a high-probability setup for trend reversal traders.
Bearish Momentum Confirmation
After the breakdown, price failed to reclaim the channel, and is now trading below the prior support, flipping it into resistance.
Risk/Reward Ratio
This setup offers an excellent R:R ratio, with downside potential toward $17.70 and a relatively tight stop just above the failed structure.
Market Structure Alignment
Lower highs and lower lows now appear to be forming post-breakdown, further confirming a potential bearish move ahead.
📉 Bias: Short
📈 Invalidation: Break and close above $21.77
🎯 Target: $17.70
🧠 Disclaimer: This is not financial advice. Always do your own research and manage your risk accordingly. Trade safe!
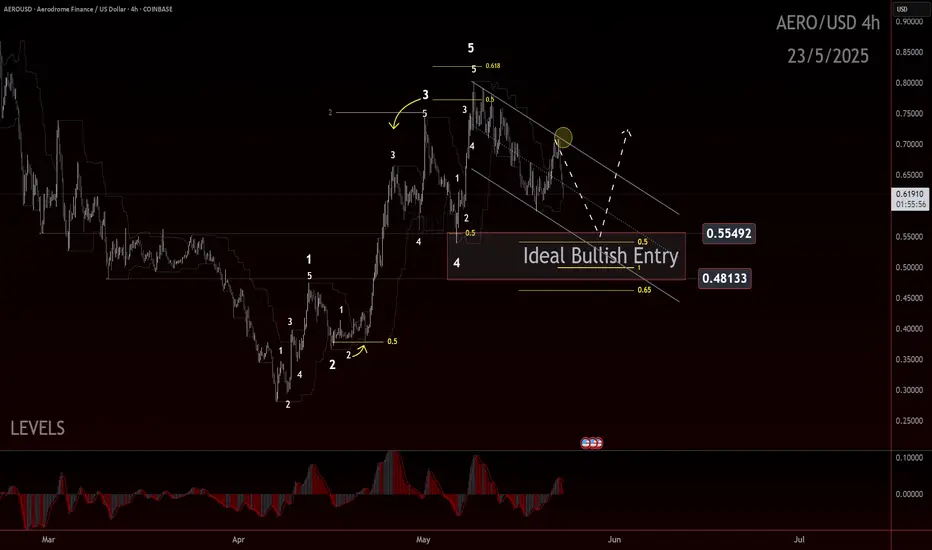
AERO: Coming in to Refuel… or Crash Land!? AERO: Coming in to Refuel… or Crash Land!?
📅 Date: May 23, 2025
🧠 Framework: Elliott Wave with Fibonacci structure
🔍 Context: 4H timeframe
🔁 Recap of the Move
AERO rallied off the 0.3465–0.3475 double bottom in what appears to be a clean 5-wave impulsive sequence. The price action respected both structural and Fibonacci guidelines:
Wave 2 and Wave 4 both pulled back to 0.5 retracements.
Wave 3 extended and subdivided with strong momentum, a common characteristic
Wave 5 completed between 0.5 and 0.618 of Wave 3 from the Wave 4 low — a textbook termination zone
Subdivisions within Wave 5 were also visible, including a smaller internal Wave 3 and 5, reinforcing the case for a completed motive wave.
⚠️ Current Price Behavior
Post-impulse, the market is showing signs of correction. This pullback could mark the beginning of a deeper retracement, or it may be the early stages of a new larger-degree impulse if the uptrend continues.
📏 Levels to Watch
Retracement zone: 0.54–0.49 (50–61.8% of the full move)
Upside resumption: Requires a strong bounce from the retrace zone and break of the Wave 5 high
🔮 Outlook
Two scenarios remain on the table:
Bullish: This is a Wave 2 retracement in a larger degree move. If support holds, a strong Wave 3 may follow.
Bearish/Neutral: The 5-wave or 3-wave structure is fully complete, and a deeper correction could be in play.
Confirmation will come through structure, not assumption. Keep watching how price behaves around the key retrace levels.
📣 Trade safe, trade clarity. More updates coming as structure evolves.
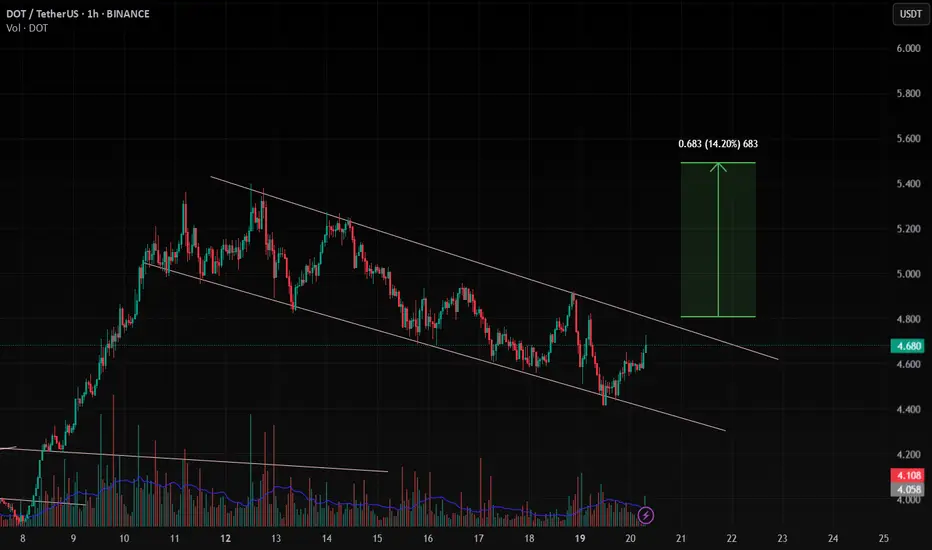
DOTUSDT , 1HrPattern is looking Good , If BTC is Sustaining Above 1,06,834 this level then , This DOT pattern will Give a Good Breakout ,
Enter only When Upper Trendline is Breakout
Take Your Own Risk According to your Capital .
Follow for More Ideas Like This
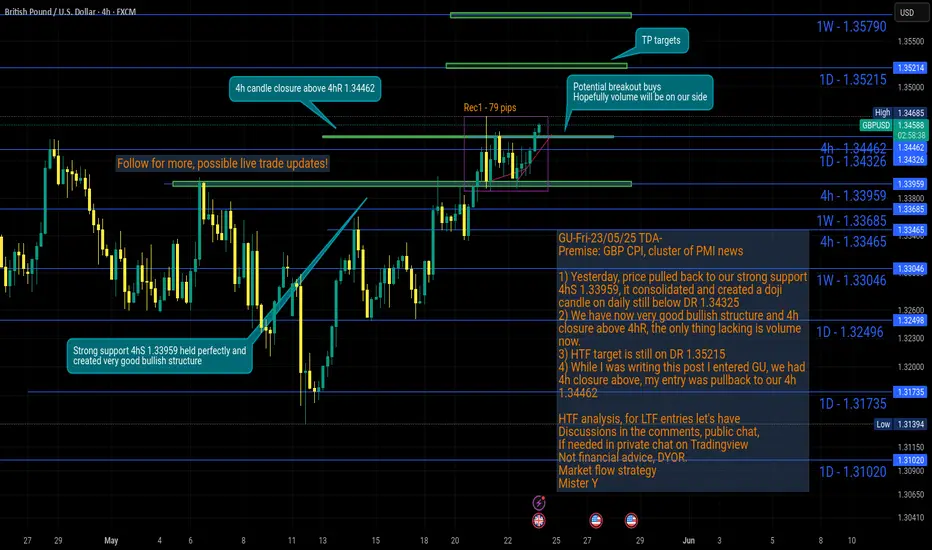
GU-Fri-23/05/25 TDA-Bullish closures, Breakout buy is on!Analysis done directly on the chart
Follow for more, possible live updates!
Plan, wait, execute.
It's easy to write, but difficult to do.
It requires surely experience, just put in
the work, track your progress and don't
give up.
Not financial advice, DYOR.
Market Flow Strategy
Mister Y
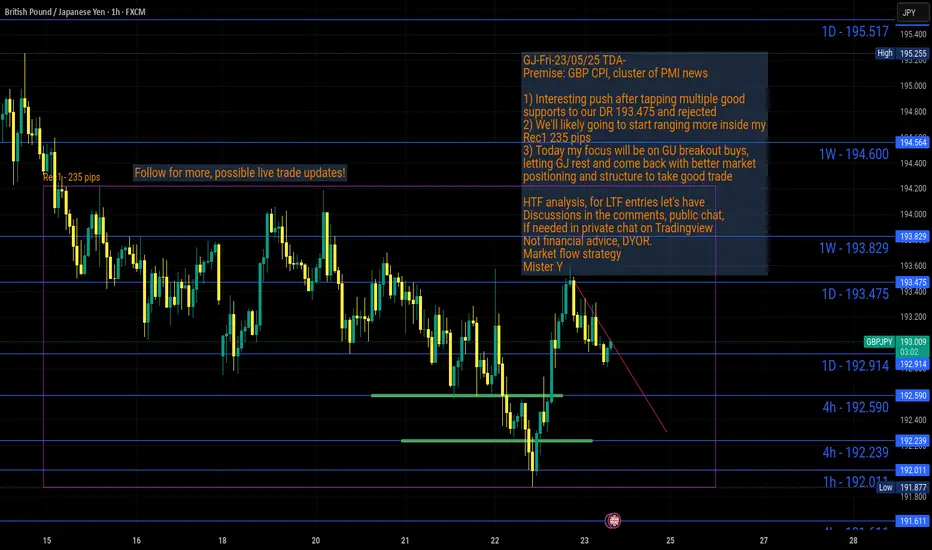
GJ-Fri-23/05/25 TDA-Wide consolidation incoming?Analysis done directly on the chart
Follow for more, possible live updates!
Not everyday is a good trading day,
you are not forced to take trades every
single day. More trades is not equal
to better results.
Not financial advice, DYOR.
Market Flow Strategy
Mister Y
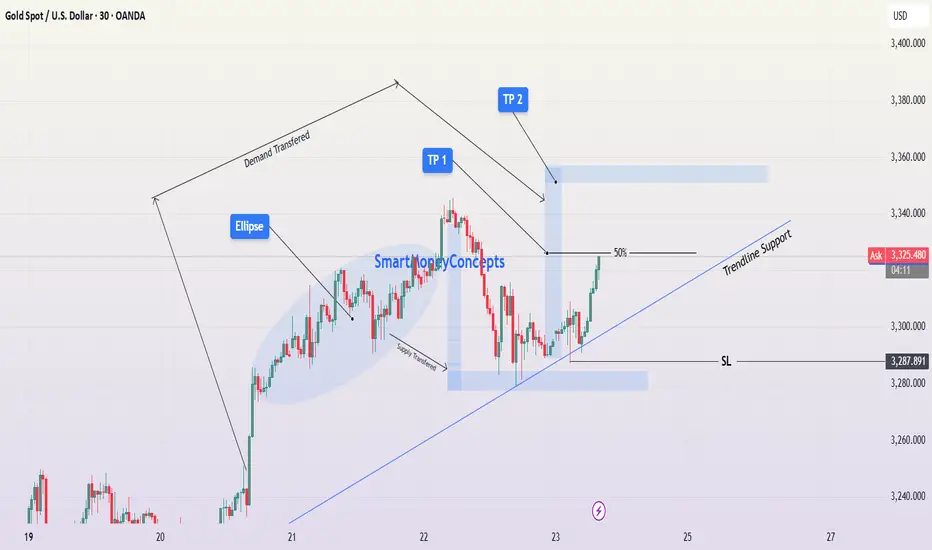
Gold (XAUUSD) Long Setup – Targeting Fresh Highs Bullish Move📊 Chart Breakdown & Market Context:
This 30-minute chart of Gold Spot (XAU/USD) shows a strong bullish price structure that is currently forming higher lows while respecting dynamic trendline support. The chart illustrates demand and supply transfers, which are pivotal concepts in price action trading. Let’s explore the technical reasoning behind this trade setup:
🔄 1. Demand & Supply Shift Zones:
Demand Transferred: Initially, price consolidated within the blue elliptical region. This area saw aggressive bullish pressure that pushed price upward, confirming the presence of institutional demand. As the market progressed, this demand shifted higher — now located at the most recent zone where price bounced after a pullback.
Supply Transferred : A major bearish reaction zone was taken out after the market absorbed selling pressure. This suggests that sellers are no longer in control and demand is rebalancing in favor of buyers.
📈 2. Bullish Structure Confirmation:
After the pullback on May 22, price formed a higher low, perfectly aligned with both the new demand zone and the ascending trendline support. This confirms that buyers are defending this area.
The price is currently pushing upward from this demand, signaling a potential bullish continuation.
The 50% equilibrium level of the recent bearish leg is being tested. A clean break and close above this level would confirm buyers’ dominance and could invite momentum trading interest.
🔵 3. Entry, Targets & Stop-Loss Plan:
✅ Entry:
Entry is ideal from the current price region near 3,313 (or on minor retracement, maintaining RR).
🎯 Take Profit Zones:
TP1 (~3,336): This is just above the 50% level and near the previous swing high. Partial take-profit here is wise in case price consolidates.
TP2 (~3,360): Located at the upper resistance zone, marking the potential target if bullish momentum continues.
❌ Stop-Loss:
SL: 3,287.891 — placed below the recent higher low and below the demand zone. This protects the trade from deeper pullbacks or breakdowns below structural support.
📉 4. Risk Management & Trade Psychology:
Maintain a Risk-Reward Ratio (RRR) of at least 1:2 to ensure profitable expectancy.
Avoid over-leveraging, as we are trading near a key resistance zone (50% area).
Watch for volume confirmation or strong bullish candles before fully committing to the trade.
Use a trailing stop once TP1 is hit to secure profits toward TP2.
⚠️ 5. Key Considerations Before Execution:
Monitor any macroeconomic events (e.g., Fed announcements, CPI/PPI, NFP) that may impact gold volatility.
Check DXY (Dollar Index) — if the dollar weakens, gold will likely strengthen further.
Volume behavior around the 50% zone will indicate breakout vs rejection.
🧠 Summary for Minds Section:
Gold shows a clear higher-low structure supported by trendline and demand transfer.
Buyers absorbed supply; now building momentum toward upper resistance zones.
Entry near 3,313, SL under 3,288, TP1 ~3,336, TP2 ~3,360.
Trend remains bullish unless trendline and demand zone are broken.
💡 Educational Takeaway: Watch for demand/supply shifts and trendline confirmations. This setup is a textbook example of structural continuation supported by market psychology and price action zones.
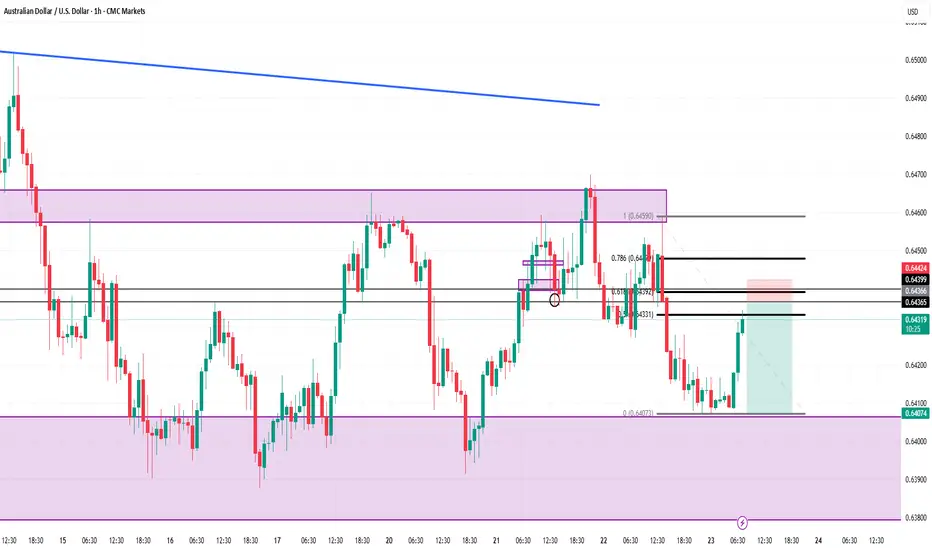
AUDUSDIn daily time frame its in down trend and in last swing it created strong demand zone so it will go to test it once just captureinig that move
in 1 hr its making Lower high and taking resistance at fib 0.6 level