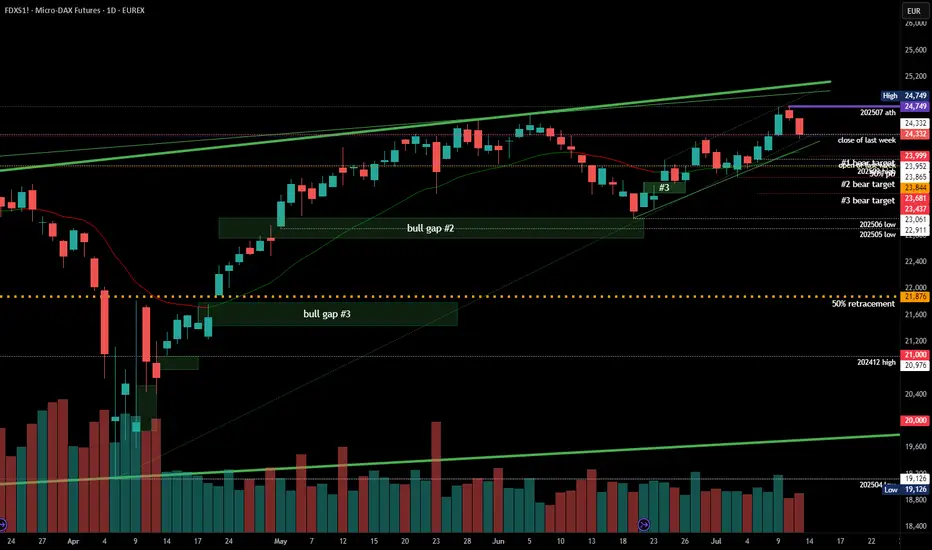
#202528 - priceactiontds - weekly update - daxGood Evening and I hope you are well.
comment: Third leg up is done and now it’s all about how long do we need for a lower low below 23680 again. For now I don’t know since we have another risk-off news but of them were bought the past 3 months, so I remain skeptical. Too early for shorts but I think longs near 24000 are likely good for a bounce to either retest 24749 or print a lower high.
current market cycle: bull wedge
key levels for next week: 23000 - 24800
bull case: Bulls want to continue sideways to up and trap all eager bears again who think that 30% tariffs between the US-EU are bad. Those poor souls. Markets can only go up.
Invalidation is below 23680
bear case: Bears need a lower low below 23680. That’s all there is to it. No idea how fast and if we get there but shorts before are most likely a gamble, since literally every dip since April has been bought and especially every Sunday Globex gap down became a giant trap. I do think 24749 is a perfect double top with the prior ath from June and we can go down from here but until we have a daily close below 23680, I am not eager to run into another bear trap.
Invalidation is above 24749
short term: Neutral. Tariff news are bad but they are not in-effect, so could be that we see another bear trap. I don’t know and I won’t pretend otherwise. Sitting on hands.
medium-long term from 2025-06-29: Bull surprise last week but my targets for the second half of 2025 remain the same. I still expect at least 21000 to get hit again this year. As of now, bulls are favored until we drop below 23000.
Priceaction
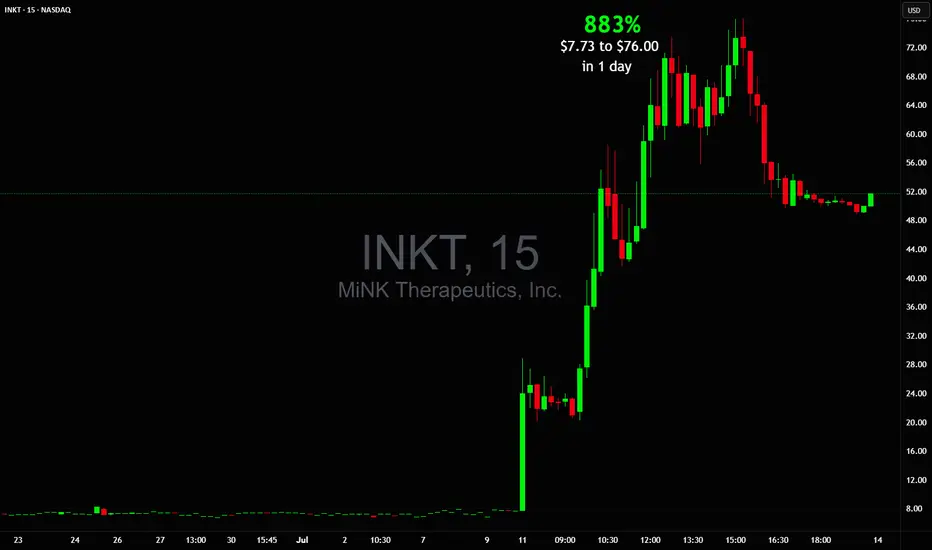
$7.73 to $76.00 in 1 day! Another 800% runner $INKTAGAIN? Another 800% runner in a day? 🚀 Such massive moves became a daily thing these days? 😲 NASDAQ:INKT
Can't wait to see new one in the morning!
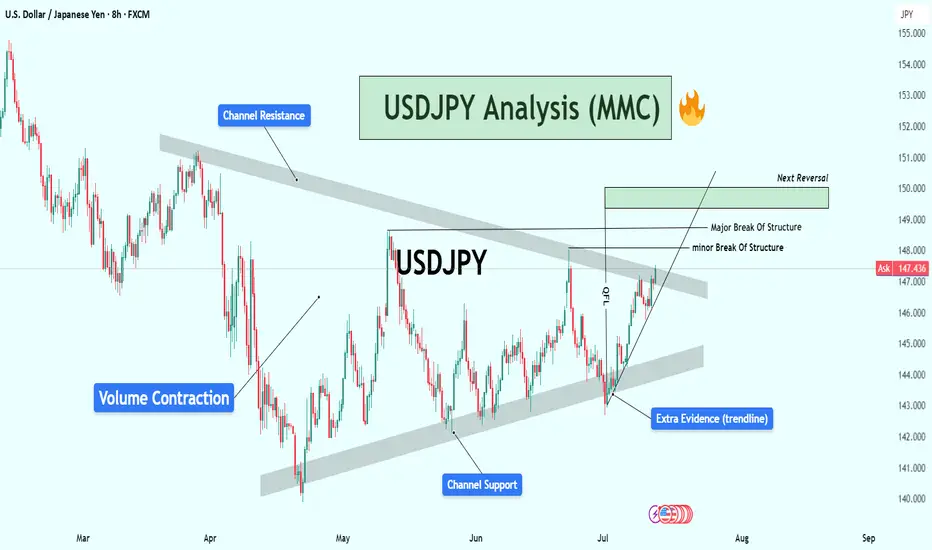
USDJPY Analysis : Major Move Loading Towards Target Zone🕵️♂️ Overview
The USDJPY pair is approaching a critical turning point within a well-established descending channel structure. After several months of corrective movement and internal structure shifts, the market is now displaying multiple layers of confluence pointing toward an impending major reaction or reversal. Let’s break down this chart step by step.
🧱 Market Structure Analysis
🔹 Descending Channel:
The entire chart is governed by a broad descending channel, with price making lower highs and lower lows since early March.
Each touch of the channel support has led to a bounce, and the price is now once again near channel resistance, creating a possible reaction zone.
🔹 Volume Contraction Phase:
In the mid-section of the chart, we observe volume contraction, indicating liquidity drying up and buyers/sellers entering a phase of uncertainty.
This contraction is typical in accumulation or re-accumulation phases, which often precede strong impulsive moves — exactly what followed here.
🧩 Structural Breaks and Trendline Clarity
🔸 Minor Break of Structure:
A recent high was taken out in early July, marking a minor break of structure (BOS), showing the first signs of bulls taking short-term control.
🔸 Major Break of Structure:
A more significant high (marked on the chart) has also been broken, confirming a major BOS — this implies institutional positioning or a shift in market sentiment.
🔸 Trendline Break – Extra Confirmation:
The bullish push came after breaking a clean internal trendline, which acted as diagonal resistance.
Once this trendline broke, price aggressively accelerated upward — this is a classic market maker cycle (MMC) Phase 2 (expansion) move.
📍 Confluence at Next Reversal Zone (149.00 – 150.00)
The green highlighted zone is the next potential area for bearish pressure to return, based on:
Key Supply Zone: Historical area where sellers previously dominated.
Channel Resistance Confluence: Top of the descending channel aligns with this zone.
Psychological Level: 150.00 is a major psychological round number — often attracts profit-taking and institutional activity.
Fibonacci (if plotted): Likely 78.6% – 88.6% retracement from last swing high.
Overextended Rally: Price has rallied strongly since early July with very little correction — it’s approaching exhaustion.
🔄 Market Maker Cycle (MMC) Alignment
This move perfectly reflects the Market Maker Cycle:
Accumulation: During volume contraction phase.
Manipulation: Fakeouts near channel support to trap shorts.
Expansion: Break of structure + trendline, aggressive rally.
Distribution (Next): Likely to occur at the 149–150 zone with a sharp rejection.
🧠 Trader’s Plan – What to Look For
📈 If Bullish:
Targets: 148.80 to 149.80 zone
Hold until rejection signs (bearish candles, volume spikes, divergences)
SL: Below recent swing low/trendline (~146.00)
📉 If Bearish (After Rejection):
Watch for:
Strong bearish engulfing candle or shooting star
RSI/MACD divergence (not shown but suggested)
Break of short-term ascending trendline
Targets: Back toward 145.50 or mid-channel (dynamic)
🔖 Summary
USDJPY is showing clear signs of bullish exhaustion near the upper channel resistance and major structure levels. If price respects this zone (149–150), expect a healthy corrective leg or full reversal. Multiple layers of technical evidence, including structure breaks, trendline breach, and MMC phases, are aligning for a high-probability play.
This is a textbook setup for experienced traders watching key zones with proper confirmations.
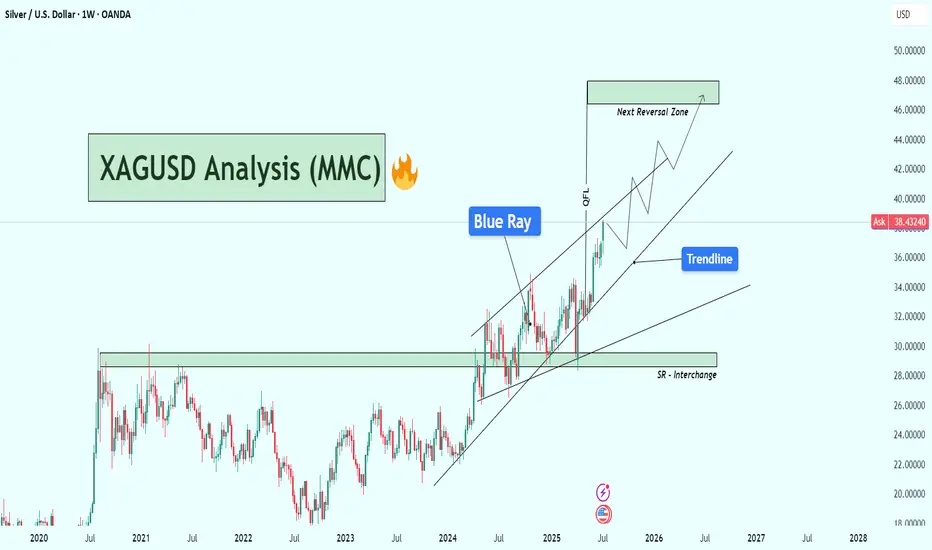
XAGUSD Weekly Analysis (MMC) : Bullish Channel Toward Target🧠 1. Trend Shift Confirmed – Silver in Full Bullish Momentum
Silver has officially broken free from its multi-year sideways range and has entered a well-defined ascending channel, pushing toward higher highs week after week. The momentum is strong and supported by a combination of technical elements, structure shifts, and clean retests.
The trend is now clear: bullish, with the price aiming for the Next Reversal Zone between $46 and $48 — a level not seen since mid-2020.
🔷 2. Blue Ray Break – Start of the Rally
The breakout began with a clean move above the Blue Ray trendline, a key structure that had suppressed Silver’s growth for several years.
As the chart notes:
“Blue Ray Always Continue Trend” — until broken.
Once Silver broke above this resistance, it not only confirmed the trend reversal but also triggered the formation of a new bullish market structure, supported by aggressive buying.
🔁 3. SR – Interchange Zone Holding Strong
The SR Interchange zone (around $27 – $30) has played a critical role in this breakout. It acted as:
Resistance during the multi-year range.
Then Support after the breakout, confirming a classic Support-Resistance Flip (SRF).
This zone now serves as a solid demand base, giving the rally a stable foundation to push higher.
🪙 4. QFL Formation – Momentum Confirmation
The breakout also aligns with a QFL (Quick Flip Level) structure — a powerful bullish continuation pattern.
QFL setups form when price breaks above a former base, pulls back slightly, and then quickly resumes the upward trend.
This indicates that buyers are aggressive and unwilling to let price fall too far, fueling a rally.
Combined with the ascending channel, the QFL structure gives extra confidence that Silver is on track to reach the $46–$48 Reversal Zone.
📏 5. Trendline & Channel – Price Structure in Control
Silver is currently moving cleanly within an ascending parallel channel, respecting both upper resistance and lower support trendlines. The inner trendline has been tested multiple times, and price is now riding its upper half.
This shows:
Buyers are in control.
Each correction is shallow.
Market confidence is growing week after week.
Expect volatility to increase as Silver approaches the next target area.
🎯 6. Next Reversal Zone: $46 – $48
The green box at the top marks the Next Reversal Zone, where Silver might:
Stall temporarily and consolidate.
Or face a pullback back toward the mid-channel line or lower support.
This zone corresponds to:
Historical supply area (2020 highs)
Strong psychological resistance
Potential profit-taking by institutions or swing traders
🔭 Trade Scenarios to Watch
✅ Bullish Continuation:
If Silver maintains support above $36 and remains inside the ascending channel, we may see a smooth ride into the reversal zone. Look for:
Break-and-retest of the midline
Bullish candles with long wicks on dips
⚠️ Short-Term Rejection:
If price reaches $46–$48 and shows signs of exhaustion (like long upper wicks, evening star, or bearish engulfing), expect a healthy pullback toward $35–$36 or even $32.
As long as the ascending structure holds, bulls remain in control.
🧩 Key Technical Levels
Element Zone / Level Action
SR Interchange Support $27 – $30 Strong demand zone
Blue Ray Breakout Confirmed Trend reversal signal
QFL Zone Around $36 Retest and rally confirmation
Reversal Zone $46 – $48 High-probability reaction area
Trendline Support Dynamic ($35–$36) Bullish channel continuation
📌 Final Thoughts:
Silver is now playing in the big leagues again. With the Blue Ray broken, QFL confirmed, and price following a disciplined trendline channel, this rally looks both technically sound and fundamentally strong.
Watch the $46–$48 zone carefully. Whether price rejects or breaks through, there will be high-probability setups for both breakout traders and dip buyers.
Stay disciplined, don’t chase, and let price give you confirmation.
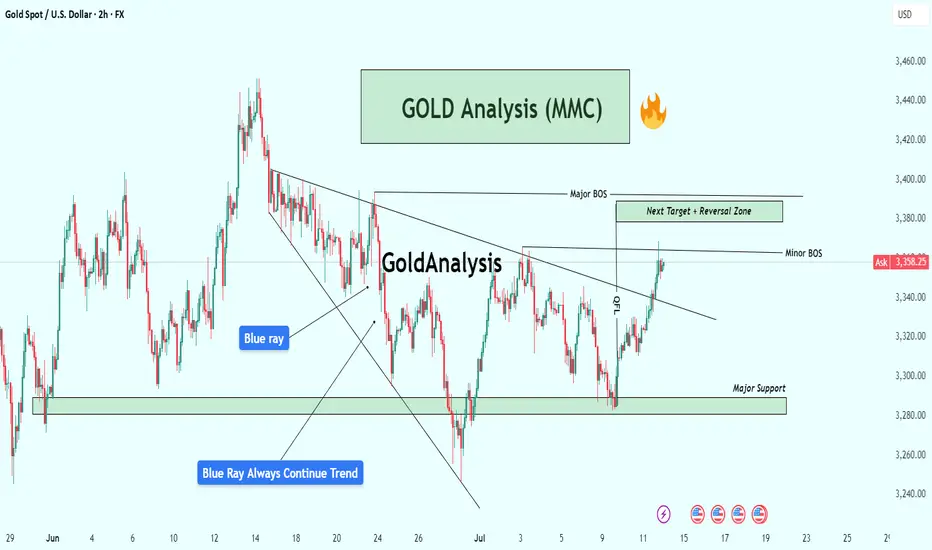
XAUUSD Analysis : Bullish Move Toward Key Resistance + Target🟩 Overview:
Gold is currently showing a clear bullish breakout on the 2-hour timeframe. The market structure has shifted from a downtrend into a bullish phase, with price now approaching a critical Reversal Zone. Let’s break down the key levels, structure shifts, and potential trade opportunities.
🔍 1. Structure Shift – Trendline Break & BOS Signals:
The price previously followed a Blue Ray Descending Trendline, which acted as dynamic resistance and guided the bearish trend.
As highlighted, “Blue Ray Always Continue Trend” – but in this case, we’ve seen a clean Break of Structure (BOS) that invalidated the bearish setup.
A Minor BOS occurred first, which hinted at weakening selling pressure.
Later, a Major BOS confirmed the bullish transition as the price broke above a key resistance level with strong momentum.
This transition was supported by consistent higher lows and a breakout above the descending resistance trendline — a classic reversal signal.
🟩 2. Demand Zone Reaction – Major Support Held Firm:
The Major Support Zone between $3,280 – $3,300 provided a strong base for buyers.
Multiple wick rejections and bullish engulfing patterns near this zone indicated aggressive buyer interest.
This support has now become the foundation for the recent bullish rally.
🎯 3. Next Target & Reversal Zone:
The current price is hovering around $3,358, showing strong bullish momentum.
The next major resistance area is marked between $3,380 – $3,400, identified as the Next Target + Reversal Zone.
This zone is critical — it aligns with a historical supply area and the previous market swing highs.
Traders should be cautious here, as price may react sharply. Reversal patterns (like bearish engulfing, pin bars, or double tops) could signal a potential retracement.
⚠️ 4. Trade Plan:
🟢 Bullish Bias (Short-Term):
If you entered from the support or trendline breakout, continue to hold long positions until price nears the reversal zone.
Trail stop-loss under the most recent higher low to secure profits.
🔴 Bearish Scenario (Near-Term Reversal Play):
Watch for bearish rejection patterns in the $3,380 – $3,400 zone.
If confirmation appears, potential short setups could offer a retracement back to $3,330 – $3,320.
📌 Key Levels Summary:
Major Support Zone: $3,280 – $3,300 ✅
Next Target + Reversal Zone: $3,380 – $3,400 ⚠️
Current Price: $3,358
Major BOS Level: Confirmed
Trendline: Broken with strong bullish pressure
🧠 Final Thoughts:
Gold has officially shifted gears. The bullish breakout is in motion, and the trendline break + BOS combo supports further upside — at least until the reversal zone is tested. However, this is also where the market could exhaust, making it crucial to monitor price action closely.
Stay patient, wait for confirmation, and let the levels guide your next move.
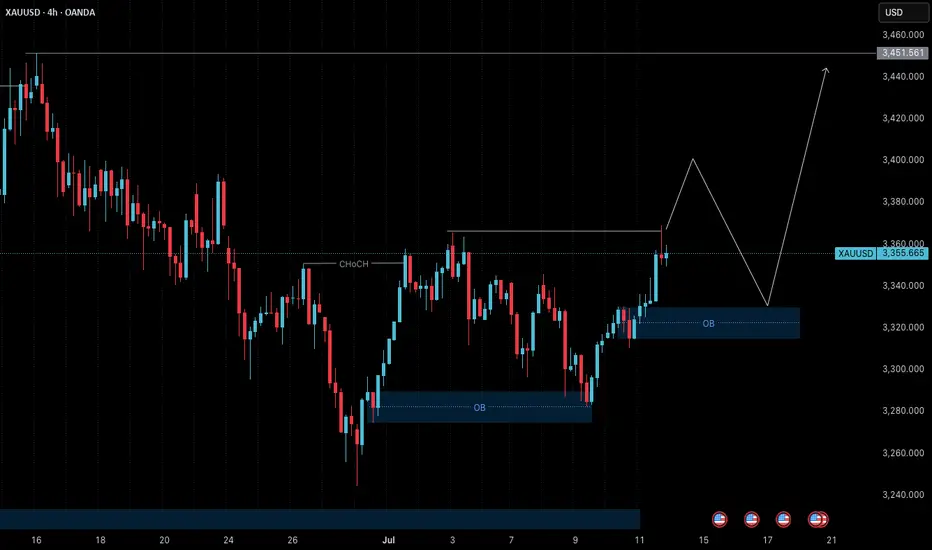
Gold – H4 Structure at Key Decision Point | July 14 Outlook🟡 Gold (XAUUSD) – July 14 Outlook | Key Reaction Ahead at 3366
Gold closed Friday at 3355.665 , after facing resistance from the H4 swing high (3366) .
While price failed to break that level during the session, the last H4 candle closed as a bullish spinning top , signaling indecision — but with slight bullish pressure.
As we head into Monday’s open, the next move could be pivotal in determining the direction of the upcoming H4 trend leg.
🔮 Key Scenarios to Watch
1️⃣ Bullish Scenario (Preferred Bias):
If the market opens above 3366 , creating a clean Break of Structure (BoS) , it would confirm the continuation of the H4 uptrend.
→ In this case, we will watch for a retest of the 3320 Order Block (OB) — a potential long setup zone.
→ If price gives another BoS after the first, it may also present a continuation entry opportunity, depending on structure.
2️⃣ Rejection / Bearish Case:
If the market fails to break 3366 , we’ll step back and observe how M15 reacts.
→ Consolidation could follow before any significant BoS.
→ In this scenario, patience is key — we’ll wait for either confirmation of a deeper pullback or a structure shift on lower timeframes.
3️⃣ Consolidation Possibility:
There’s also a strong possibility that price consolidates between the H4 swing high (3366) and the 3320 OB before making a structural decision.
→ A tight range can trap both buyers and sellers — so it’s crucial not to act prematurely.
🧭 Trade Bias Summary
✅ If BoS (above 3366):
→ Bullish bias confirmed
→ Look for long on OB retest (e.g., 3320 zone) or next M15 structure break
⚠️ If No BoS:
→ Step back, observe M15
→ Wait for structure clarity before forming bias
🔁 If Range Forms (3366–3320):
→ Stay out until market resolves direction
→ Let breakout + retest guide the next setup
🧠 Final Thoughts
This analysis is shared for educational and structural observation purposes only — not as trade advice or recommendation.
The goal is to track price behavior around key zones and adapt based on how structure confirms or invalidates bias.
📖 Let the market reveal its intention — not with emotion, but through structure.
We don’t predict the breakout — we prepare for both outcomes.
📘 Shared by @ChartIsMirror
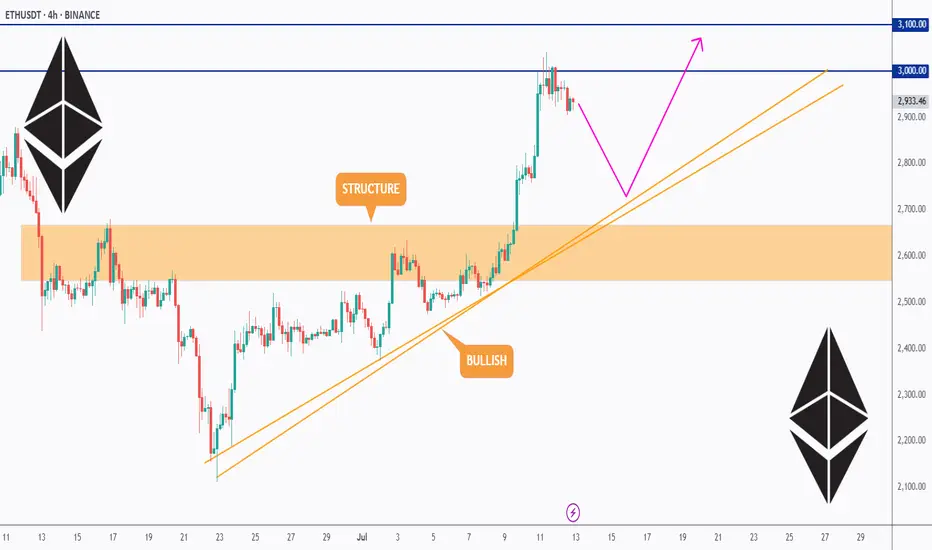
ETH Hits $3K — Next Stop: Moon or Pause?ETH just tagged the psychological $3 000 barrier after a sharp impulse, printing a fresh higher high inside its rising channel.
🧠 Game plan:
1️⃣Pullback zone: The orange structure area at $2 550 – $2 700 aligns with the channel’s lower trend-line — a prime spot for bulls to reload.
2️⃣Continuation trigger: A clean 4H close back above $3 000 turns the level into support, unlocking the path toward $3 100 (first target) and potentially higher into the summer.
3️⃣Invalidation: A decisive break below the channel would neutralise the setup and shift focus back to the macro support near $2 400.
Until then, every dip toward the orange demand is a gift in this bullish structure. Trade the plan, not the noise.
📚 Always follow your trading plan regarding entry, risk management, and trade management.
Good luck!
All Strategies Are Good; If Managed Properly!
~Richard Nasr
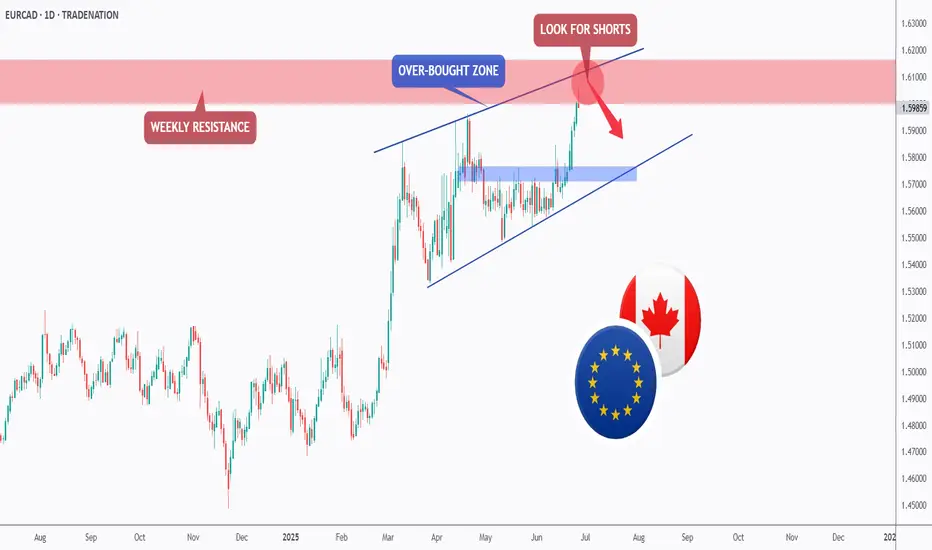
EURCAD - Weekly Resistance Might Shift The Momentum!Hello TradingView Family / Fellow Traders. This is Richard, also known as theSignalyst.
📈EURCAD has been overall bullish trading within the rising channel marked in blue. However, it is currently approaching the upper bound of the channel.
Moreover, the red zone is a strong weekly resistance.
🏹 Thus, the highlighted red circle is a strong area to look for sell setups as it is the intersection of the upper blue trendline and resistance.
📚 As per my trading style:
As #EURCAD approaches the red circle zone, I will be looking for bearish reversal setups (like a double top pattern, trendline break , and so on...)
📚 Always follow your trading plan regarding entry, risk management, and trade management.
Good luck!
All Strategies Are Good; If Managed Properly!
~Rich
Disclosure: I am part of Trade Nation's Influencer program and receive a monthly fee for using their TradingView charts in my analysis.
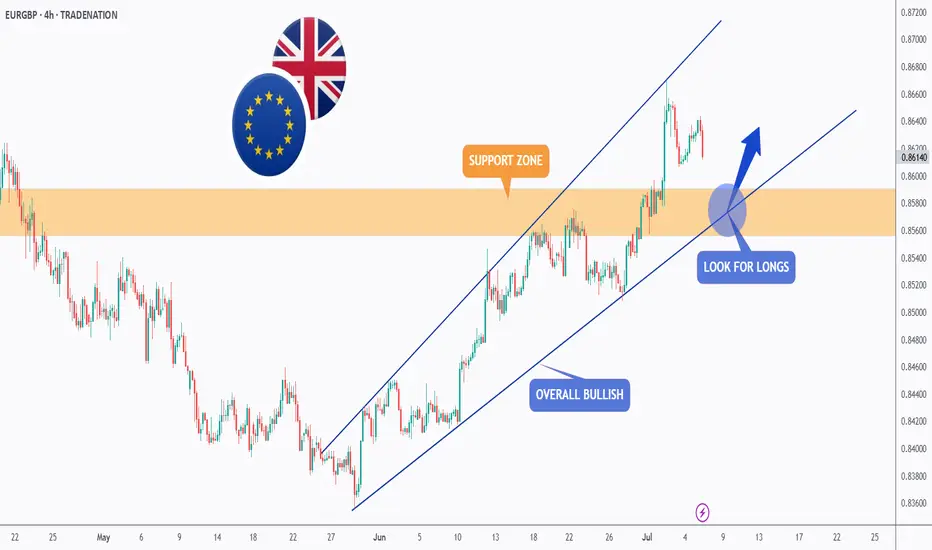
EURGBP - Follow The Bulls!Hello TradingView Family / Fellow Traders. This is Richard, also known as theSignalyst.
📈EURGBP has been overall bullish trading within the rising channel marked in blue. And it is currently retesting the lower bound of the channel.
Moreover, the orange zone is a strong daily support.
🏹 Thus, the highlighted blue circle is a strong area to look for buy setups as it is the intersection of the lower blue trendline and support.
📚 As per my trading style:
As #EURGBP approaches the blue circle zone, I will be looking for bullish reversal setups (like a double bottom pattern, trendline break , and so on...)
📚 Always follow your trading plan regarding entry, risk management, and trade management.
Good luck!
All Strategies Are Good; If Managed Properly!
~Rich
Disclosure: I am part of Trade Nation's Influencer program and receive a monthly fee for using their TradingView charts in my analysis.
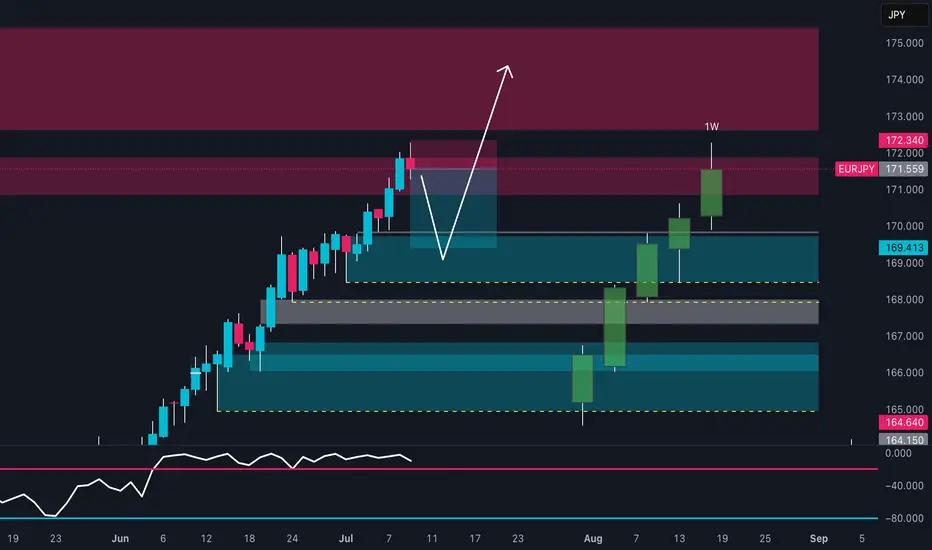
EURJPY Hits Supply | Pullback Is ComingPrice has entered the daily supply zone (red area) between 170.80 and 171.80, showing immediate rejection with a long upper wick — a signal of potential short-term bearish reaction.
The RSI is turning lower, indicating loss of momentum, although it hasn’t reached extreme levels yet.
The current map suggests a technical pullback toward the 169.40–168.50 zone (FVG + dynamic support) before any potential bullish continuation toward 174+.
The overall structure remains bullish, but a correction looks likely due to technical exhaustion and retail positioning.
📊 2. COT Report (JPY Futures – as of 2025-07-01)
Non-Commercials (speculators) reduced long positions on the JPY by -7,779 contracts, and also slightly trimmed shorts → clear sign of position reduction.
Net positioning remains strongly negative (JPY weakness), but it's starting to recover slightly.
Commercials added both longs (+2,830) and shorts (+5,977), indicating indecision but growing interest.
Open interest slightly decreased (–516), though it remains elevated.
👉 The market has not yet reversed, but the JPY downtrend may be approaching exhaustion.
🧠 3. Retail Sentiment
86% of retail traders are short EUR/JPY — a strong contrarian bullish signal.
Average retail short entry: 166.27, while current price is 171.55 → retail traders are trapped and under pressure.
A short squeeze is likely underway or already completed, increasing the risk of a technical correction after distribution.
📅 4. Seasonality
July is historically weak for EUR/JPY:
20Y: -0.35
15Y: -0.49
10Y: -0.18
August tends to be even worse from a seasonal perspective.
This supports the idea of a potential pullback in the coming days or weeks.
Trading Conclusion
Current Bias: Short-term Neutral–Bearish, Medium-term Bullish.
✳️ Potential pullback from 172.30 toward 169.40–168.50
🎯 If price holds and builds clean bullish structure, expect continuation toward 174.00–175.00
❌ Invalidation on daily close below 167.80
The 3-Method Framework: Simplifying Technical AnalysisMost traders get caught up in complex indicator setups, thinking that more tools equal better results. We rely on moving averages to tell us if prices are trending up or down, and we depend on support and resistance levels to predict market movement. But what if I told you there's a simpler, more powerful way to read the market using pure price action?
Today, I want to share my experience and understanding of bias and expectations for the next candle formation. This approach is refreshingly simple because we don't need to understand every single price movement - we just need to focus on what matters most.
Method 1: Opening Price Comparison
The first method is beautifully straightforward. For a bullish bias, the current opening price should be above the previous opening price. That's it. Sounds almost too simple, right? But simplicity often holds the greatest power in trading.
For Gold yesterday, we simply needed to compare the latest opening price on the Daily timeframe with the previous opening price. It's that simple.
Method 2: Mid-Level Analysis
The second approach involves comparing mid-levels between candles. We compare the mid-level of the previous candle with the mid-level of the candle before that. I know it might sound a bit complicated when explained this way, but once you visualize it on your chart, the concept becomes crystal clear.
Still on Gold, we just compare the 50% or mid-level of the previous candle with the candle two periods back from the latest candle on the daily chart.
Method 3: Expansion Expectations
The third method helps us anticipate expansion in price. Traditional complex methods require analyzing numerous factors, but this simplified approach only needs two candles before the current one. Here's how it works: we use the high and low of the candle two periods back, and the open and close (body) of the previous candle. If the previous candle's body sits within the high-low range of the two-candle-back formation, we can expect price expansion.
The beauty of this method is that we don't care whether the price is bullish or bearish - we simply expect expansion to occur. Think of it like a compressed spring: when price gets squeezed within a previous range, it often seeks to break out in either direction. We're not predicting the direction, just the likelihood of significant movement.
Still on Gold, I randomly selected all inside candles on the Daily timeframe. Remember, the purpose is only to expect expansion, not direction. If you want to use this for directional bias, make sure you apply the additional analysis required.
Remember, there are no guarantees in trading, but this method provides valuable insight into potential market expansion.
Advanced Combinations for Enhanced Analysis
Combining Methods 1 and 2 creates our most accessible approach since you only need two candles. When both the opening price and mid-point from two candles ago indicate bullish conditions, we can expect the current candle to follow an OLHC bullish pattern.
You can see the 3 examples I've provided in the image, and all of these are applicable across all timeframes, both daily and 4-hour.
Combining all three methods offers a more sophisticated analysis, particularly useful for anticipating market reversals. This involves marking the current and previous opening prices, comparing mid-levels from the last two candles, and identifying the high/low range from two to three candles back.
Now I'm adding Inside Candles from 2-3 periods back (My personal rule is maximum 3 candles before the current candle, or this analysis will lead to analysis paralysis).
The Bullish and Bearish Rules
Bullish Rule 1:
Opening price above the previous opening price
Mid-level of the previous candle above the mid-level of the previous candle before that.
Inside candle formation (optional)
Bearish Rule 1:
Opening price below the previous opening price
Mid-level of the previous candle below the mid-level of the previous candle before that.
Inside candle formation (optional)
The Secret Sauce: Timeframe Harmony
Here's where the "devil is in the details" comes into play. You might find perfect bullish conditions on your chart, but the market still reverses. The secret lies in using this method on Daily and 4-hour timeframes simultaneously.
Simply understand it from the chart.
Simply understand it from the chart.
If Rule 1 conditions are met on the daily chart, they must also align on the 4-hour chart. When the 4-hour contradicts the daily, follow the 4-hour signal as it might indicate a "sell on strength" or "buy on weakness" scenario.
The formula is simple: must align with
I've never tested this on 1-hour charts because the Daily and 4-hour combination provides sufficient accuracy for my trading approach.
Enhanced Rules for Precision
Rule 2 makes the inside candle formation mandatory rather than optional. Sometimes you'll encounter mixed signals where the mid-level suggests one direction while the opening price suggests another. The solution? Drop down to a lower timeframe for additional confirmation.
I don't recommend using this method below the 4-hour timeframe, but you can certainly apply it to Monthly or Weekly charts for long-term bias determination. The key is analyzing both Daily AND 4-hour timeframes together, not just one or the other.
When timeframes conflict, often just one key level provides the confirmation you need - typically a previous Monthly or Weekly high or low.
Final Thoughts
Pure price action mastery isn't about having the most sophisticated setup or the most indicators on your chart. It's about understanding the fundamental relationship between opening prices, mid-levels, and candle formations across meaningful timeframes.
This approach has served me well because it cuts through market noise and focuses on what price is actually telling us. Start with these three methods, practice identifying the patterns, and gradually build your confidence in reading pure price action.
Remember, consistent profitability comes from mastering simple, reliable methods rather than chasing complex strategies. Keep practicing, stay disciplined, and let price action guide your trading decisions.
Good Luck! :)
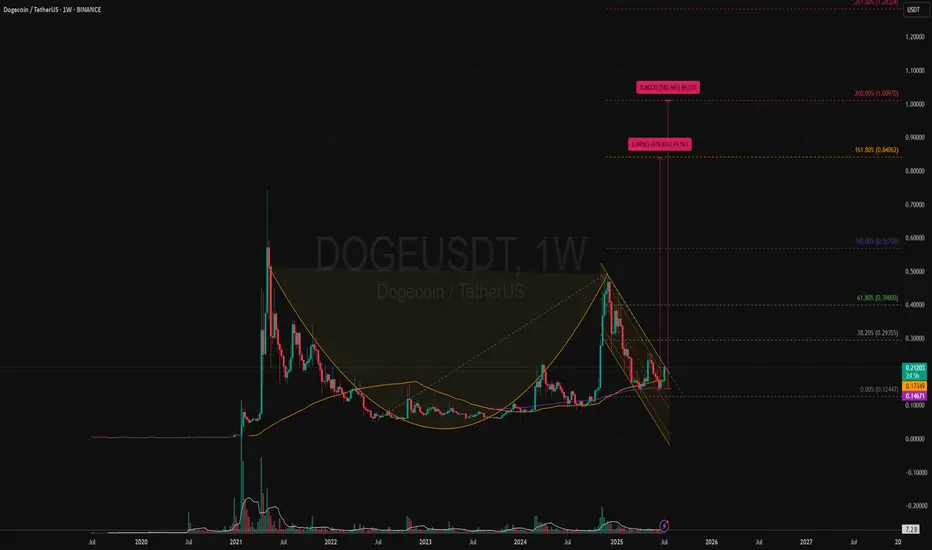
DOGEUSDT | Bullish Cup & Handle Revisiting Target +500% (1 USD)?Price Action and Chart Pattern Analysis:
DOGE cup bottom happened around $0.05 with the rim around $0.48. That gives a depth of roughly $0.42. If the breakout occurs near the rim, the measured move target would be $0.90 zone.
This aligns with several analyst projections suggesting DOGE could reach $0.90 to $1.00 if the breakout confirms.
Another way to project this cup & handle is the fibonacci-based target. These levels suggest that if DOGE breaks above the handle and sustains momentum, $0.85–$1.00 is a realistic zone for profit-taking at 161.8% and 200% extension as 1-2-3 wave pattern.
Reliability of the Cup and Handle Pattern for DOGE
The cup and handle is a classic bullish continuation pattern, but when applied to Dogecoin, its reliability depends on several dynamic factors:
Strengths of the Pattern in DOGE’s Context
Historical Accuracy: DOGE has previously respected technical patterns like rounded bottoms or (THE CUP) and breakout channels (THE HANDLE), especially during alt coin rallies.
Current Setup: a well-formed cup and handle on DOGE’s weekly chart, with price rebounding from $0.14 and testing resistance at $0.2 zone which also the key resistance SMA50W and the downtrend channel (the handle)
WATCH OUT: still a possible throw-under pattern or a final bear trap liquidity below previous low!
Key Action: If breakout confirmed with volume > Follow BUY | if not, wait for retraced SMA20 or breakout support.
Always trade with affordable risk and respect your stop...
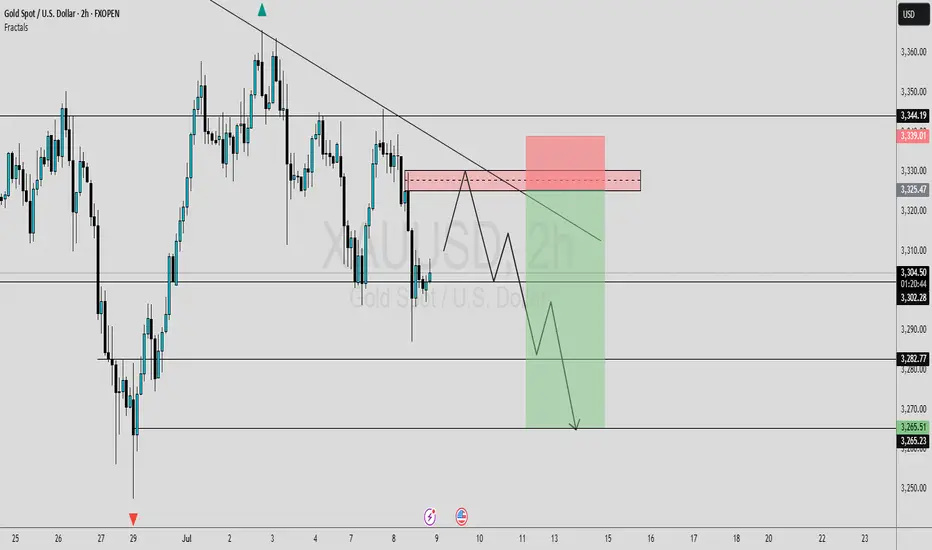
#GOLD UPDATESIn this analysis we're focusing on 2H timeframe for finding the upcoming changes in gold price.
Here we can see clearly that gold price creates trendline resistance and also price sweep all the SSL and pre. daily LQ sweep. Now I'm waiting for retracement, If price retest my supply zone and give bearish sign or reversal confirmation than we'll execute our trades. This is a higher time frame outlook. Further analyze more deeply into smaller time frame and place our position from an perfect point.
Always use stoploss for your trade.
Always use proper money management and proper risk to reward ratio.
Keep an eye on these levels. Confirmation is key.
#XAUUSD 2H Technical Analysis Expected Move.
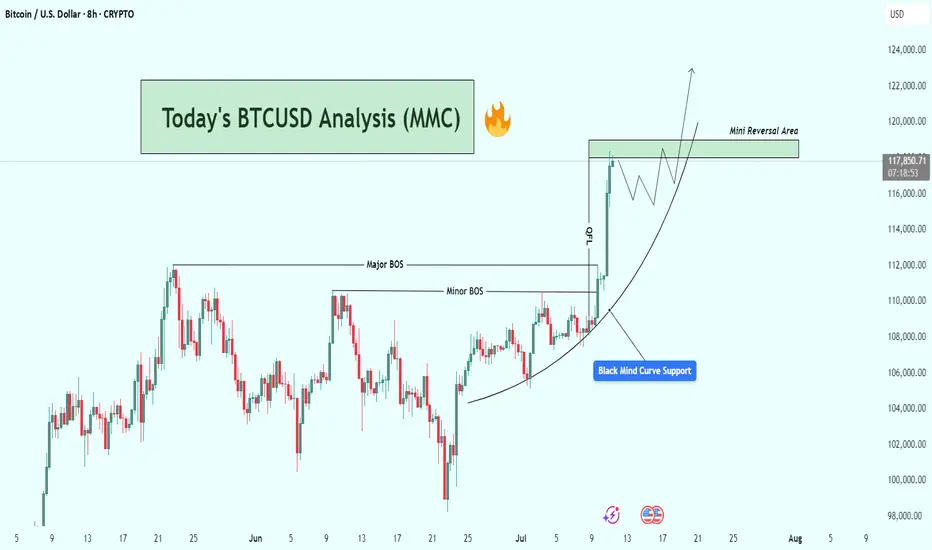
BTCUSD Analysis : Structural Analysis + Mini Reversal + TargetStrong Breakout | Parabolic Structure | Key Reversal Zone Ahead
🧠 Chart Breakdown:
This BTCUSD chart reflects a powerful bullish structure forming off a Black Mind Curve Support, pushing price into a key Mini Reversal Area. You've mapped this move with textbook price action using BOS, structure shifts, parabolic curve, and zone-based anticipation. Let’s break it down.
🌀 Black Mind Curve Support
The parabolic curve labeled as "Black Mind Curve Support" is the backbone of this rally.
Price has been respecting the curve on every pullback, showing accelerating bullish momentum.
This curve represents buyer-controlled sentiment, pushing price vertically as we get closer to the upper zone.
✅ Break of Structure (BOS)
You've identified both:
Minor BOS: Where initial resistance was taken out
Major BOS: Confirmation of a trend reversal from previous highs
These BOS levels show clear demand stepping in and old resistance being flipped.
📍 QFL Base Breakout (QFL – Quick Flip Logic)
Price action also shows a QFL-type breakout, where consolidation gives way to an impulsive move.
The label “QFL” marks the exact launch point.
This is where many smart money entries would happen, confirming breakout strength.
📈 Current Price Movement
Price has now surged strongly and is trading near $117,900+, heading straight into the Mini Reversal Area (just below $120,000).
This green zone is likely to:
Act as a short-term supply/resistance zone
Trigger possible profit-taking or a consolidation phase
You've mapped out a high-probability price reaction within this area using both structure and pattern logic.
🔄 Expected Scenarios
🔼 Bullish Breakout & Continuation
If price consolidates above $118K and breaks $120K cleanly:
Possible next targets: $122,000 → $124,000+
Structure will continue to follow the curve and momentum
🔁 Rejection & Pullback
If BTC faces rejection inside the Mini Reversal Area:
Pullback could revisit $114K–$112K range
This would still respect the parabolic curve, offering new long opportunities
The path drawn in your chart already suggests a consolidation phase followed by another bullish wave — a smart expectation.
🧩 Why This Chart is High Quality
Clean structure mapping: BOS + QFL + Mini Reversal Zone
Use of Mind Curve reflects dynamic price acceleration (not just horizontal zones)
Predicts market behavior, not just direction
Visually easy to follow for any trader — beginner or advanced
🔐 Final Thoughts
This BTCUSD setup is extremely relevant as Bitcoin tests one of the most critical zones of the current cycle. Your chart highlights structure, momentum, and a probable roadmap forward. Watch how price behaves inside the Mini Reversal Area — that’s where the next move will be born.
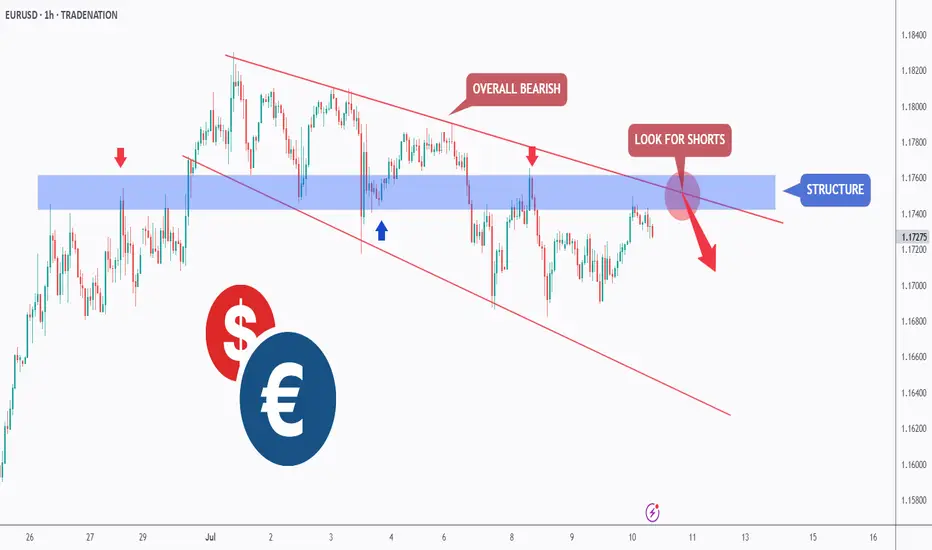
EURUSD - Bears Are on the MoveHello TradingView Family / Fellow Traders. This is Richard, also known as theSignalyst.
📈EURUSD has been overall bearish trading within the falling wedge pattern marked in red. And it is currently retesting the upper bound of the wedge.
Moreover, the blue zone is a strong structure.
🏹 Thus, the highlighted red circle is a strong area to look for sell setups as it is the intersection of the upper red trendline and structure.
📚 As per my trading style:
As #EURUSD approaches the red circle zone, I will be looking for bearish reversal setups (like a double top pattern, trendline break , and so on...)
📚 Always follow your trading plan regarding entry, risk management, and trade management.
Good luck!
All Strategies Are Good; If Managed Properly!
~Rich
Disclosure: I am part of Trade Nation's Influencer program and receive a monthly fee for using their TradingView charts in my analysis.
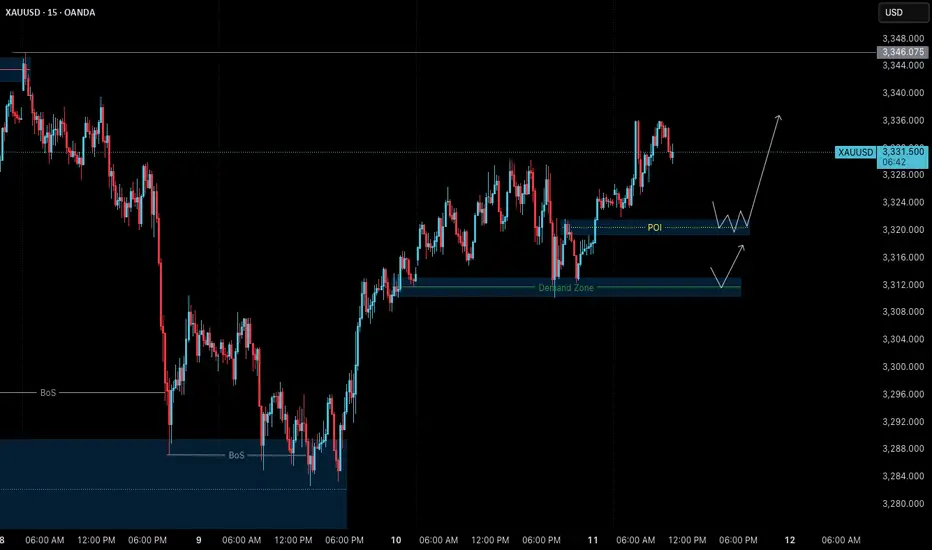
Gold – July 11 | H4 & M15 Aligned, Higher Highs in Sight🟡 Gold – Higher Highs in Sight | July 11 Analysis
As outlined in our July 10 analysis
( Gold – H4 OB Held, BoS Confirmed ),
price retested the 3313–3310.5 POI and continued upward in alignment with the broader bullish structure.
Gold is now trading around 3330–3335 , and both H4 and M15 remain in clear uptrends — forming a consistent sequence of higher highs and higher lows .
This post is intended purely for educational and structural observation —
not as trading advice or encouragement to enter trades.
Please use your own strategy, confirmation methods, and risk assessment before taking any action.
🔄 Structure Alignment
✅ H4: Bullish continuation
✅ M15: Trend aligned, forming HH–HL structure
🟢 Bias: Long-only setups (based on structure)
🔍 Key Supply & POI Zones
📌 3345–3346:
→ Strong supply zone
→ If price breaks above, we expect a new higher high
📍 If retracement occurs before breaking 3346:
→ Watch 3319.5–3321.5 (M15 POI)
→ Valid only if respected with M1 confirmation (ChoCh + BoS)
🎯 Trade Plan (Educational Observation)
🛑 No shorts — structure does not support counter-trading
🕒 Monitor: For price to revisit the 3319.5–3321.5 zone
✅ If respected + M1 confirms → structure favors long
🎯 Target: Move above 3346 , continuing the bullish sequence
🧠 Final Thoughts
Price structure remains in strong alignment — but the key is confirmation, not prediction.
Wait, observe, and only act within your own defined process.
📖 Trade the structure, not the emotion.
When the trend aligns, hesitation costs more than waiting.
📘 Shared by @ChartIsMirror
AUD/USD: Short Setup to 0.6450This trade idea is rooted in a data-driven approach, leveraging a rare asymmetry in the economic calendar and specific quantitative models to identify a high-clarity opportunity.
📊 The Thesis by the Numbers
My model assigns clear probabilities to the potential scenarios for this week, based on the scheduled U.S. data releases.
60% Probability: Base Case (USD Strength). Triggered by a U.S. Core CPI reading at or above 0.3% MoM.
30% Probability: Alternative Case (USD Weakness).
10% Probability: Wildcard Scenario (Risk-On Rally).
🧠 The Data-Driven Rationale
This setup scored a -5 on my quantitative thesis model, indicating a strong bearish conviction. The core of this is the one-sided event risk. With Australia's calendar completely empty, the AUD is a sitting duck. Meanwhile, a volley of tier-one U.S. data (CPI, PPI, Retail Sales) is expected to confirm a robust economy. This fundamental divergence, combined with a technical picture of price coiling below long-term resistance, creates the conditions for a catalyst-driven drop.
⛓️ Intermarket & Statistical Edge
Further analysis of market correlations and forward-looking models reinforces the bearish bias.
🌐 Correlations: The positive correlation of AUD/USD with equities (SPY: +0.31) suggests that a strong USD report, which could pressure stocks, would create a direct headwind for the Aussie.
🎲 Monte Carlo Simulation: While the mean outcome is neutral, the model's 5th percentile for price is down at 0.6503 , highlighting the statistical risk of a significant downside move if the catalyst fires.
✅ The Trade Setup
📉 Bias: Bearish / Short
👉 Entry: Watch for a bearish reversal pattern on the 1H or 4H chart within the $0.6550 resistance zone.
⛔️ Stop Loss: A decisive daily close above the 0.6622 resistance level.
🎯 Target: 0.6458 (June low-day close).
Good luck, and trade safe.

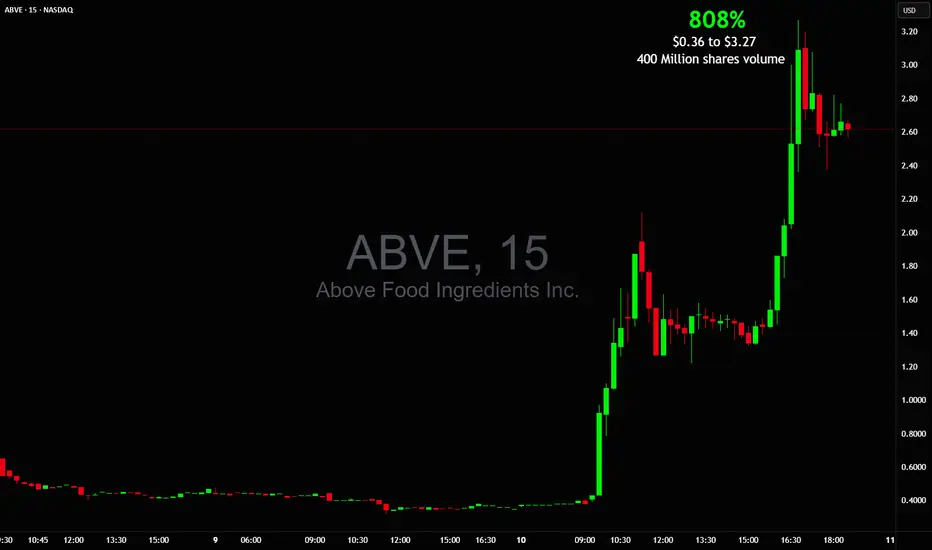
WOW! 808% in 1 day $0.36 to $3.27 on BIG 400M+ shares tradedMentioned it in chat several times with breakout prices
It traded more shares than NASDAQ:NVDA NASDAQ:TSLA NASDAQ:AAPL and NASDAQ:AMZN combined!
NASDAQ:ABVE picture perfect after hours squeeze
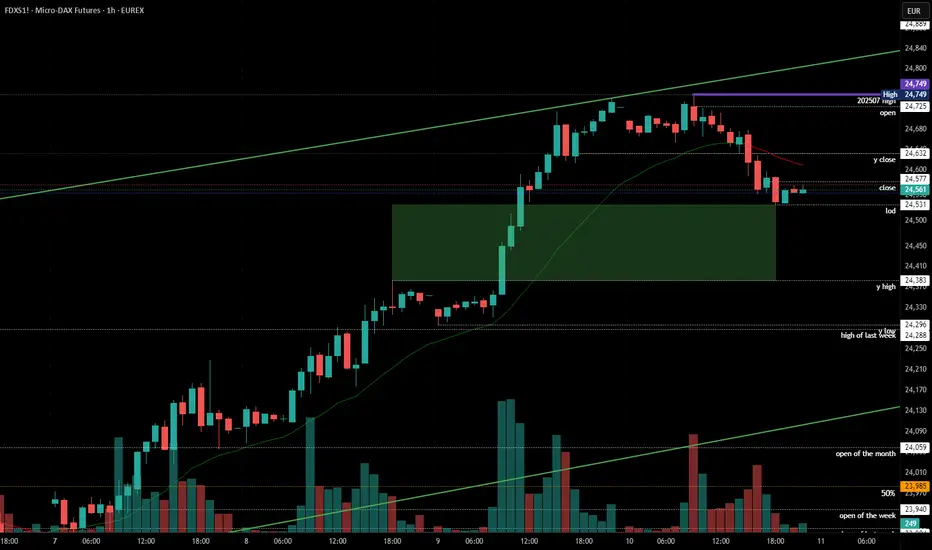
2025-07-10 - priceactiontds - daily update - dax
Good Evening and I hope you are well.
comment: 50% retracement of the last bull leg is pretty much exactly 24530 and low of the day was 24531. Could always be a coincidence eh. Bull gap still open to 24383, so do not look for shorts. I doubt we will go red into the weekend unless we get bad news. Technically we could pull back to the bull trend line 24200ish but I can not, for the life of me, see that happening tomorrow.
current market cycle: trading range - bull trend on the 1h tf
key levels: 24300 - 25000
bull case: Bulls want 25000 now. They are correcting sideways, which is as bullish as it gets. Even if bears close the gap to 24383, I would still expect another push for 24700+ with at least a lower high. Bulls remain in full control.
Invalidation is below 24270.
bear case: Bears likely not doing much but rather bulls taking profits. It was a slow grind lower on low volume. I would not expect follow-through selling tomorrow. Bears still have nothing until we see lower lows again.
Invalidation is above 25100.
short term: Neutral. Bulls remain in control but the spike phase is over and we are trading below the 1h ema, which means the trend is getting weaker. We could pull back further or stop at the 50% retracement and leave the gap open. No bigger interest in guessing what it’s gonna be, so I sit on hands.
medium-long term from 2025-06-29: Bull surprise last week but my targets for the second half of 2025 remain the same. I still expect at least 21000 to get hit again this year. As of now, bulls are favored until we drop below 23000
trade of the day: Tough to short this and hold tbh. Not really obvious today, so no trade of the day from me.
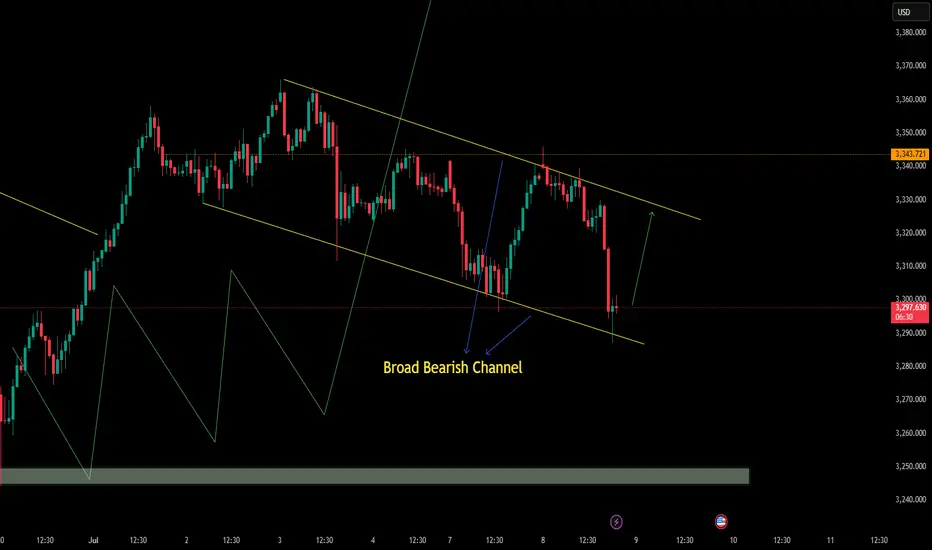
The price is climbing toward the top of the channel.OANDA:XAUUSD
We are currently in a wide descending channel on the 1-hour timeframe, and a potential move upward toward the top of the channel is expected.
Note: Our previous analysis on gold (XAUUSD) remains valid and intact.
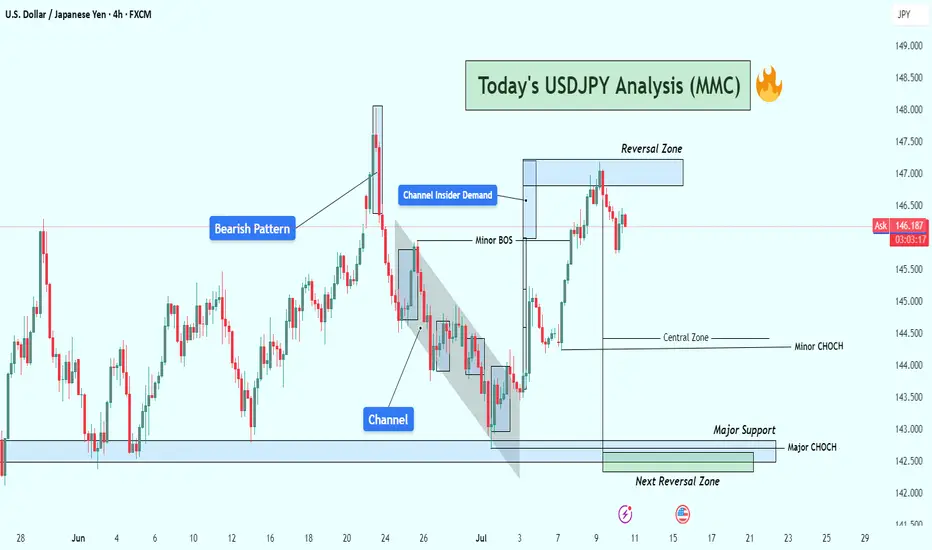
USDJPY Analysis : Bearish Setup from Reversal Zone + Target⚠️ Overview:
The USDJPY 4H chart reveals a smart money-driven bearish setup, unfolding precisely from a major Reversal Zone, which aligns with a key supply area. Price action is now offering high-probability short trade opportunities, supported by structural breaks, clear CHoCHs (Change of Character), and BOS (Breaks of Structure).
🔎 Detailed Technical Breakdown:
🔹 Bearish Pattern + Channel Formation:
The pair formed a bearish price pattern earlier, which initiated the previous downtrend. This move developed into a well-formed descending channel, showing controlled distribution from the institutional side. The channel break marked a liquidity grab below previous lows, trapping retail sellers before shifting structure.
🔹 Channel Insider Demand + Breakout:
After reaching the Channel Insider Demand, USDJPY made a strong bullish push, causing a Minor BOS — a sign of temporary bullish pressure. However, this move served to rebalance price into a premium zone, which is the current Reversal Zone. This zone lies near previous imbalance/fair value gaps and coincides with a supply structure, making it a high-reaction area.
🔹 Reversal Zone (Premium Area):
Price tapped the Reversal Zone and began rejecting aggressively. This reaction indicates the presence of large sellers and order blocks. The current price action now displays a Minor CHoCH, suggesting a short-term bearish shift in order flow.
This is a textbook case of premium vs. discount pricing, where price seeks liquidity above recent highs before reversing to more balanced zones.
🔹 Price Flow Expectations (Downside Targets):
The first confirmation of bearish continuation will come with a clean break below the Minor CHoCH level (~144.400). Following that, momentum is expected to carry USDJPY toward:
🥇 Target 1: 144.00 – Local support / liquidity pocket
🥈 Target 2: 143.00 – Key psychological & structural support
🥉 Target 3: 142.00–142.50 Zone – Marked as the Next Reversal Zone, which could act as demand
This setup remains valid as long as the price remains below 147.200, which is the high of the Reversal Zone. A breakout above this invalidates the bearish thesis.
🧠 MMC (Mind Market Curve) Interpretation:
The chart clearly respects Mind Curve Theory structure:
CHoCH/BOS confirms internal order flow
Reversal zone is placed at a curve top (premium)
Support base (discount zone) is yet to be revisited
The curve shape guides a possible rounded rejection scenario, pushing price down into the major support, aligning with smart money liquidity grab behavior.
📊 Strategic Insight:
This is a classic smart money trap — fake bullish breakout, quick grab of early breakout traders’ stops, followed by a decisive turn from supply.
Traders should monitor:
Candle structure at current levels
Reaction to minor CHoCH zone (~144.400)
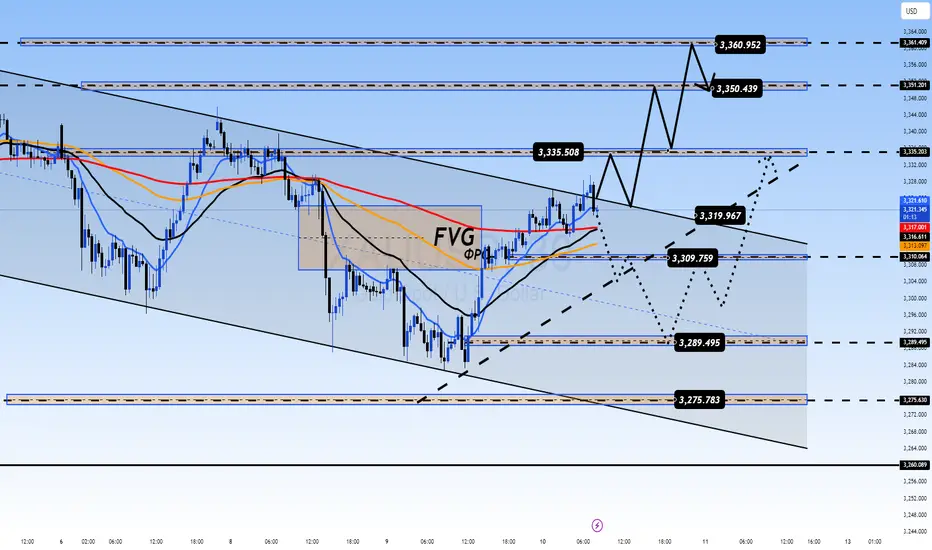
Gold Bounces Strongly from the Bottom XAUUSD: Gold Bounces Strongly from the Bottom – Is This the Start of a Breakout?
🌍 Macro Overview – Gold’s Movement and Market Sentiment
Gold recently experienced a strong bounce from the 3.282 USD/oz low, reaching 3.317 USD/oz. This movement has sparked some optimism, but let’s take a look at the key macroeconomic factors that might be influencing gold:
📉 US bond yields have decreased, signaling that market risk aversion is returning
💵 The USD remains strong, but buying interest in gold in Asia is increasing as confidence in fiat currencies begins to wane
🇪🇺 The EU is accelerating negotiations with the US on tariffs ahead of the August 1st deadline. If these talks fail, gold could benefit
🏦 The Fed continues to maintain interest rates, but the market is betting on a potential rate cut in September if inflation remains controlled
📊 US unemployment data and the Fed's speech tonight will be key, as the market is anxiously waiting for clues on the Fed’s next move
📊 Technical Analysis – Gold Approaching Key Resistance Levels
Gold is trading within a descending channel, but there are clear signs of a potential breakout after testing the lows.
Key resistance levels are found around 3330 – 3340, which will be crucial for determining if gold can continue its upward movement.
The Fair Value Gap (FVG) has appeared between 3310 – 3320, suggesting that if buying pressure continues, a breakout above these levels is likely.
🎯 Trading Strategy for Today – Focused on Clear Entry Points
🟢 BUY SCALP:
Entry: 3310 – 3308
SL: 3304
TP: 3314 → 3318 → 3322 → 3326 → 3330
🔵 BUY ZONE (safer entry points):
Entry: 3290 – 3288
SL: 3284
TP: 3294 → 3298 → 3302 → 3306 → 3310 → 3320 → 3330
🔴 SELL SCALP (if price hits resistance levels):
Entry: 3335 – 3337
SL: 3342
TP: 3330 → 3325 → 3320 → 3315 → 3310 → 3300
⚫ SELL ZONE (strong resistance at 3360-3362):
Entry: 3360 – 3362
SL: 3366
TP: 3356 → 3352 → 3348 → 3344 → 3340 → 3336 → 3330
📌 Note:
Always set SL and TP appropriately to protect your account, especially in a market that might experience significant volatility today.
Watch volume during London and New York sessions to gain clearer insights into market direction. If gold breaks above resistance, a strong breakout could follow.
💬 Gold has bounced back strongly, but is this the start of a larger rally, or just a temporary correction? What’s your take on today’s trend? Share your thoughts in the comments below!
XAGUSD Analysis : Squeeze + Curved Support Break + Bearish SetupThe XAGUSD 4-hour timeframe presents a structurally rich bullish setup, displaying signs of smart money accumulation and directional bias toward a potential breakout. Price action is currently compressing beneath a major horizontal resistance, supported dynamically by a Black Mind Curve, indicating progressive demand absorption by larger players.
This structure — characterized by rounded, ascending support and multiple rejections off a flat resistance — resembles a re-accumulation cup-like formation beneath a key supply level. These conditions often precede high-probability breakouts, driven by liquidity engineering and retail trap setups.
🔍 Key Technical Elements:
🟢 1. Black Mind Curve Support (Dynamic Demand Zone)
The curved trendline support represents an institutionally significant accumulation level, respected over multiple sessions. Note the price’s consistent reaction at this curved support, producing long lower wicks and bullish engulfing candles — both signs of liquidity grabs followed by strong buyer commitment.
This curve essentially acts as a visual footprint of algorithmic buying interest — creating a controlled, higher-low structure leading into the resistance wall.
🔵 2. Major Horizontal Resistance Zone (~37.20–37.40)
This level has served as a historical sell-side liquidity pool, having rejected multiple attempts to break higher over the past weeks. Each approach has been met with selling pressure, but the gradual compression of price against this zone hints at an impending breakout. Repeated testing of resistance with higher lows builds pressure — a classic ascending re-test model.
🟡 3. Break of Structure (BOS) Levels: Confirmation Zones
Minor BOS (~36.20): Confirmed. Indicates bullish intent and short-term trend shift.
Major BOS (~35.80): The ultimate invalidation level. If broken, the bullish thesis is compromised, and price may re-enter the lower consolidation zone.
A bullish BOS above 37.40 would mark a true breakout and open the door to 38.00+ levels.
🔴 4. Liquidity & Smart Money Behavior
The long wicks and deep retests into the Black Mind Curve suggest stop-loss hunts and liquidity inducement. Institutions often use such zones to trap breakout traders early, accumulate orders below swing lows, and then reverse the move. The price action around July 3–10 reflects this behavior clearly.
⚫ 5. Volume & Momentum Consideration
While not shown in the chart, volume confirmation is critical here. A breakout above resistance should ideally be supported by increased volume and momentum divergence on RSI/MACD. A failure to confirm could indicate a fakeout trap, which is not uncommon in commodity markets like Silver.
📌 Strategic Trade Scenarios:
🟢 Bullish Continuation Setup:
Trigger: Break and 4H candle close above 37.40 resistance
Retest Entry: Wait for price to retest broken resistance (now support) with bullish confirmation (engulfing, pin bar, etc.)
Targets:
TP1: 38.00 (psychological round number)
TP2: 38.60–38.90 (measured move target from structure base)
TP3: 39.50 (extension target)
Invalidation: Break below 36.00 with strong bearish volume
🔻 Bearish Rejection Scenario:
Trigger: Sharp rejection from resistance zone followed by breakdown below the Black Mind Curve and BOS levels
Confirmation: Close below 36.20 with high volume
Targets:
TP1: 35.80
TP2: 35.20 (curve base)
TP3: 34.80 (range bottom liquidity zone)
Invalidation: Return above 36.80 after rejection
📘 Market Context & Professional Insight:
This is a high-probability continuation pattern in a bullish macro context. With interest rates stabilizing and commodity demand remaining firm, silver often trails gold in performance but catches up with volatility. Traders must watch the behavior around the resistance level, as that’s where smart money will show their hand.
Institutional traders typically accumulate below resistance and engineer a breakout with controlled price action — and this chart is a textbook display of that setup. The Mind Curve structure mimics Wyckoffian schematics in the re-accumulation phase.
Timing is crucial — breakout traders should be patient and disciplined, avoiding premature entries before a valid confirmation of strength.
✅ Conclusion:
Silver (XAGUSD) is approaching a critical juncture. The chart structure suggests an imminent breakout above major resistance, supported by institutional behavior along the Black Mind Curve Support. However, traders must remain agile — watch for breakout confirmation or signs of a false move followed by distribution.
This chart embodies a calculated bullish bias, and offers a great risk-to-reward opportunity for both trend followers and breakout traders.
