Gold (XAUUSD) Analysis : Bullish Structure Setup + Target🧠 Gold (XAUUSD) Technical Analysis
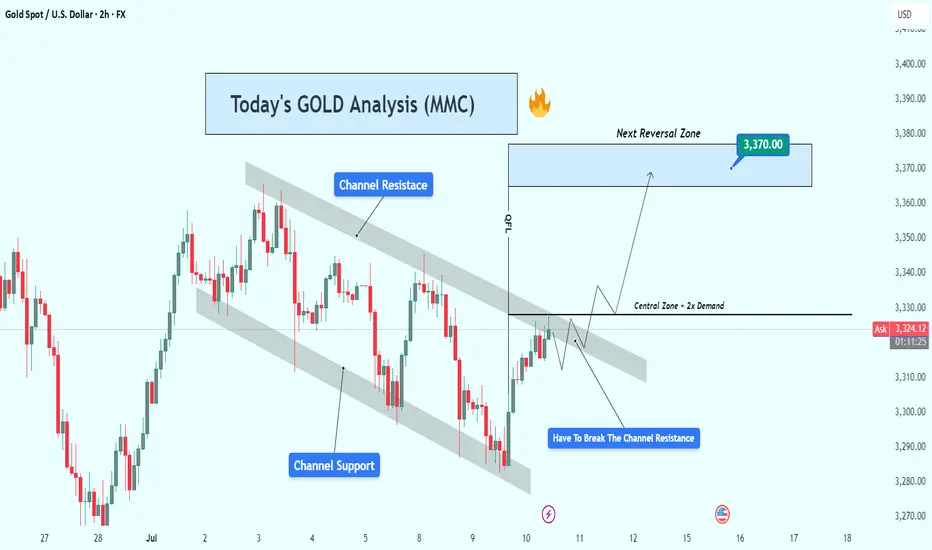
Gold has recently been trading within a clearly defined descending channel, which has governed price action over the past several sessions. This structure is characterized by a series of lower highs and lower lows, forming well-established channel resistance and channel support levels. However, recent bullish pressure has led price to aggressively test the upper boundary of this channel, signaling the potential for a structural breakout.
We are now at a technical inflection point, where a successful breakout and retest could mark the beginning of a significant trend reversal and short-to-medium term bullish move.
🔍 Key Technical Levels & Zones
🔷 Channel Resistance (~3,325)
The price is currently testing the descending trendline acting as channel resistance.
This area has previously rejected price several times, increasing its significance.
A confirmed break and close above this level may shift the market bias from bearish to bullish.
🔷 Central Zone – Dual Demand (~3,325–3,330)
This horizontal zone intersects with the channel resistance and aligns with two previous demand zones, now acting as a key decision area.
The market must validate this zone as new support before any sustained upward movement can occur.
🔷 Next Reversal Zone – Target (~3,370)
The next major area of interest lies around 3,370, a zone identified by previous swing highs and visible liquidity pools.
This level is likely to act as a magnet for price if bullish structure is confirmed.
📈 Price Structure Outlook
The potential breakout is supported by a strong bullish impulse off the channel support, followed by a series of higher lows suggesting growing bullish momentum. The projected movement scenario is as follows:
Break above the channel resistance
Retest and confirm the central zone as support
Continuation toward the 3,370 reversal zone
This would complete a classic break–retest–continuation pattern.
✅ Trade Considerations (Not Financial Advice)
Entry Type Entry Condition Target Stop Loss
Aggressive Break & 2H close above 3,330 3,370 Below 3,320
Conservative Retest & bullish confirmation above 3,325 3,370 Below 3,310
Risk Management:
Use position sizing aligned with your risk tolerance (max 1–2% per trade).
Monitor volume closely during breakout and retest for confirmation.
⚠️ Invalidation Scenario
If price fails to break above the channel and is rejected strongly, especially with a bearish engulfing or long upper wick, the downside could resume. In such a case, price may revisit the channel midline or even the lower boundary around 3,290.
📝 Summary
Gold is at a critical juncture, testing long-standing channel resistance.
A break above and successful retest of the 3,325–3,330 zone could lead to a rally toward 3,370.
This setup reflects a potential shift in structure from bearish to bullish on the 2H timeframe.
Priceaction
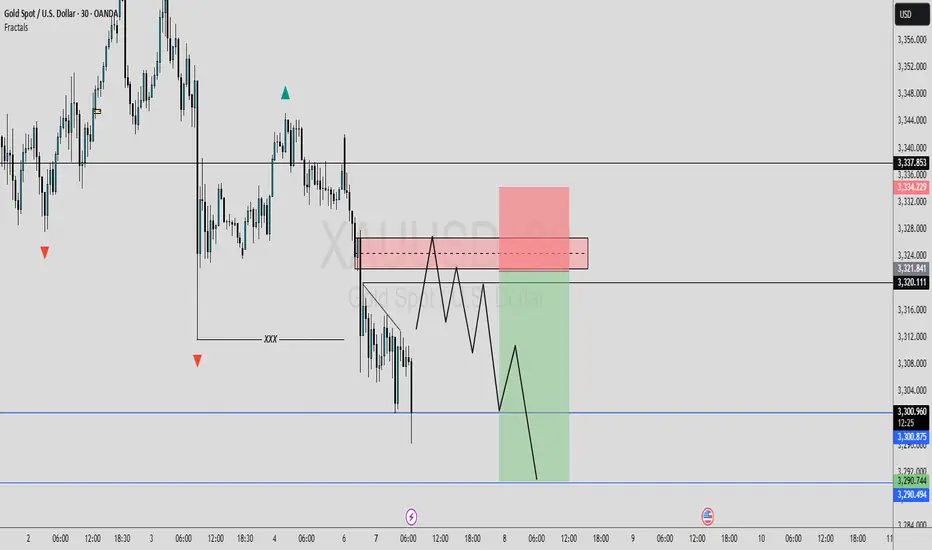
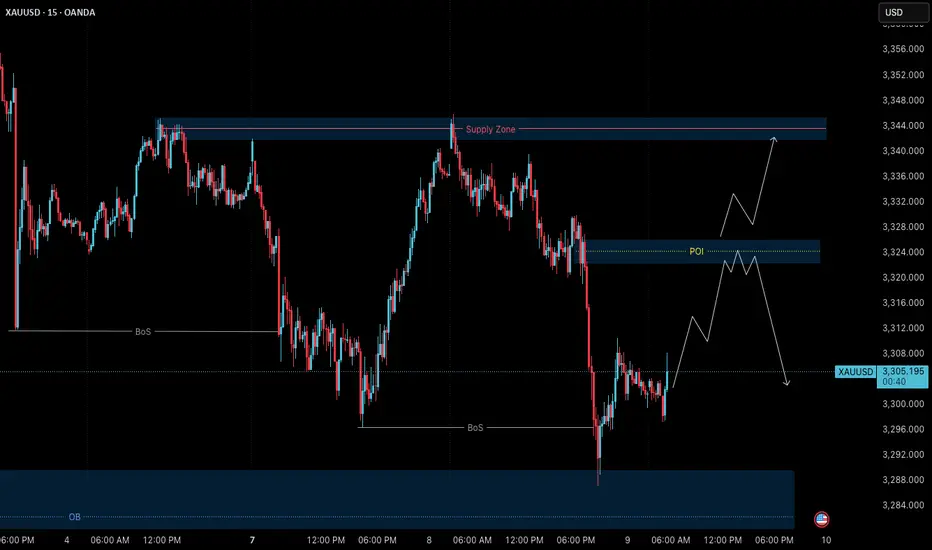
POSSIBLE BEARISH MOVE SCENERIO Currently we're monitoring 30M time frame chart. I’m expecting a sell move from the P.O.I zone marked on the chart. Since today is the first day of the week, the market volume is a bit low. Now let's see when the price reaches our P.O.I zone, and once it does, how the price behaves. We'll be watching for any bearish signs or confirmations. We’ll only enter the trade after getting a proper bearish confirmation. We'll also wait for the NY session to open before making any decisions. Let's see how this trade setup plays out.
Let's delve deeper into these levels and potential outcomes.
Always use stoploss for your trade.
Always use proper money management and proper risk to reward ratio.
#GOLD 30M Technical Analysis Expected Move.
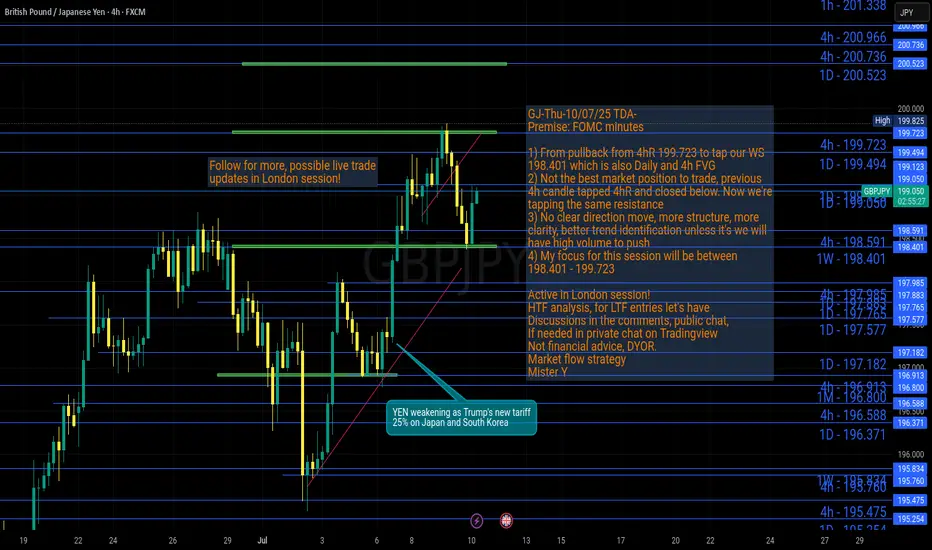
GJ-Thu-10/07/25 TDA-GJ pull back,good support created.Now what? Analysis done directly on the chart
Follow for more, possible live trades update!
I often share my live trades in Tradingview public chat in London session, stay tuned!
Houses aren't built over night, it takes brick by brick, one step at a time.
Same for trading, one step at a time. You make mistakes, you learn, you improve.
You make more mistakes, you learn more, you should improve more.
If it's easy, everyone will do it realistically.
Premise:
A simple idea plan (like Tradingview public posts) won't describe everything.
No one can predict how market will move, it's always good to react to how it moves.
It gives an idea of how price might move, but no one come from FUTURE.
So I always encourage people to openly and actively discuss in real time.
For example discussing on Tradingview public chat (and more).
I don't give signals blindly, people should learn
and understand the skill.
Following blindly signals you won't know how to
manage the trade, where precisely put sl and tp,
lot size and replicate the move over time.
That's why you need active real time discussions.
Trading is not get rich quick scheme!
Active in London session!
Not financial advice, DYOR.
Market Flow Strategy
Mister Y
GU-Thu-10/07/25 TDA-GU resuming bullish trend?Analysis done directly on the chart
Follow for more, possible live trades update!
I often share my live trades in Tradingview public chat in London session, stay tuned!
For every trade I take, no matter if it's a loss or win, I always
do post trade analysis. It really helps to understand and
improve. You get to know or try to figure out why price
at this time specifically moved this way or that way.
Premise:
A simple idea plan (like Tradingview public posts) won't describe everything.
No one can predict how market will move, it's always good to react to how it moves.
It gives an idea of how price might move, but no one come from FUTURE.
So I always encourage people to openly and actively discuss in real time.
For example discussing on Tradingview public chat (and more).
I don't give signals blindly, people should learn
and understand the skill.
Following blindly signals you won't know how to
manage the trade, where precisely put sl and tp,
lot size and replicate the move over time.
That's why you need active real time discussions.
Trading is not get rich quick scheme!
Active in London session!
Not financial advice, DYOR.
Market Flow Strategy
Mister Y

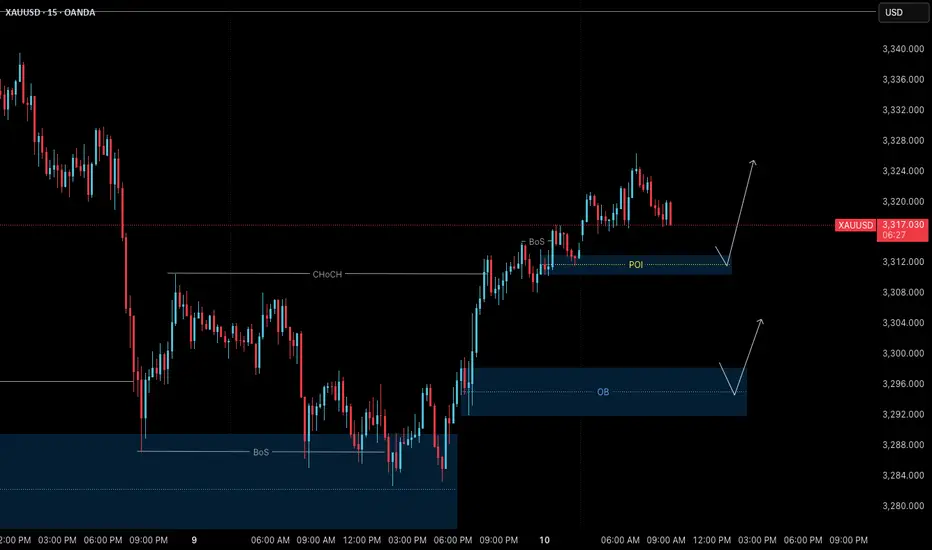
Gold – July 10 | H4 OB Held, BoS Confirmed, Watching 3310🟡 Gold (XAUUSD) – July 10 Analysis | H4 Pullback Over, M15 Aligned for Bullish Continuation
The H4 order block around 3280 (3288–3275) was tested, and the market responded strongly — just as anticipated .
Following that, M15 structure gave a clear ChoCh + BoS , signaling that the H4 pullback is now complete .
The market has likely resumed its bullish continuation trend.
🔁 Current Market Structure
✅ H4 Trend: Resumed upward after OB reaction
✅ M15 Trend: Now aligned with H4 (ChoCh + BoS confirmed)
Bias: Bullish
→ We are only looking for long setups , in sync with both timeframes
📍 Key Levels to Watch
1️⃣ 3322–3326 → M15 OB zone
→ Currently acting as rejection zone
→ Already reacted — price is pulling back
2️⃣ 3313–3310.5 → Next potential M15 POI
→ If respected with M1 confirmation (ChoCh + BoS), long setups become valid
🎯 Target: 3345
→ Based on structure projection and intraday range
📌 If 3313–3310.5 fails:
→ Watch next zone at 3296–3298 for fresh demand/support
🧭 Execution Plan
• Wait for price to enter 3313–3310.5 zone
• Look for M1 confirmation (ChoCh + BoS)
• If confirmed:
→ Enter long
→ Target = +120 pips (as per fixed RR model)
→ SL based on M1 structure
• If zone breaks:
→ Reassess near 3296–3298
🧠 Final Thoughts
The H4 pullback is over — structure confirms bullish continuation
M15 is aligned — we now prepare , not predict
Wait for the chart to call you in — not your bias.
📖 We don’t predict reversal — we confirm structure.
We don’t chase price — we prepare for it.
📘 Shared by @ChartIsMirror
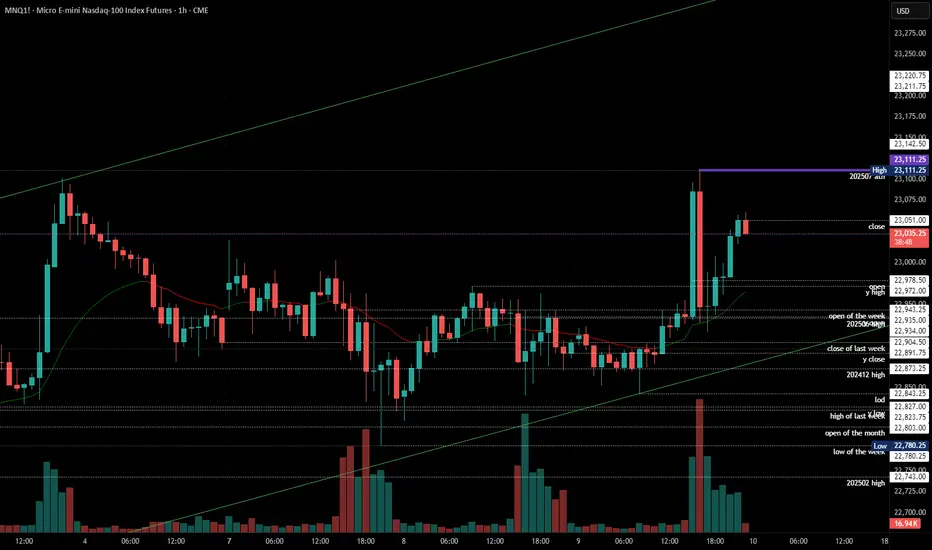
2025-07-09 - priceactiontds - daily update - nasdaqGood Evening and I hope you are well.
comment: Bears just need to do more. As long as we are not leaving behind bear gaps, bulls keep buying the dips. Wait for long pullbacks if we keep making higher lows. The bull channel is also still valid.
current market cycle: bull trend
key levels: 22700 - 23300
bull case: As long as Bulls stay comfortably above 22500, they are fine and sideways is a very bullish correction for them. Bears are certainly not doing much, so bulls buy every dip. Nothing changed. Might go up to 23300 or higher. No one knows where it will end but it’s likely orange face will end it and he will make sure he announces it in his private Epstein-and-Friends signal group in advance. Some put options 3-6m are fine to buy I think.
Invalidation is below 22700.
bear case: Bears are just not doing enough. Need something below 22700 and most likely an event to be the catalyst for it. I will leave it at that.
Invalidation is above 23500.
short term: Neutral until US-EU tariff shit show get’s a nice tweet or so. We will go down hard again. Be patient.
medium-long term - Update from 2024-06-29: No change in plans. I expect 20000 to get hit over the next 3 months and maybe 19000 again.
trade of the day: Long US open was a bit obvious but buying the huge drop was not.
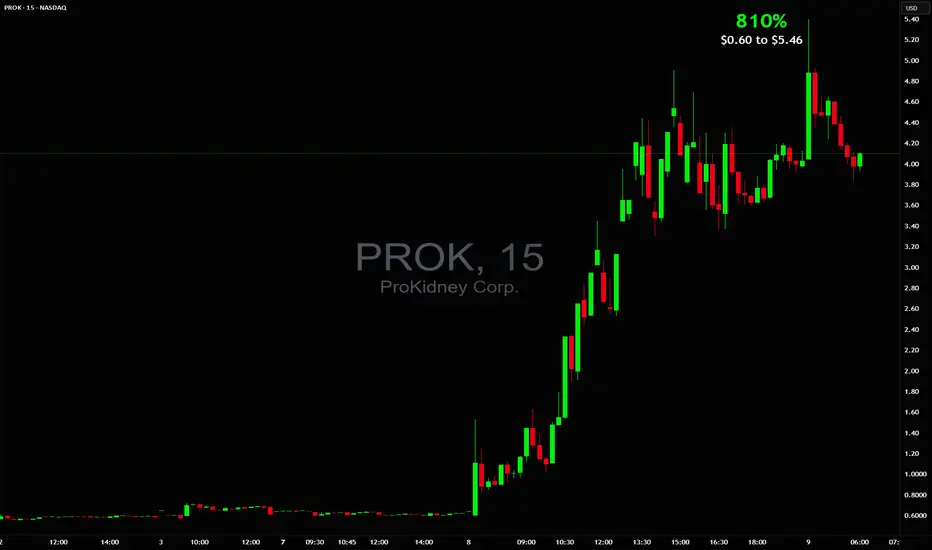
BIG 810% in 1 day $0.60 to $5.46💥BIG 810% in 1 day 📈 $0.60 to $5.46 there were almost more halts than candlesticks that's how wildly it traded NASDAQ:PROK
Other active stocks: NASDAQ:SCAG NASDAQ:BTCS NYSE:SRFM NASDAQ:BMGL NYSE:WOLF
#stocks #stockmarket #trading #trader #daytrade #strategy #teamwork #chart #analysis
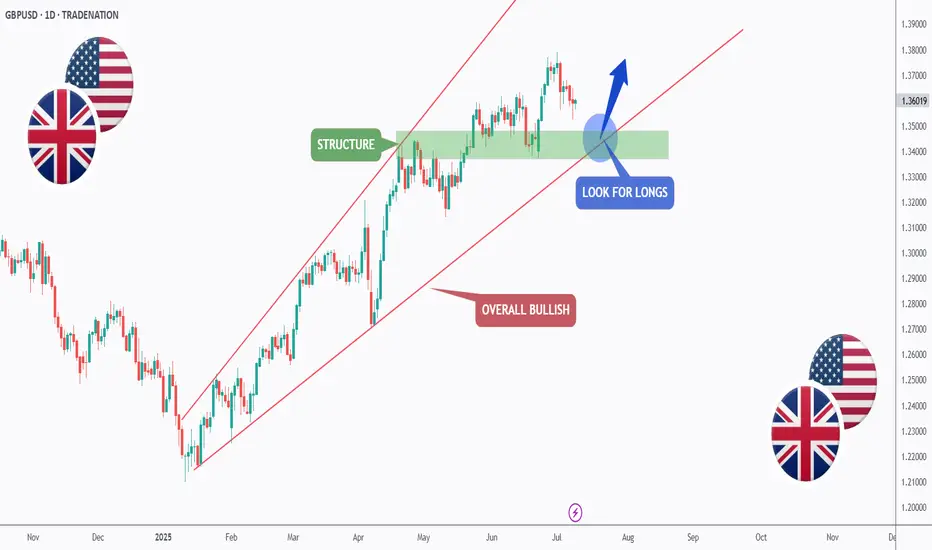
GBPUSD - Macro Trend Continues!Hello TradingView Family / Fellow Traders. This is Richard, also known as theSignalyst.
📈GBPUSD has been overall bullish trading within the rising channel marked in red. And it is currently retesting the lower bound of the channel.
Moreover, the green zone is a strong structure.
🏹 Thus, the highlighted blue circle is a strong area to look for buy setups as it is the intersection of the lower red trendline and structure.
📚 As per my trading style:
As #GBPUSD approaches the blue circle zone, I will be looking for bullish reversal setups (like a double bottom pattern, trendline break , and so on...)
📚 Always follow your trading plan regarding entry, risk management, and trade management.
Good luck!
All Strategies Are Good; If Managed Properly!
~Rich
Disclosure: I am part of Trade Nation's Influencer program and receive a monthly fee for using their TradingView charts in my analysis.
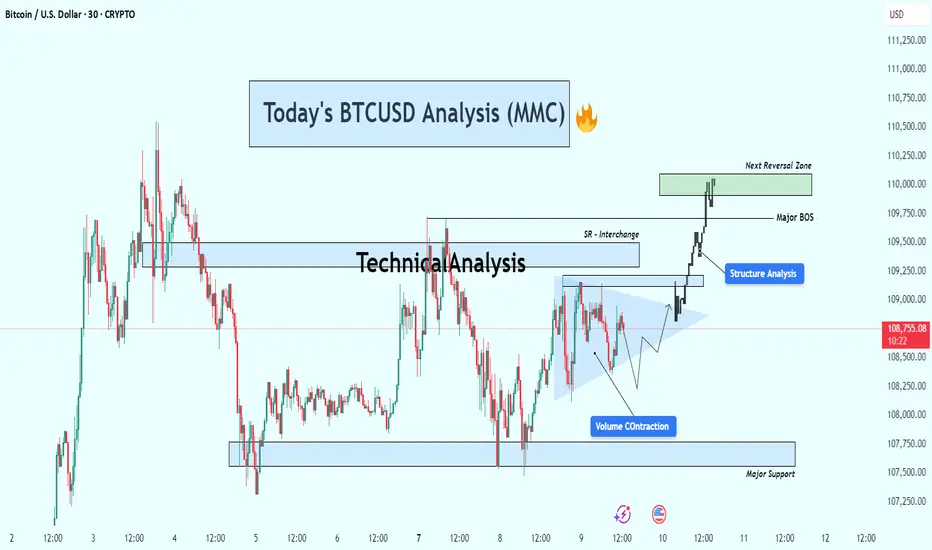
BTCUSD Breakout Confirmed – Targeting Next Reversal ZoneBitcoin (BTC/USD) is currently trading around $108,700, showing strong bullish momentum after breaking out of a consolidation structure. Price action has shifted significantly, with clear structural developments pointing toward continued upside — but not without caution around the next reversal zone.
🔍 Key Technical Insights:
🔹 1. Volume Contraction Triangle (Bullish Breakout)
The chart initially shows a volume contraction pattern forming a symmetrical triangle.
This pattern is often associated with market compression — a setup where smart money accumulates before a breakout.
BTC broke out of the triangle with strong bullish candles, confirming buyers have stepped in with conviction.
🔄 2. Structure Shift & Break of Structure (BOS)
A major BOS (Break of Structure) occurred as price broke previous swing highs, confirming a bullish market structure.
This BOS zone now acts as a potential support area if BTC pulls back.
A short-term SR interchange zone (Support becomes Resistance) was also respected and flipped again to support during the breakout — a clear sign of structural strength.
🧭 3. Next Reversal Zone – Supply in Sight
Price is approaching a major supply/reversal zone between $109,750 and $110,250.
This zone has previously shown strong selling interest.
Traders should watch for rejection or continuation patterns within this zone — such as bearish divergence, exhaustion candles, or confirmation of resistance.
🛡 4. Major Support Level
Below current price, a major support zone around $107,500–$107,800 remains intact.
This zone has provided a solid base during past consolidations and would be the first area of interest for buyers if a retracement occurs.
📌 Strategy Plan:
🔼 For Bullish Traders:
Those already in the breakout can hold with targets toward $110,000–$110,250.
If not in yet, wait for a retest of BOS/SR zone (~$109,000) for a safer re-entry.
Consider partial take-profits within the green reversal zone.
🔽 For Bearish Traders:
Watch for price exhaustion or a fake breakout in the reversal zone.
Potential short setups could form only if price fails to hold above the BOS zone and prints a lower high.
🔧 Technical Summary:
✅ Structure: Bullish Break of Structure confirmed
🔺 Momentum: Strong upside following volume contraction
📍 Next Key Resistance: $110,000–$110,250
📉 Major Support: $107,500–$107,800
⚠️ Caution Zone: Reversal area ahead – watch price action closely
Conclusion :
Bitcoin looks set to challenge the $110K psychological level as buyers remain in control. However, the reversal zone above is critical. A clean break and hold above it could open doors to further highs, while rejection here may trigger short-term pullbacks or range-bound conditions.
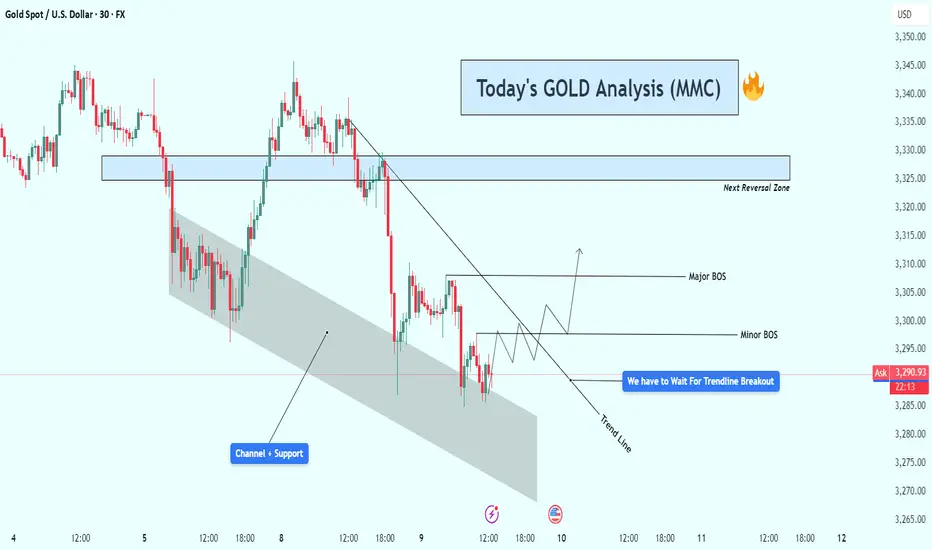
Gold (XAU/USD) Technical Analysis : Structural Analysis + TargetGold is currently trading near $3,292 on the 30-minute timeframe, showing classic signs of accumulation and compression within a well-respected descending channel. The current price action is approaching a critical decision zone, and the market is offering potential clues for both short-term and swing traders.
🔎 Detailed Breakdown of Chart Elements:
🔷 1. Descending Channel & Dynamic Support
Gold has been moving inside a falling channel, with price repeatedly reacting to both the upper and lower boundaries.
The lower boundary of the channel, currently acting as support, has been tested multiple times, suggesting a strong buying interest at this level.
This channel also aligns with the broader downtrend structure, giving sellers confidence while also creating interest for counter-trend buyers looking for reversal setups.
📐 2. Trendline Pressure and Compression
A downward sloping trendline, drawn from the recent swing highs, continues to apply bearish pressure.
Price is squeezing between the channel support and this descending trendline — a tight range compression, which often precedes a volatile breakout.
The analysis notes: “We have to wait for a trendline breakout” – this is a crucial technical signal that will determine the next move.
🚧 3. Break of Structure (BOS) Zones
Two potential bullish BOS (Break of Structure) levels have been identified:
Minor BOS (~$3,300):
A break above this level may signal short-term bullish intent and invalidate minor lower highs.
Early confirmation for buyers to enter with tight risk management.
Major BOS (~$3,310):
This is the key swing high which, if broken, would invalidate the current bearish structure and flip market sentiment bullish.
A strong bullish candle closing above this level could signal the start of a larger upward leg.
📍 4. Next Reversal Zone (Supply Area: $3,320 – $3,330)
This zone represents a strong supply area where previous price action saw heavy selling.
If bulls manage to clear the BOS zones, this area becomes the next target/resistance.
Price reaching this level could lead to a pullback, making it an ideal area for partial take-profits or reassessment of continuation trades.
📈 5. Scenario Planning & Strategy
✅ Bullish Bias (If Breakout Occurs):
Wait for a confirmed breakout above the trendline and Minor BOS with volume.
Ideal long entry would be on the retest of the trendline (now acting as support).
First target: Major BOS, then extend to the Reversal Zone.
Stop-loss can be placed below the channel support or latest swing low.
🚫 Bearish Continuation (If No Breakout):
If price fails to break above the trendline and continues to reject at resistance, sellers may look to short the retest of the trendline.
Targets can be set at the channel's lower boundary or previous lows.
Confirmation: Bearish engulfing patterns, rejection wicks, or divergence.
🧠 Technical Summary & Outlook
Gold is currently in a neutral to slightly bullish consolidation, showing early signs of demand at the bottom of the channel. The market is in "wait-and-watch" mode — traders should focus on the trendline breakout, which will serve as the trigger for directional bias.
The structure is clean, zones are well defined, and potential is high for both scalping and intraday setups. Traders are advised to stay patient and follow price action confirmation before entering trades.
📌 Key Levels to Watch:
Support Zone: $3,280 – $3,285 (Channel Base)
Trendline Resistance: ~$3,294–$3,296
Minor BOS: ~$3,300
Major BOS: ~$3,310
Reversal Zone (Supply): $3,320 – $3,330
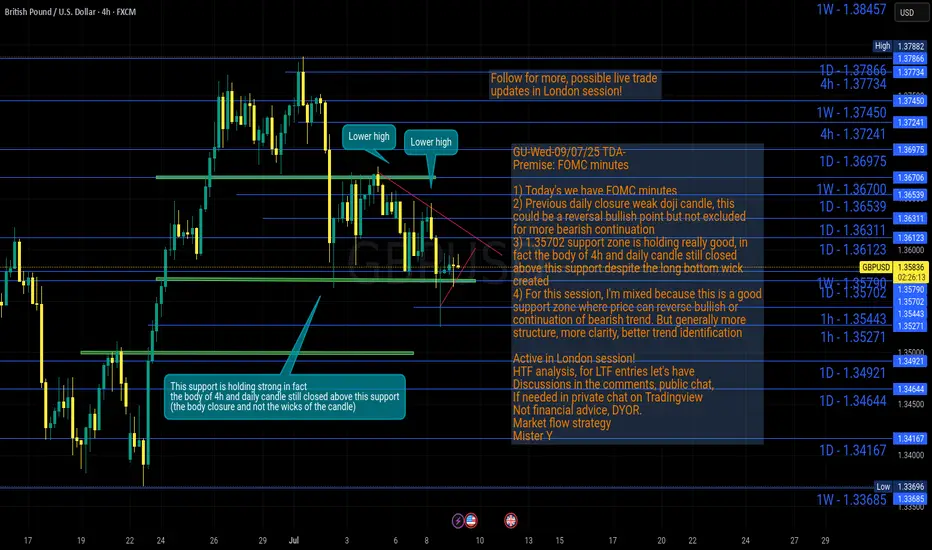
GU-Wed-09/07/25 TDA-Daily support (DS) 1.35702 is holding strongAnalysis done directly on the chart
Follow for more, possible live trades update!
I often share my live trades in Tradingview public chat in London session, stay tuned!
One of the basic concept of trading: Parts of candlestick
-The body
-The bottom wick
-The upper wick
Generally speaking, waiting for body closure above or below
certain levels gives higher probability of a certain move to
continue.
But it depends also on the timeframe you are considering:
-The 5m-15m body closure optimal for lower timeframe
-The 1h-4h body closure optimal for higher timeframe
-Etc...
These are all general considerations, in fact as a trader you
should evaluate each case based on market conditions and more.
Premise:
A simple idea plan (like Tradingview public posts) won't describe everything.
No one can predict how market will move, it's always good to react to how it moves.
It gives an idea of how price might move, but no one come from FUTURE.
So I always encourage people to openly and actively discuss in real time.
For example discussing on Tradingview public chat (and more).
I don't give signals blindly, people should learn
and understand the skill.
Following blindly signals you won't know how to
manage the trade, where precisely put sl and tp,
lot size and replicate the move over time.
That's why you need active real time discussions.
Trading is not get rich quick scheme!
Active in London session!
Not financial advice, DYOR.
Market Flow Strategy
Mister Y
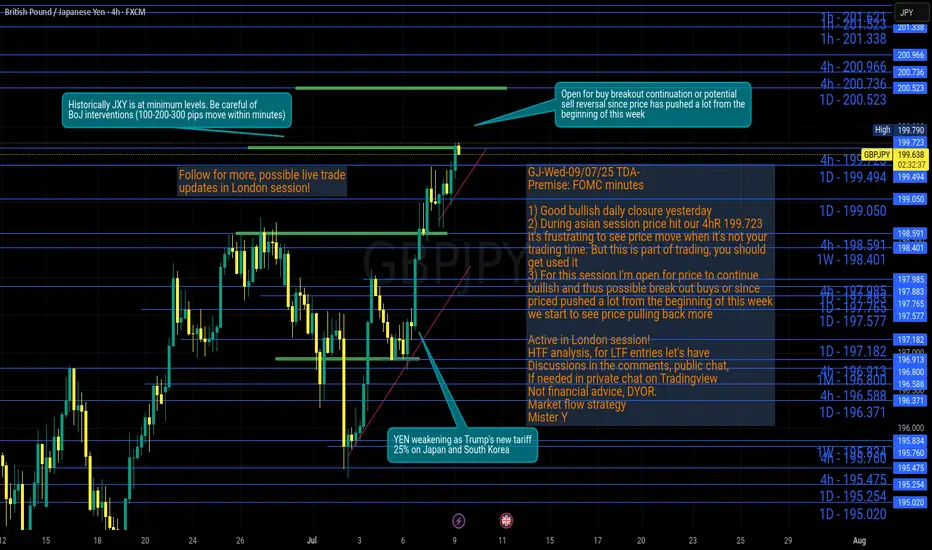
GJ-Wed-09/07/25 TDA-Asian push, price hit our 4hR 199.723Analysis done directly on the chart
Follow for more, possible live trades update!
I often share my live trades in Tradingview public chat in London session, stay tuned!
When you have a specific trading time during the day,
it's can be frustrating when moves happen outside of
your trading time. But remember this is part of the game,
we will never catch every single move on the chart.
Don't force the entries, learn to get used to it.
Premise:
A simple idea plan (like Tradingview public posts) won't describe everything.
No one can predict how market will move, it's always good to react to how it moves.
It gives an idea of how price might move, but no one come from FUTURE.
So I always encourage people to openly and actively discuss in real time.
For example discussing on Tradingview public chat (and more).
I don't give signals blindly, people should learn
and understand the skill.
Following blindly signals you won't know how to
manage the trade, where precisely put sl and tp,
lot size and replicate the move over time.
That's why you need active real time discussions.
Trading is not get rich quick scheme!
Active in London session!
Not financial advice, DYOR.
Market Flow Strategy
Mister Y
Gold (XAUUSD) – July 9 | M15 Bearish Pullback After H4 OB Tap🟡 Gold (XAUUSD) – July 9 Analysis | H4 OB Tapped, M15 Still Bearish
The market has just tapped into the H4 order block near 3280 (3288–3275) — a level we’ve been tracking closely.
However, price action shows that the H4 pullback is still active and not yet complete.
Yesterday, Gold respected the H4 supply zone (3342–3345) exactly as anticipated.
Since then, price broke below the M15 low at 3296 , confirming that bearish momentum remains valid on the lower timeframe.
🔍 Structure Breakdown
• H4: Pullback ongoing
• H4 OB: 3288–3275 (just tapped)
• M15: Broke below 3296 → Bearish trend continuation confirmed
• Current M15 State: In pullback phase
⚠️ Key Consideration:
While we are looking at bearish opportunities, keep in mind that the H4 OB (3288–3275) is a significant demand zone.
If the market begins to reclaim structure and breaks the Lower High(H4 supply zone), this could signal resumption of the H4 uptrend .
Until that happens, we remain cautiously short — but prepared to adapt.
📌 What We’re Watching
Despite the H4 OB tap, M15 remains bearish until proven otherwise.
So the focus stays on short opportunities — no longs unless structure shifts.
📍 Key M15 POI for Rejection:
→ 3322–3326 (Order Block)
→ If price pulls into this zone and gives M1 confirmation (ChoCh + micro BoS)
→ We’ll plan short setups aligned with current trend
If this zone fails, or structure flips bullish, we’ll wait patiently for a potential revisit of the H4 supply zone (3342–3345) — which remains a valid short area for high-probability setups.
🧠 Summary:
✅ H4 OB (3288–3275) tapped
❌ No bullish reversal yet — M15 still bearish
🔍 Watching 3322–3326 for possible short
📉 Bias: Bearish until structure shifts
But be flexible — if LH breaks, the game changes.
📖 Respect the structure.
The chart doesn’t reverse because you want it to —
It reverses when the market is done moving the other way.
📘 Shared by @ChartIsMirror
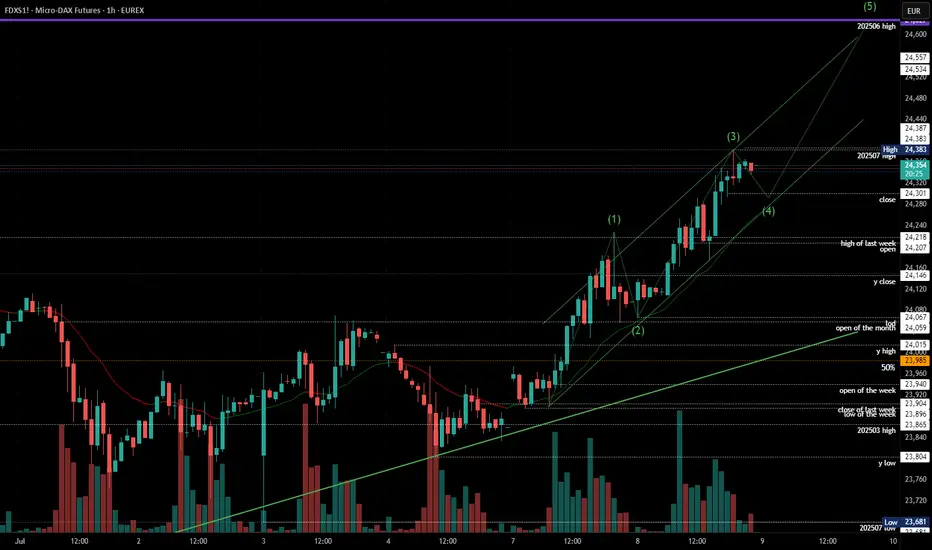
2025-07-08 - priceactiontds - daily update - daxGood Evening and I hope you are well.
comment: Not many times a month where the chart is as clear as this one. Every pattern can fail but you have to take these setups because they work more than they fail. Market is clearly refusing to go down, so don’t try to short it yet.
current market cycle: trading range - bull trend on the 1h tf
key levels: 23600 - 24700
bull case: Bulls want a retest of 24500+ and today they got a clear breakout above the prior high and stayed there. They have all the arguments on their side to test the ath. Only thing they could stop this is a news event.
Invalidation is below 23860.
bear case: Bears kinda gave up. Channel is tight and looking for shorts in these channels is not a good strategy. Above 24400 bears have to cover again since the obvious target is 24500+. Bears basically have nothing here. No matter what you think of we where should trade.
Invalidation is above 24400.
short term: Can only be bullish. Any long has stop 24170
medium-long term from 2025-06-29: Bull surprise last week but my targets for the second half of 2025 remain the same. I still expect at least 21000 to get hit again this year. As of now, bulls are favored until we drop below 23000
trade of the day: Buying any pullback was good. Most obvious one was the double bottom on EU open, right at the 1h 20ema.
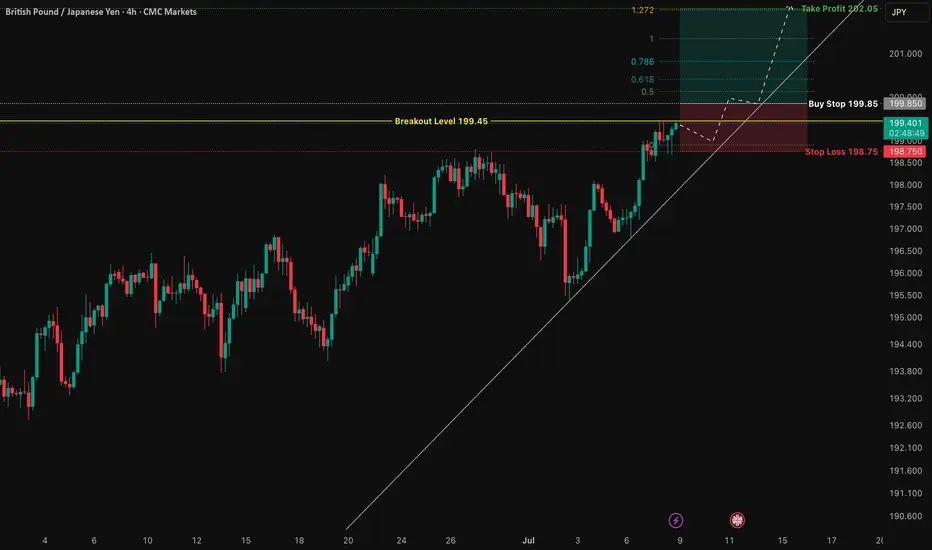
GBP/JPY: Total Confluence Targeting 202.05 BreakoutThis is a high-conviction trade setup based on a powerful confluence of fundamental drivers and multi-timeframe technical alignment. We are anticipating a bullish breakout in GBP/JPY, catalyzed by the upcoming UK GDP data release. The price action has formed a classic "coiled spring" pattern, indicating a significant buildup of energy before a potential move higher.
The analysis is based on pure price action, structure, and macroeconomics. The chart is kept intentionally clean to highlight the strength of the setup itself.
The Fundamental Why 📰
Two core data-driven factors underpin this trade:
1️⃣ Macro Policy Divergence: The primary long-term driver is the stark monetary policy difference between a relatively hawkish Bank of England (BoE), which is still fighting inflation, and an ultra-dovish Bank of Japan (BoJ). This fundamental imbalance creates a natural tailwind for GBP/JPY.
2️⃣ Positive Leading Indicators: Recent economic data from the UK has shown surprising strength. Both the Services and Manufacturing PMIs for June beat expectations, suggesting underlying resilience in the economy. This points to a higher probability of an upside surprise in Friday's GDP figures, which would be the direct catalyst for a breakout.
The Technical Picture 📊
Our confidence comes from a rare "Total Confluence," where every timeframe tells the same bullish story.
The Monthly Chart (Strategic View): Shows a powerful, multi-year uptrend that has decisively broken the critical 8-year resistance from the 2015 highs. The macro trend is undeniably bullish.
The Weekly Chart (The Confirmation): Confirms the uptrend is resuming now after breaking out of a year-long bullish continuation pattern. The "resting" phase appears to be over.
The 4-Hour Chart (The Setup): This is the "coiled spring." Price is consolidating in a very tight range right underneath the key breakout level of 199.45. This shows a lack of sellers and a buildup of buying pressure.
Fibonacci Confluence: Our take profit target is not random. It aligns perfectly with the 1.272 Trend-Based Fibonacci Extension, giving us objective, mathematical confirmation for the target at 202.05.
The Trade Plan ✅
This is a "set and forget" breakout strategy. The order should be placed as a Buy Stop to capture the momentum as it breaks higher.
📉 Asset: GBP/JPY
👉 Entry (Buy Stop): 199.85
⛔️ Stop Loss: 198.75
🎯 Take Profit: 202.05
🧠 Risk/Reward: 1:2
This analysis is for educational purposes. Always conduct your own research and manage your risk appropriately. Good luck.
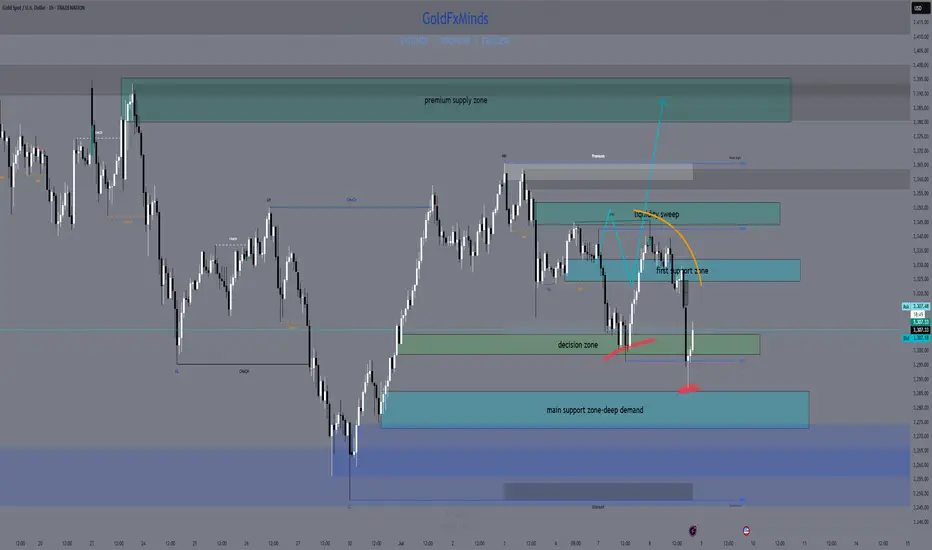
XAUUSD NY SESSION FLOW – JULY 8→ 9 , 2025"Structure doesn’t lie. Price answered exactly where we expected it to."
Hey traders 👋
Let’s set the record straight after today’s precision bounce. We saw textbook price action across all sessions — Asia triggered the short from our 3344–3351 HTF supply, and both London and New York followed through with no hesitation, driving price down to 3287.
But here’s the key point:
🧨 3287 was just 10 pips above our clean 3286–3280 buy zone.
No mitigation. Just a front-run.
That’s what real liquidity does — grabs what it needs before the crowd gets in. Our zone is still valid… just untouched.
🔍 HTF BIAS & STRUCTURE UPDATE
📆 Daily Bias:
Structure is still bearish — lower highs, CHoCH, and soft RSI.
EMAs 5/21 are flat. No power for bulls unless 3351 breaks.
⏰ H4 Bias:
New lower high confirmed after rejection from our 3344–3351 zone.
Trend is still bearish unless we reclaim 3330+ with conviction.
Liquidity is driving movement, not news.
🕐 H1 Flow:
Bounce from 3287 = engineered reaction before real demand
Price now hovering above 3306, forming mid-structure
No trade in the middle. Let’s work the edges.
🎯 TODAY’S SNIPER ZONES
🔻 SELL ZONES
1. 3325–3330
Nearest short trap. OB + inefficiency + H1 rejection base.
If price returns, watch M15/M30 for CHoCH or BOS → entry.
2. 3344–3351
Our major HTF supply. Asia already reacted from top half.
If revisited, this zone remains the high-probability rejection zone.
3. 3380–3394
Premium OB + imbalance pocket.
Untouched zone far above — if tapped late in the week, watch for liquidity sweep → clean reversal potential.
🟢 BUY ZONES
1. 3297–3300
NY session bounce zone. Price tapped 3297 → pushed to 3306.
Still live for intraday reentry if price retests and confirms with BOS.
2. 3286–3280
Our true demand base. Price front-ran it by 10 pips — didn’t mitigate.
Still valid, still reactive. Don’t delete this zone.
3. 3263–3255
Last line of support. Deep zone — only comes into play if 3280 fails with conviction.
✅ EXECUTION REMINDERS
Price is hovering mid-range → don’t force entries
Only act if structure reacts at the edges (3325 or 3286)
3380–3394 may be a late-week trap if bulls get overconfident
📌 If this breakdown helped, hit 🚀 and drop a comment:
👉 Are you stalking 3325… or waiting for 3286 to finally wake up?
Let structure talk. You just execute.
GoldFxMinds 💭🔥
📢 Disclosure:
This analysis is based on the Trade Nation TradingView feed. I’m part of their Influencer Program and receive a monthly fee.
⚠️ Educational content only — not financial advice.
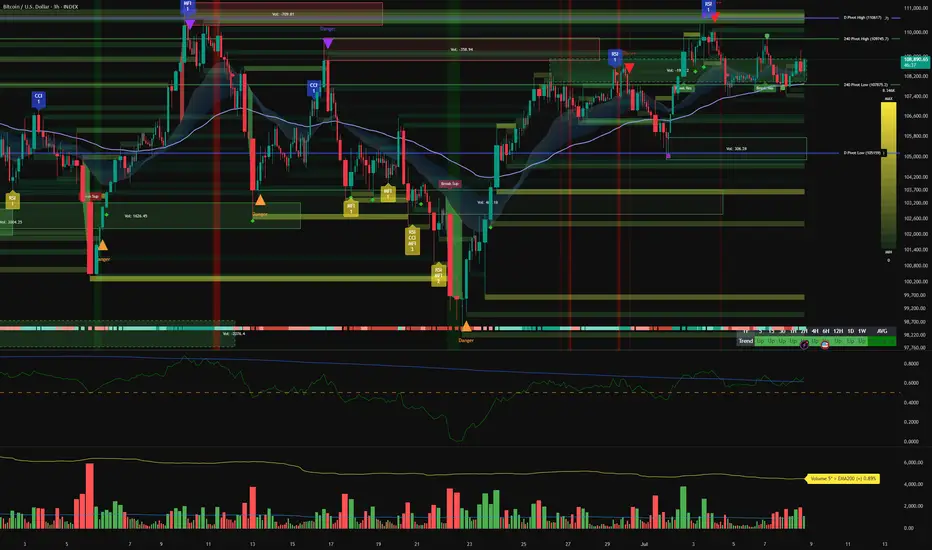
Bitcoin bullish Bias Consolidated: Robust Supports, Eyeing 11194__________________________________________________________________________________
Technical Overview – Summary Points
__________________________________________________________________________________
Momentum : Strong bullish consensus across all timeframes, confirmed by the Risk On / Risk Off Indicator (STRONG BUY).
Key Supports : 107761 (240min Pivot), 105054.7 (D Pivot Low, swing invalidation zone), 102019.9 (240min Pivot), 74485 (W Pivot Low, macro invalidation).
Key Resistances : 109676.5 – 110630.1 (240min & 1D cluster), 111949 (W Pivot High).
Volume : Normal to very high, no selling climax detected.
Multi-TF Behaviours : No behavioral excess indicated by ISPD DIV, healthy market structure.
__________________________________________________________________________________
Strategic Summary
__________________________________________________________________________________
Overall Bias : Confirmed bullish. Any pullback towards 107761/105054.7 = buy-the-dip opportunity.
Risk Zones : Below 105054.7 = multi-TF invalidation, risk of bearish acceleration to 102019.9.
Macro Catalysts : Focus on FOMC (29–30/07). Until then, controlled volatility, bullish bias sustained.
Action Plan : Buy on support, partial profit near 110630–111949 cluster. Reduce exposure/partial exit before FOMC.
__________________________________________________________________________________
Multi-Timeframe Analysis
__________________________________________________________________________________
Daily (1D) : Steady bullish momentum, resistances at 110630–111949 being watched.
12H – 6H – 4H – 2H : Bias remains strong, intermediate supports defended (107761). No behavioral or breakout alerts.
1H – 30min : Continued bullish dominance, increased volatility and volume but no distribution signs.
15min : Local technical correction, no key pivot broken. Overall trend still absorbed by buyers.
Risk On / Risk Off Indicator : Strong Buy signal (slight neutral on 15min).
Summary : Bullish confirmation across all timeframes. Only a break below 107761 would weaken the setup.
__________________________________________________________________________________
Strategic Synthesis – Recommended Actions
__________________________________________________________________________________
• Remain net long while 105054.7 holds.
• Buy zone: retest at 107761/105054.7.
• Take profits gradually below 110630/111949; manage risk if key support breaks.
• Only major macro shocks or break of 105054.7 invalidate current plan.
• Solid on-chain positioning, no major capitulation risk detected.
__________________________________________________________________________________
Macro Calendar Watchlist
• 08/07/2025: RBA & RBNZ rate decisions (limited BTC impact)
• 29–30/07: FOMC (US Fed, key BTC/risk catalyst)
• Anticipate rising volatility ahead of FOMC. Monitor volume, possible institutional profit-taking.
__________________________________________________________________________________
On-Chain & Institutional Flow Analysis
Majority of investors in profit, holding dominates, new ATH for long-term holders.
Robust ETF/institutional flows.
No liquidity stress or stablecoin squeeze seen.
__________________________________________________________________________________
Conclusion
Market structure remains bullish and sound. Setup: buy on pullback, take profit under resistance, monitor macro events (esp. FOMC). Plan only invalidated by break below 105054.7 or negative macro catalyst.
__________________________________________________________________________________
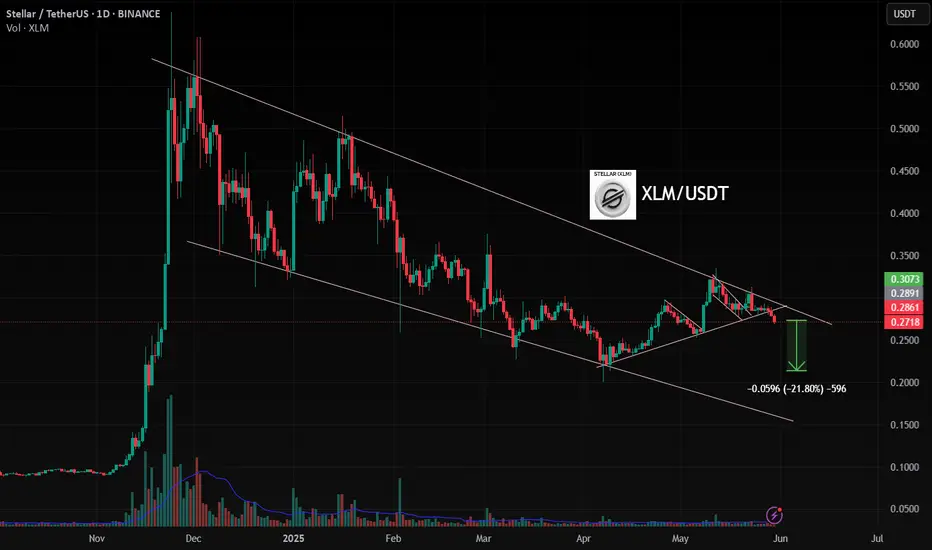
XLM ,1DAs BTC is Falling And BTC is given Breakout of Pattern in 4Hr , then Remaining coins will also fall drastically .
in 1D pattern of XLMUSDT , it is Breaking Down as BTC is also given Break Down of Pattern
Follow for More Ideas like This
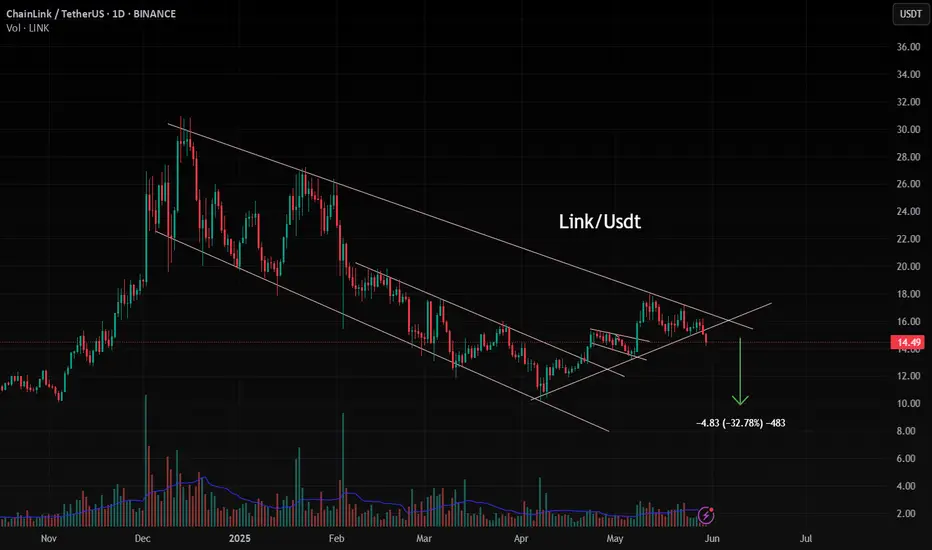
Link, 1DAs BTC is Falling And BTC is given Breakout of Pattern in 4Hr , then Remaining coins will also fall drastically .
in 1D pattern of ADA USDT , it is Breaking Down as BTC is also given Break Down of Pattern
Follow for More Ideas like This
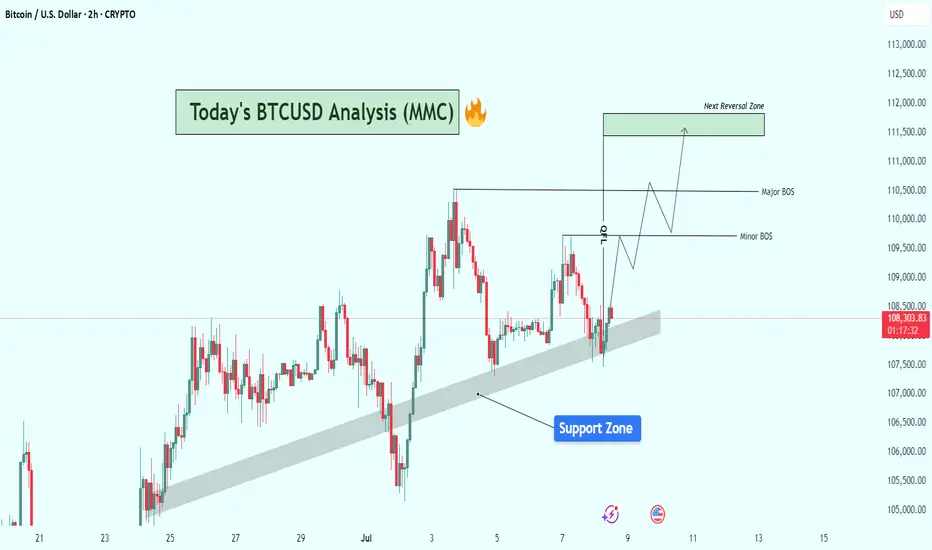
BTCUSD Structure Analysis : Bullish Zone From Support + Target🔍 Current Market Structure Overview:
Bitcoin is currently trading around $108,375, hovering just above a clearly respected rising support zone (shaded area). This dynamic support has held price multiple times and continues to act as a springboard for short-term bullish moves.
The chart illustrates a classic bullish continuation setup forming, with key structural levels marked as Minor BOS (Break of Structure) and Major BOS, indicating potential areas of trend validation and momentum acceleration.
🔹 Key Technical Elements:
✅ Support Zone:
The shaded diagonal support zone has acted as a bullish trendline base, holding up since late June.
BTC recently dipped into this area, found buyers, and is now attempting a reversal from this level.
This reinforces market interest and confirms the accumulation behavior in this zone.
⚠️ Break of Structure (BOS) Levels:
Minor BOS is marked near $109,800, signaling the first key intraday resistance.
A break above this level would signal bullish intent and open the way for price expansion.
Major BOS around $110,600–$110,800 is critical. A clean break here will likely validate a trend continuation toward the next objective.
🟩 Next Reversal Zone (Target Area):
Highlighted around $111,500–$112,000, this green zone represents a potential liquidity grab/reversal area where sellers could re-enter.
This zone aligns with previous price exhaustion levels and may trigger consolidation or a short-term pullback.
📈 Projected Price Path (Wave Schematic):
The chart outlines a wave structure projection, suggesting:
A possible retest of the minor BOS.
Follow-through into the major BOS area.
Final push into the reversal zone before potential rejection or sideways action.
🔧 Bias & Strategy:
Bias: Moderately Bullish as long as BTC respects the support zone.
Invalidation: A decisive breakdown below the trendline support and close under $107,500 would invalidate this bullish setup and shift bias to neutral/bearish short-term.
Trading Plan Ideas:
📥 Buy Opportunity: On minor dips within the support zone, targeting BOS levels.
📤 Sell Watch: Near reversal zone ($111.5K–$112K) if signs of exhaustion or bearish divergence appear.
📌 Final Notes:
BTC appears to be gearing up for a breakout from consolidation, and price action is coiling with higher lows. Market participants should watch closely how BTC reacts at the minor and major BOS zones, as they could define the next leg for either bullish continuation or rejection.
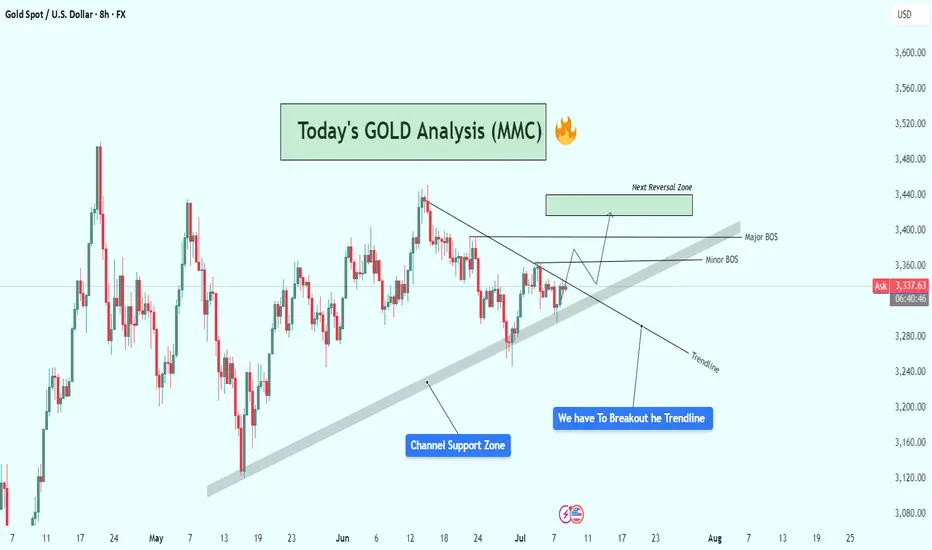
Gold (XAU/USD) Structure Analysis : Trendline Break + TargetGold is trading around $3,338, positioned at a decisive point where both bullish momentum and bearish pressure are converging. The price action over the past few weeks suggests a brewing breakout, supported by multiple technical factors. This analysis provides a complete breakdown of what’s happening and what to anticipate next based on the current structure.
🔹 Market Structure & Context
Since mid-May, XAU/USD has been trading within a rising price channel, respecting a well-defined ascending trendline support. This rising support zone has provided a floor for buyers to step in, especially during pullbacks, which demonstrates consistent buying interest and underlying bullish sentiment.
At the same time, gold has also been respecting a descending trendline resistance formed by multiple lower highs. This forms a squeeze pattern, suggesting that the market is building energy for a breakout. As price compresses within this wedge-like structure, the tension between bulls and bears grows, setting the stage for a sharp directional move.
This is a classic accumulation vs. compression scenario, where the outcome of the breakout will dictate short-to-medium-term direction.
🔹 Channel Support Zone – Buyer’s Stronghold
The channel support zone is critical here. This area, visible as a bold upward sloping line, has provided reliable support through repeated market cycles. It acts as a dynamic line where institutions and swing traders accumulate long positions during dips. The fact that price has respected this trendline for over a month signals the importance of this structure in current market psychology.
Any break below this zone would invalidate the bullish bias and open the door for a steeper decline. However, as long as price stays above this line, the buyers retain control.
🔹 Trendline Resistance – Key Barrier to Break
The descending trendline resistance, drawn from mid-June highs, has been a significant cap on upward moves. Each test of this trendline has resulted in a rejection, pushing price back into the range. Now, gold is testing this level again — and this time, the setup is stronger for a potential breakout due to growing momentum and multiple rejections weakening the resistance.
From a technical standpoint, the more a resistance level is tested, the weaker it becomes, and the higher the probability of a breakout.
🔹 Break of Structure (BOS) Zones – Momentum Confirmation
The chart marks both Minor BOS and Major BOS zones. These are crucial areas to watch for price confirmation.
The Minor BOS, just above the current price (around $3,360), represents a short-term structural shift. A clean break above this with strong candles and volume could trigger a momentum rally.
The Major BOS, located in the $3,400–$3,420 area, is more significant. This is the last major swing high. If gold manages to break and hold above this zone, it would confirm a complete bullish reversal in market structure — turning what was once a lower-high pattern into a potential new uptrend.
These BOS levels act as validation checkpoints for trend direction. Without a clean break, the move is unconfirmed and prone to reversal.
🔹 Next Reversal Zone – Anticipated Reaction Area
Above the BOS zones lies the Next Reversal Zone, marked in green. This is a potential area of resistance or profit-taking, based on historical price reactions, Fibonacci confluence, and psychological levels. This area spans approximately $3,420 to $3,440, which is where price might pause, consolidate, or reverse depending on momentum.
This zone doesn’t necessarily mean price will reverse immediately, but it’s a smart area for traders to monitor reactions or start managing their risk.
🔹 Price Action Flow – What Could Happen Next?
Currently, gold is testing both the trendline and the minor BOS, building momentum around this critical zone. There are two primary paths forward:
If gold breaks the descending trendline and confirms above the minor BOS:
Expect a move toward the major BOS at $3,400.
A successful break of this zone opens the path to the next reversal zone ($3,420–$3,440).
Bulls gain clear control and the market may attempt a sustained breakout continuation.
If gold gets rejected again at the trendline:
Price could drop back toward the channel support, between $3,280 and $3,250.
This would maintain the current consolidation range, with further testing likely before a breakout.
Bears may gain temporary control, but only a break below the ascending channel would signal a trend shift to the downside.
🔹 Why This Setup Matters
This chart captures a textbook breakout setup — compression at a trendline, rising channel support, and BOS zones layered in. These kinds of technical setups often precede strong moves because:
Volume typically increases after breakout zones are breached.
Market participants are watching the same structure, making reactions more predictable.
Risk-to-reward becomes favorable with tight invalidation points.
For disciplined traders, this is a high-probability environment to wait for confirmation and trade the reaction, not the anticipation.
🔹 Risk Management Reminder
It’s essential not to chase breakouts prematurely. Look for:
Strong bullish candles breaking key resistance.
Retests of broken trendlines turning into support.
Volume confirmation (spikes can signal genuine breakout vs. fakeout).
Also, be prepared for false breakouts, especially during overlapping macroeconomic events or low liquidity sessions.
🧭 Final Thoughts
This is a powerful confluence zone for gold, and whichever side breaks it will likely control the next leg. Whether you're a day trader or a swing trader, this is a must-watch area on your chart.
Stay alert, trade with confirmation, and respect your risk parameters.
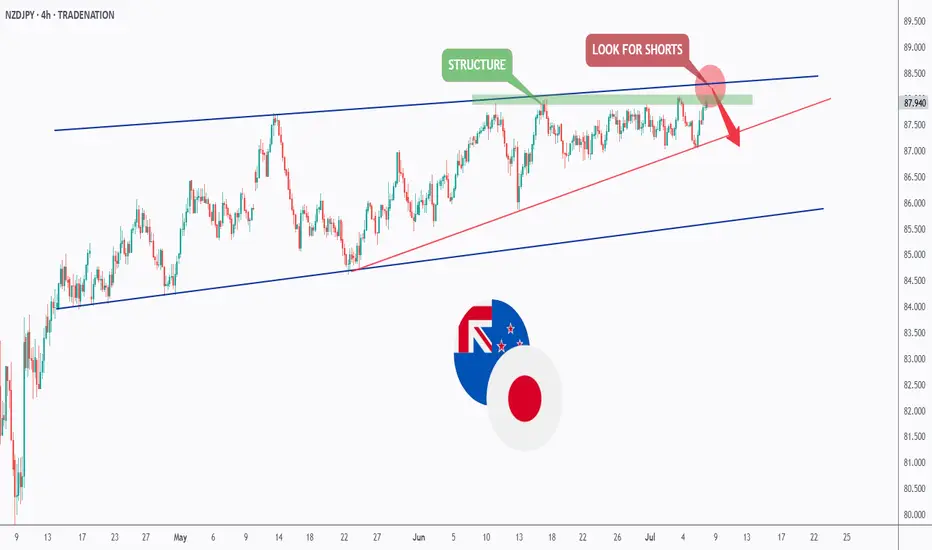
NZDJPY - bulls are exhausted! Hello TradingView Family / Fellow Traders. This is Richard, also known as theSignalyst.
📈NZDJPY has been overall bullish trading within the rising flat channel marked in blue and it is currently retesting the upper bound of it.
Moreover, the green zone is a strong structure.
🏹 Thus, the highlighted red circle is a strong area to look for sell setups as it is the intersection of the upper blue trendline and green structure.
📚 As per my trading style:
As #NZDJPY is hovering around the red circle zone, I will be looking for bearish reversal setups (like a double top pattern, trendline break , and so on...)
📚 Always follow your trading plan regarding entry, risk management, and trade management.
Good luck!
All Strategies Are Good; If Managed Properly!
~Rich
Disclosure: I am part of Trade Nation's Influencer program and receive a monthly fee for using their TradingView charts in my analysis.
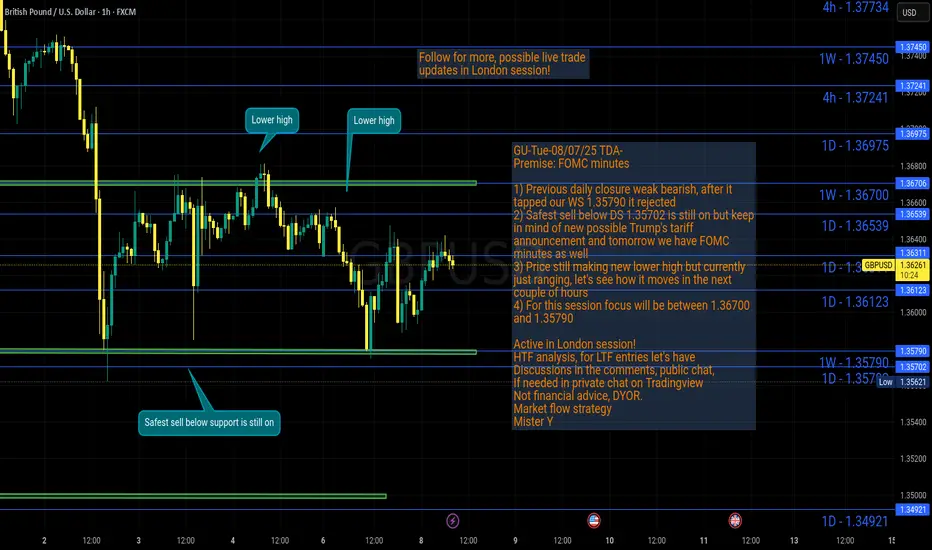
GU-Tue-08/07/25 TDA-GU stagnant ahead of tomorrow's FOMC minutesAnalysis done directly on the chart
Follow for more, possible live trades update!
I often share my live trades in Tradingview public chat in London session, stay tuned!
Green flags, Red flags when you follow someone in trading:
Red flags:
-Always and only share winning trades
-No track records
-A lot of marketing campaign, offering paid courses and more but
with no proof of real trading skills
(I'm not against paid course etc... Just to keep in mind)
-Just sharing buy or sell but without explaining the confluences,
the setups, the reasons, the lot size, how risk manage the trade...
-Simply don't even know where to put sl and tp in advance
Green flags:
-Do live streaming in real time
-Keeping transparent about trade setups, ideas,
about wins and losses
-Share live track record of an account
These are just some signs (could be more green and red flag signs),
and should not be used as effective methods.
If you have more of green flags or red flags ideas, comment down below!
Premise:
A simple idea plan (like Tradingview public posts) won't describe everything.
No one can predict how market will move, it's always good to react to how it moves.
It gives an idea of how price might move, but no one come from FUTURE.
So I always encourage people to openly and actively discuss in real time.
For example discussing on Tradingview public chat (and more).
I don't give signals blindly, people should learn
and understand the skill.
Following blindly signals you won't know how to
manage the trade, where precisely put sl and tp,
lot size and replicate the move over time.
That's why you need active real time discussions.
Trading is not get rich quick scheme!
Active in London session!
Not financial advice, DYOR.
Market Flow Strategy
Mister Y