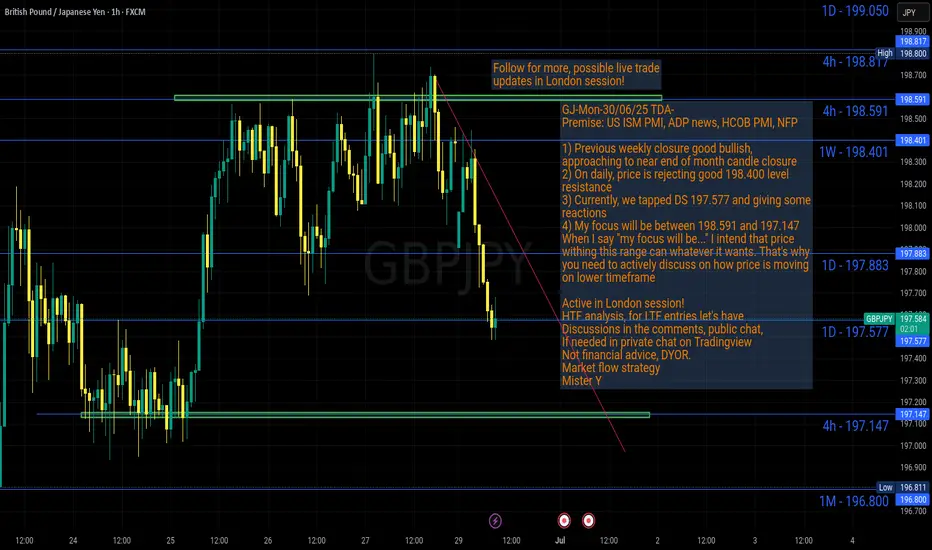
GJ-Mon-30/06/25 TDA-Near end of month candle closureAnalysis done directly on the chart
Follow for more, possible live trades update!
I often share my live trades in Tradingview public chat in London session, stay tuned!
Random daily reminder:
Keep pushing forward, learn, make mistake, improve.
Have patience, you are getting there day by day.
-How would you see yourself in 3 years?
-Are you willing to take sacrifices in order to
create for yourself opportunity to live the life you want to?
Journal down consistently, so you keep track of your progress
and see how far you have come.
Don't underestimate the power of little compounds over time.
Active in London session!
Not financial advice, DYOR.
Market Flow Strategy
Mister Y
Priceaction
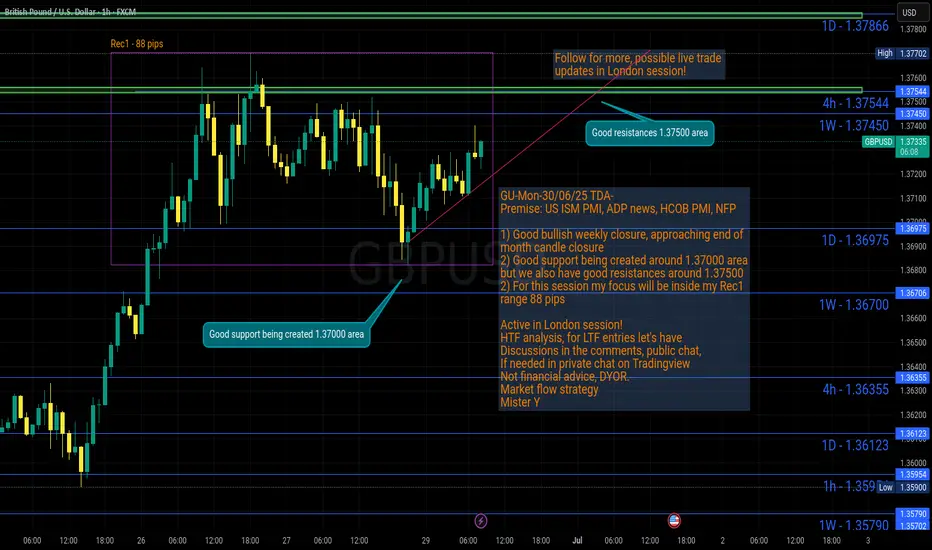
GU-Mon-30/06/25 TDA-Good support 1.37000&Good resistance 1.37500Analysis done directly on the chart
Follow for more, possible live trades update!
I often share my live trades in Tradingview public chat in London session, stay tuned!
The reality of life is that if you don't work for yourself,
you'll never achieve what you want.
Don't expect things to come, work for it, act on it.
Notice the difference between DOers and Dreamers.
Comment down below what do you think!
Active in London session!
Not financial advice, DYOR.
Market Flow Strategy
Mister Y
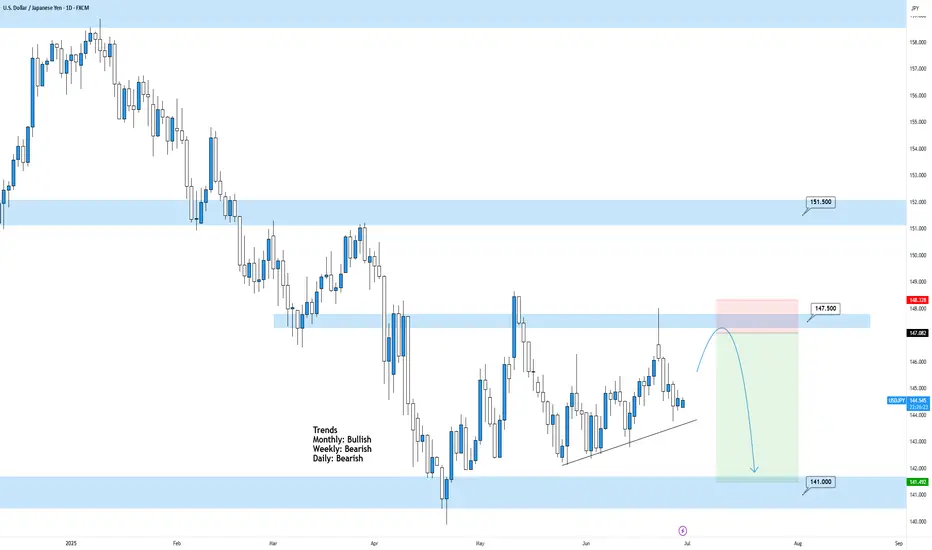
USDJPY Daily TF - June 29th, 2025USDJPY Daily Neutral Idea
Monthly - Bullish
Weekly - Bearish
Daily - Bearish
I’m looking at the Daily time frame here as this is the only clear picture for price action in terms of trends. The 4hour looks like price action can’t make a decision so we will wait for price action to get closer to some major zones.
Bearish Continuation - Ideally, we want to see price action touch 147.500 again followed by convincing bearish rejection. Look to target lower toward major support levels if this happens.
Aside from this potential setup we don’t have much to look at here on UJ.
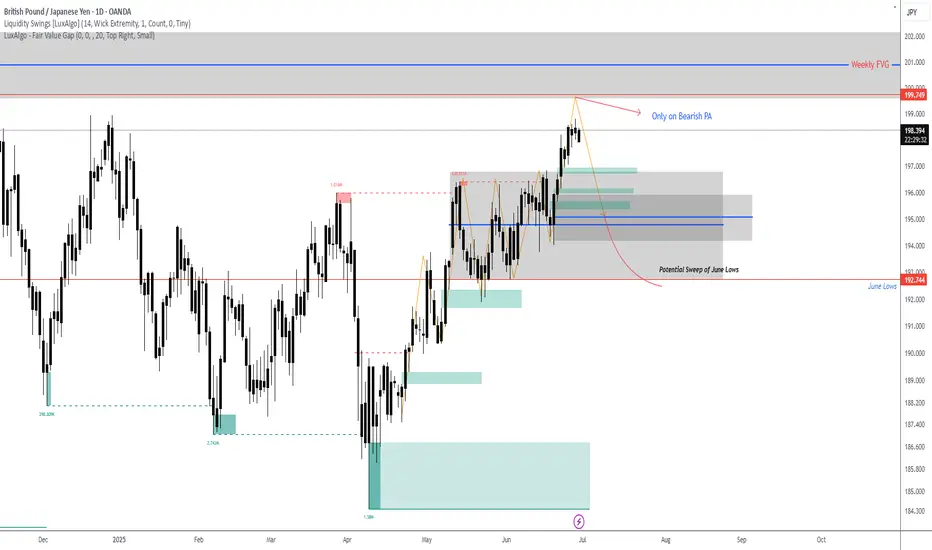
GBPJPY ForecastLooking long up to 200.00 levels then seeking bearish PA to test the June lows. This is only validated on bearish PA on H4 or Daily.
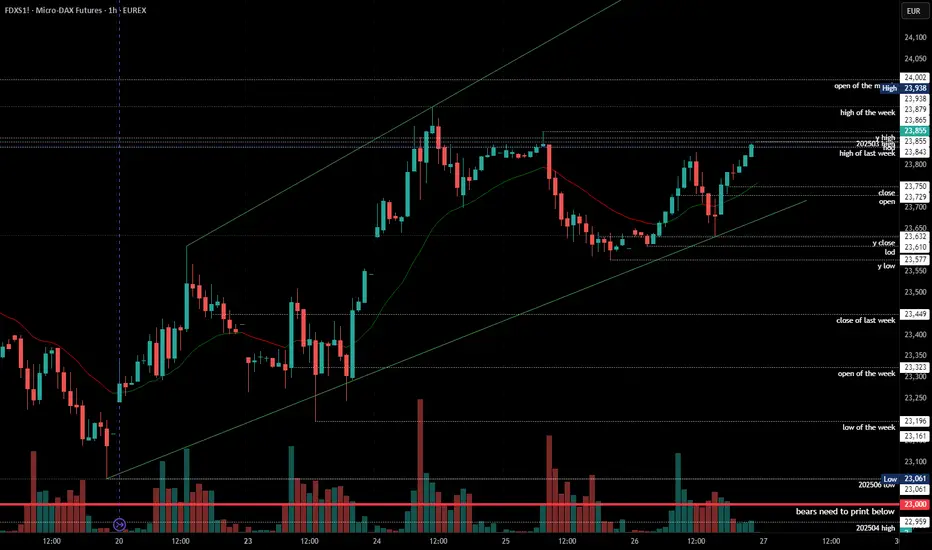
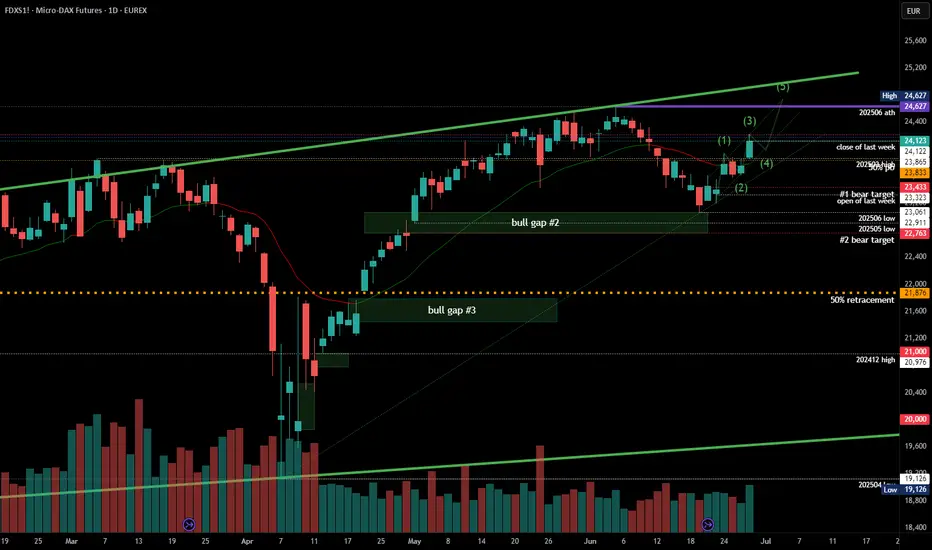
#202526 - priceactiontds - weekly update - daxGood Evening and I hope you are well.
comment: Monday was neutral and the warning to bears that the markets do not care about the risk at hand. Tuesday’s gap up then was the sign of bull strength and defending the Globex gap was the sure sign we are going higher. Thursday was the bears giving up and since we have a measured move target up to 24700. I have drawn my 5-wave thesis on the chart, which I think is currently the most likely outcome. All depends if the US markets continue the squeeze as well. There is always the possibility that Friday marked the highs but that is very low and in the absence of bear bars, we can only assume higher prices.
current market cycle: trading range
key levels for next week: 23500 - 25000
bull case: Bulls made the bears give up on Thursday and since we have been going only up. The obvious next targets are 24500 and then 25000. As of now, there is absolutely no reason to assume we reverse from here and print lower lows again. Bulls took over control of the market again and we have two clear legs up, with a third one we may do a new ath but as always, every pattern can fail.
Invalidation is below 23500
bear case: Not much. A pullback is expected but so is the third leg up for W5 and everything below 23500 would be a huge bear surprise and cut this short. As of now I don’t think this chart can lead you to looking for shorts. We would need a break of two bull trend lines and prices below 23500 before you should think bearish again.
Invalidation is above 24400
short term: Bearish was the obvious read last weekend and when bears failed on Monday, it set the stage for an explosive move to the upside. That can always happen since we are in a profession where you play odds.
medium-long term from 2025-06-29: Bull surprise last week but my targets for the second half of 2025 remain the same. I still expect at least 21000 to get hit again this year. As of now, bulls are favored until we drop below 23000
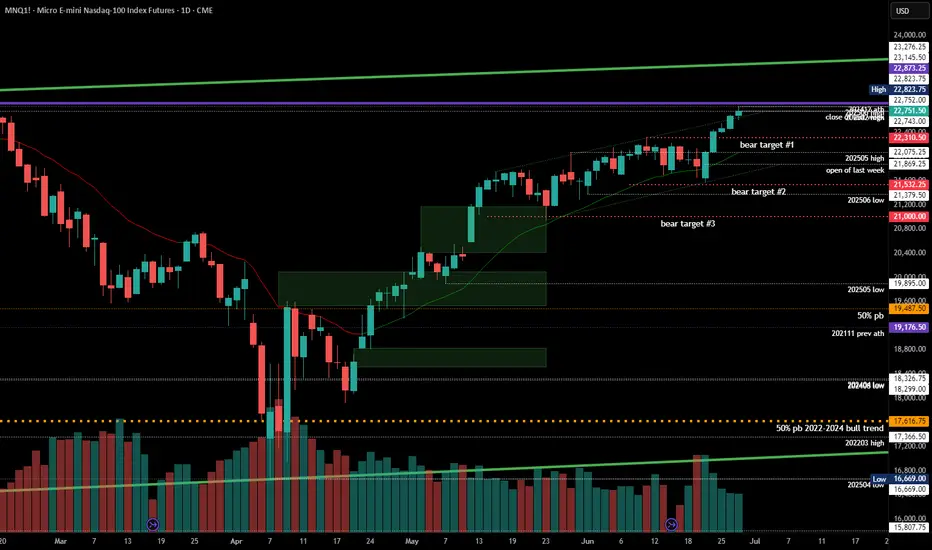
#202526 - priceactiontds - weekly update - nasdaqGood Evening and I hope you are well.
comment: Similar to dax and for most other markets. Cash index made a new ath and broke strongly above the trading range. This is W5 which I thought was cut short but I guess not. It’s most likely the end of the trend since the trading range went on for about 6 weeks, which in this case was likely the final flag. Futures could now aim to print 23000 and touch the bull trend line which began in 2021 and went though the ath from 2024-12.
current market cycle: resumption of the bull trend but likely the final flag and we most likely will top out here around/under 23000
key levels for next week: 22000 - 23000
bull case: Bulls printed 5 consecutive bull bars. They are in full control and could pump it to 23000. Purely based on momentum and squeezing shorts. Got nothing else for the bulls.
Invalidation is below 21500
bear case: Bears gave up on Monday and I doubt they want to fight this until we hit the bull trend line or 23000. Most bears will wait for a clear topping sign that bulls are beginning to take bigger profits before they think about shorts. As of now, bears have zero arguments on their side. Only a daily close below 22300 would confirm this bull trap and fake breakout above the bull channel and then we could test down to 21900ish but for now I think it’s most likely we go higher.
Invalidation is above 23100
short term: Neutral. Will only scalp longs on huge momentum and I will only start thinking about shorts once we break below 22300 again.
medium-long term - Update from 2024-06-29: No change in plans. I expect 20000 to get hit over the next 3 months and maybe 19000 again.
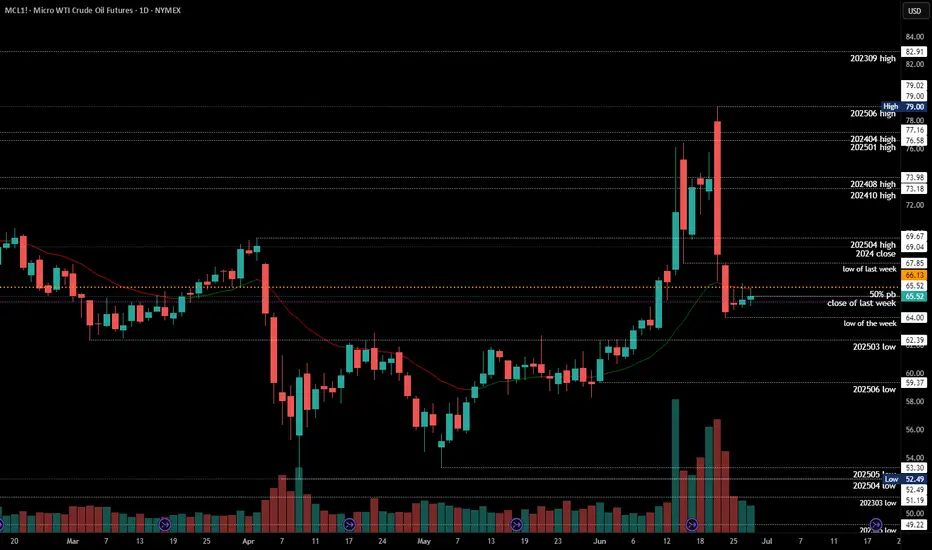
#202526 - priceactiontds - weekly update - wti crude oil futuresGood Day and I hope you are well.
#mcl1 - wti crude oil futures
comment: Yeah I don’t know about this one. Your guess is as good as mine. I could even see this touching 63 before going higher again. Most erratic and extreme price action the past 2 weeks, so maybe wait a bit before jumping the train here.
current market cycle: trading range
key levels: 63 - 80
bull case: Bulls don’t have much. They could not close one decent bar at the high since 2025-06-11 and despite all the bull spikes, we only sold afterwards and are back below 65 where the extreme breakout happened. Best guess here is that we stay above 63 and go sideways. Sideways up to where? No idea. Could be 68, could be 70.
Invalidation is below 63
bear case: Too extreme. Both sides have to take quick profits or the next spike will take them away again. So most likely sideways in a range until a newsbomb hit again. Range could be 63 - 68.
Invalidation is above 79
short term: Neutral. Not touching this unless someone threatens me with a gun.
medium-long term - Update from 2025-06-22: Let’s leave this as “todo” for now. No read on this and I won’t make stuff up just to post something.
#202526 - priceactiontds - weekly update - bitcoinGood Day and I hope you are well.
#btcusd - bitcoin
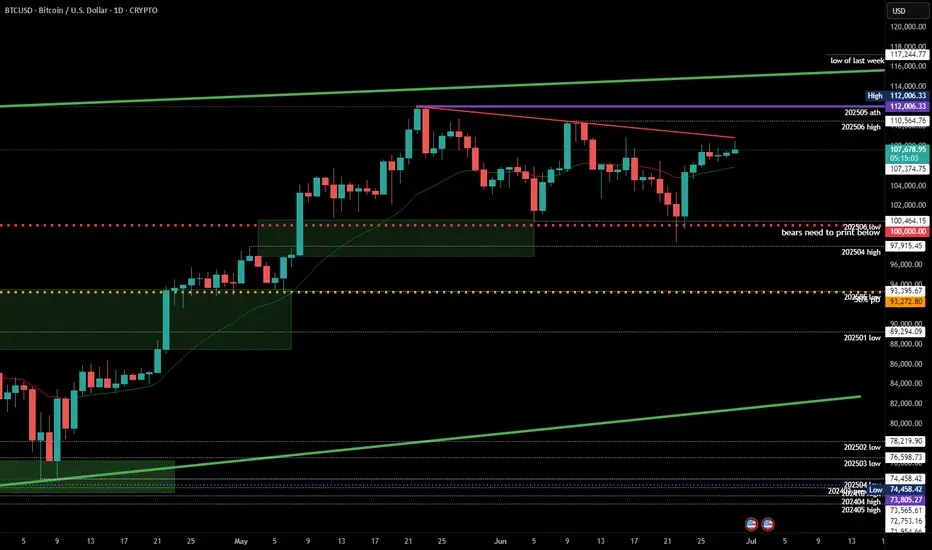
comment: Neutral since bears fumbled it again. Range is clear, don’t have much else to say about this. Bulls want 113k+ and bears need a strong daily close below 100k for more downside.
current market cycle: trading range
key levels: 100k - 115k
bull case: Bulls are still hopeful, that’s why we are still above 110k but the next touch could break it and I doubt many will hold long or scale into new ones there. Best bulls can get right now is to go sideways for longer and stay above 100k. I mean… Staying above 100k is as bullish as it get’s if you be honest. Same as last week since nothing has changed for the bulls. Trading range since mid May.
Invalidation is a strong daily close below 100k
bear case: Bears fumbled it again. Strong daily close below 100k or we won’t go lower. Right now odds favor the bears to go down from 107k to 100k but need more selling pressure.
Invalidation is above 110k
short term: As neutral as can be.
medium-long term - Update from 2025-06-29: Strong daily close below 100k will be the confirmation for more downside. First target below 100k is 97k the breakout retest and after that is the 50% retracement around 93k. I have no bullish for the next weeks/months. Once the gap to 97k closes we are likely in a bear trend again and I expect to hit at least 85k over the summer.
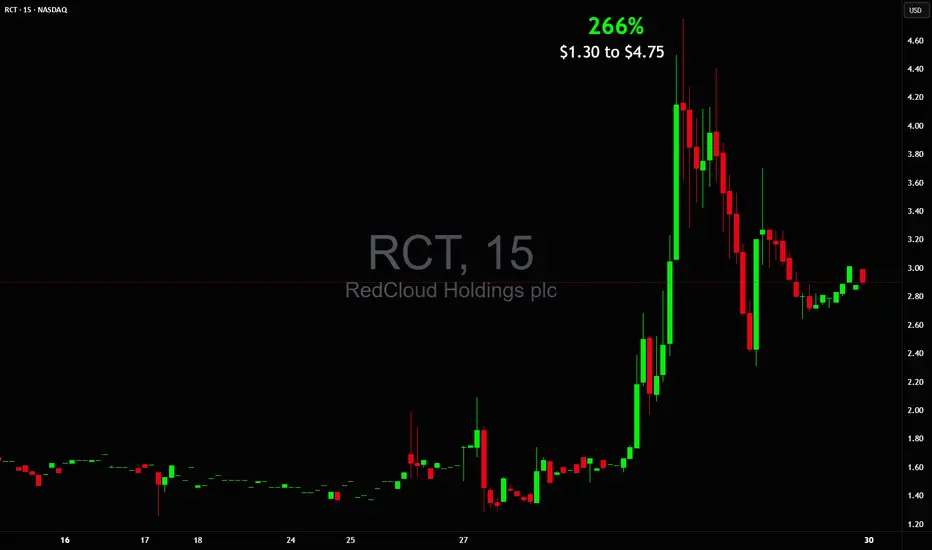
+266% in ONE DAY from $1.30 to $4.75 $RCT🔥 +266% in ONE DAY from $1.30 to $4.76 🚀
Spotted the setup early, but my official safety criteria checklist wasn't all green due to price action until later when it was too late NASDAQ:RCT
Sometimes discipline keeps you out early on even when the move goes wild
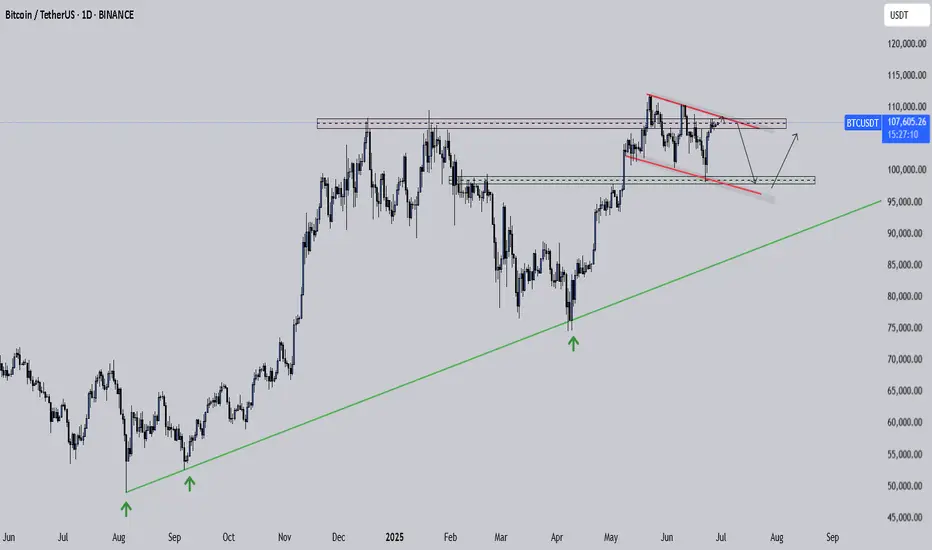
Bitcoin Pressing Up But This Compression Could Crack LowerBitcoin has been steadily climbing for months, respecting that long-term trendline since last year. Each dip into it brought a strong bounce, showing bulls are still in control of the bigger picture.
But right now price is pressing into a tight descending resistance line. We can see it making lower highs while struggling to break above that red trendline. At the same time, it’s sitting just above a key horizontal range, where buyers stepped in before.
This compression is risky . If BTC fails to push above the descending resistance and breaks back below the box, it could drop toward the next demand zone around the low 100K region .
As long as the major trendline from last year holds, the broader uptrend is intact . But losing this structure would open the door for a deeper correction.
This is the kind of spot where patience pays. Let the breakout or breakdown show its hand before jumping in heavy.
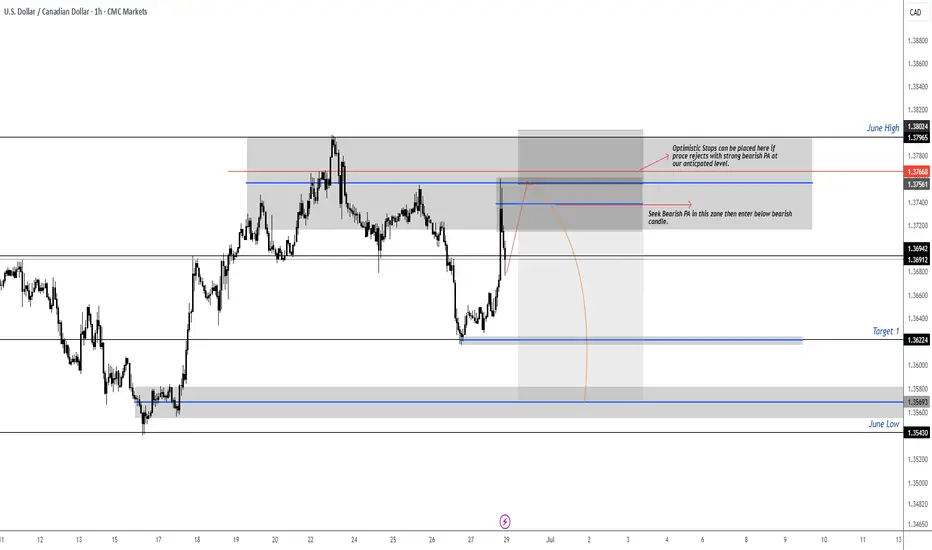
USDCAD RT of Supply Zone then ShortPrice has retraced back into a key supply zone just under the June High. We are now watching for strong bearish price action (PA) to confirm a potential short entry from this area.
Key Zone to Watch:
Supply Zone: 1.3756 – 1.3796
Optimistic stops can be placed above the zone if strong rejection occurs
Plan:
Seek bearish PA within the highlighted supply zone
Wait for confirmation via a bearish candle close
Enter below the trigger candle once setup forms
Targets:
Target 1: 1.3622
Extended Target / June Low: 1.3543
If no rejection occurs and price breaks above the zone with conviction, the setup becomes invalid and we reassess.
Execution will be reactive, not predictive — we trade confirmation, not speculation.
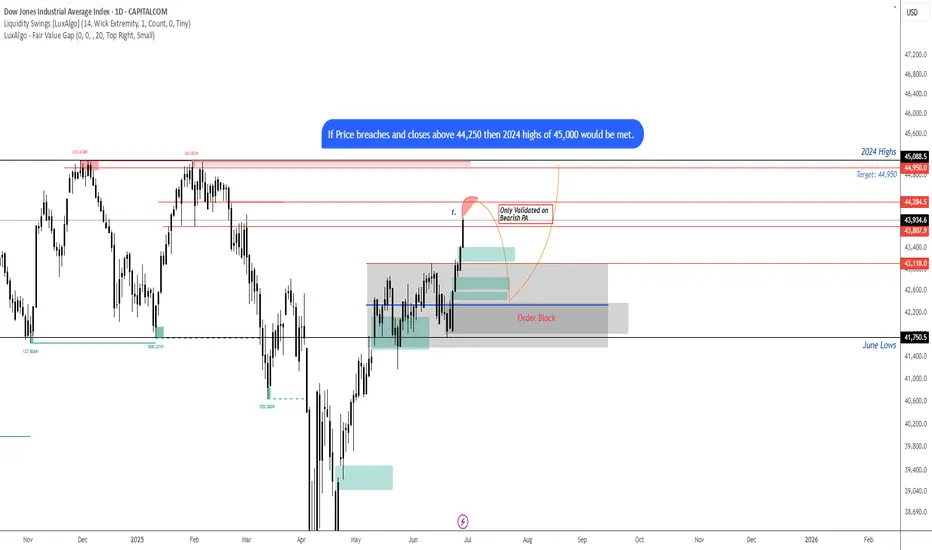
US30 looking for the short on Bearish PAI believe we can expect a pull back down to JuBias: Short-term Bearish (Contingent Setup)
Context: Price is currently trading just below a high-probability supply zone between 44,048 – 44,277. This area aligns with prior highs and liquidity, making it a prime zone to look for a short-term rejection if strong bearish price action (PA) appears on the 4H or Daily timeframes.
We are currently seeing strong bullish momentum on the Weekly, Daily, and H4 candles. Any short positions from this zone must be reactive — not anticipatory. A clear bearish signal (e.g., engulfing, structure break, supply confirmation) is required to consider entry.
Key Zone:
Seek bearish PA between 44,048 – 44,277
Contingency: If price breaks and closes above 44,250 (2024 highs), expect continuation toward 45,000
Short Targets if Rejection Occurs:
Target 1: 43,350
Target 2: 42,500
Extended Target: 41,734 (June Low)
Post-Rejection Bullish Scenario:
If we do get a rejection and targets are met, we will then look for bullish PA in the demand zones (42,500 or 41,700) to consider long setups back toward the 2024 highs and potentially beyond.
Breakout Scenario:
If price breaks and closes above the 44,277 zone early this week, we anticipate the next leg to 45,000 before any meaningful reversal.
At this stage, it’s a waiting game — let price action lead. We don’t predict, we react.ne lows before an
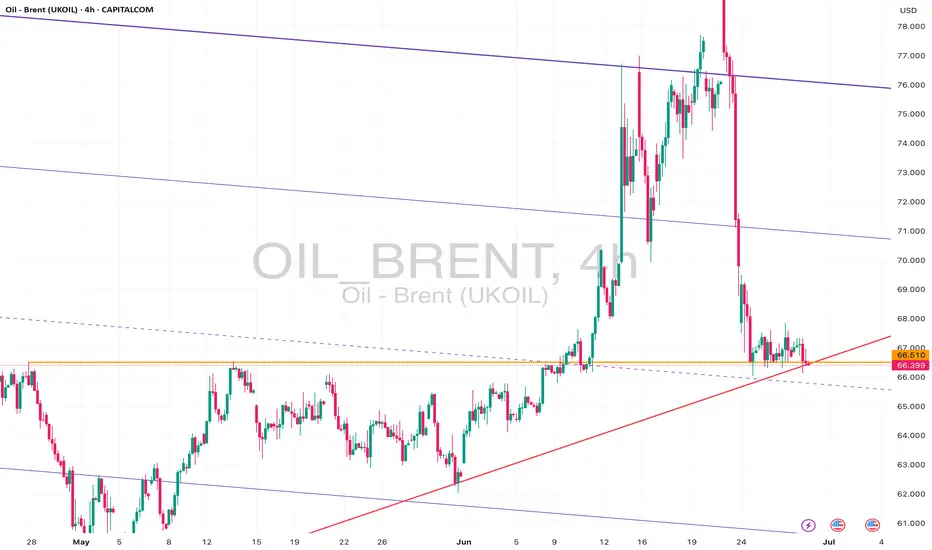
Brent Oil – Bearish Break or Bounce from Long-Term Support?Brent Oil is hovering just above critical support near 66.00, with a clear bearish structure visible across timeframes:
🔎 15m & 1h:
Price action is consolidating near the ascending support trendline drawn from early June lows. Short-term price structure shows lower highs and lower lows, suggesting continued downside pressure.
📉 4h & 1D:
The recent sell-off from above 78.00 has pushed Brent back into the lower region of the broad descending channel. Daily and 4h charts show price testing confluence between the horizontal support at ~66.00 and a long-term rising trendline. A confirmed close below this level could accelerate bearish momentum towards 64.00 or even 62.00.
⚠️ Key Levels:
• Support: 66.00, 64.00, 62.00
• Resistance: 67.00, 69.00
• Bias: Bearish – price remains in a clear downtrend unless buyers reclaim above 67.50 with strong volume.
📌 Outlook:
As long as Brent holds below 67.00 and the descending trendline caps rallies, my bias is bearish. A breakdown of 66.00 on higher timeframes would open the door for a move towards lower channel support levels. However, if buyers defend and push back above 67.50, we could see a short-term relief rally.
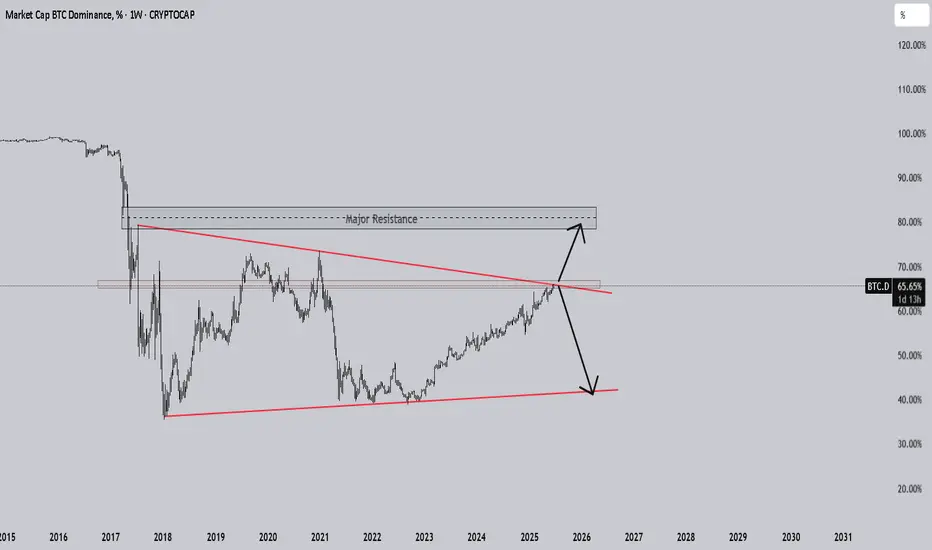
Bitcoin Dominance Is at the Edge and Fundamentals Are PushingCRYPTOCAP:BTC.D Bitcoin dominance (BTC.D) is pressing right into a massive multi-year trendline that has capped it since 2018. We have seen higher lows building since 2022, tightening this squeeze even more. Now it is decision time.
The fundamentals might just tip the scales.
David Sacks says July could be a huge month for crypto. Bakkt is lining up a 1 billion dollar shelf offering that could directly buy BTC. Meanwhile US regulators are pushing hard to finalize crypto market structure rules by September. On top of that, ETFs and big institutional players keep funneling money primarily into Bitcoin, not altcoins.
All this is fueling the case for a breakout in BTC dominance. If it happens, Bitcoin will likely outperform the rest of the market for a while, pulling more of the crypto share back into its hands.
If the chart rejects, we might see altcoins catch some wind and take the spotlight for a bit. But right now with this macro pressure building, the odds seem to favor Bitcoin leading the next leg.
Keep an eye on this chart. A clean breakout above the trendline could set the stage for a very Bitcoin-heavy next few months.
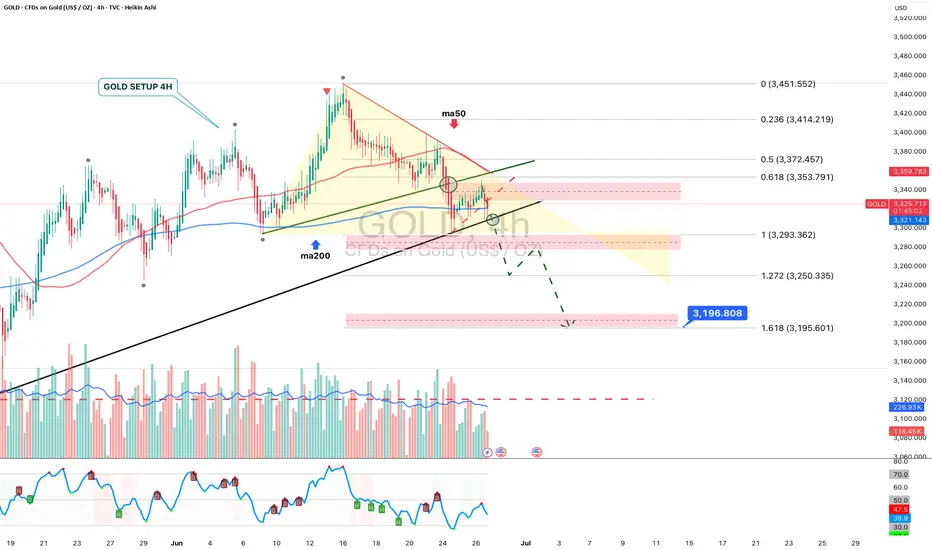
GOLD 4H: not all that glitters is bullish...The 4H chart shows a clean descending triangle breakdown. Price failed to reclaim the trendline and was rejected under both MA50 and MA200. The bounce into 3325–3340 was absorbed — classic liquidity sweep and fade. Volume confirms bearish control.
Technically, the breakdown below 3320 opens the way toward $3293 (1.0 Fibo), $3250 (1.272 extension), and final target at $3195 (1.618), where buyers might step in. RSI supports the continuation without signs of reversal. Structure broke — and the market is telling us where it's heading.
Tactical plan:
— Entry at market or on a retest of $3325–3335
— Targets: $3293 → $3250 → $3195
— Stop: above $3340 (above MA50 and broken trendline)
When gold looks shiny, smart traders look deeper. This breakout isn’t golden — it’s a trap for late bulls.
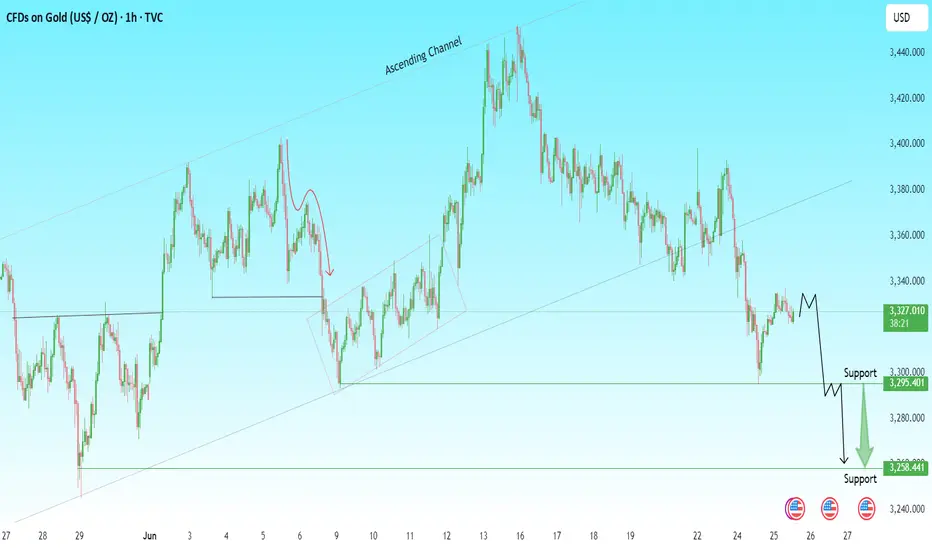
XAUUSD Bearish Setup | Support Levels in SightGold has broken down from the ascending channel, indicating a potential shift in market structure toward bearish momentum.
🔎 Technical Highlights:
Clear breakdown from the ascending channel
Price currently facing resistance near $3,323
Two key support zones:
🟩 First Support: $3,295 – potential bounce area
🟩 Second Support: $3,258 – deeper downside target
📊 Short-Term Outlook: Expecting a minor pullback before continuation lower toward the $3,295 support. If that level fails to hold, the next target becomes $3,258.
💡 Trade Idea: Watch for rejection below $3,323 for a possible short opportunity targeting $3,295 and $3,258. Keep an eye on momentum and volume.
🔔 Note: Always use proper risk management. This setup is based on current price action and may change with market dynamics.
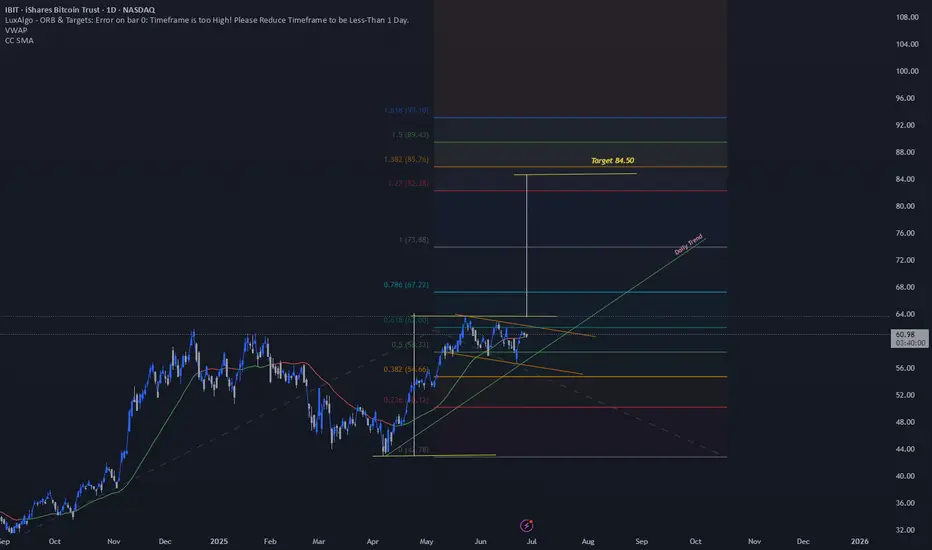
IBIT – Bull Flag + Trend-Based Fib Targets Lined Up🔍 Price Action Setup
IBIT is forming a tight bull flag just beneath key resistance at $64 after a strong impulsive move off the $42.75 base. Structure remains bullish with price holding above the 20 EMA, and volume compression setting the stage for a breakout.
📈 Trend-Based Fibonacci Extensions
If this flag breaks, here's how the upside unfolds based on the trend-based Fib extension:
1.27 – $82.50
1.382 – $85.75 (Measured Move Target)
1.50 – $89.50
1.618 – $93.00 (Full Extension)
These levels align with the prior flagpole projection and market structure above. If bulls step in on volume, $85.75 becomes the logical first destination.
🌊 ETF Inflows Confirm the Narrative
IBIT has pulled in roughly $3.3B in recent inflows, leading the pack during a 12-day net inflow streak across spot Bitcoin ETFs. Institutions are clearly still positioning, and that's reflected in the tape. Tuesday alone brought $436M+ into spot Bitcoin ETFs.
₿ BTC Leading the Way
Bitcoin is holding strong above prior resistance and pushing higher. IBIT looks like it’s just waiting on a breakout confirmation to follow.
📌 Key Trade Levels
Breakout Trigger: Close above $64
Target Zone: $85.75 first, then extended to $93.00
Invalidation: Break below $56 structure
—
🧠 This is not financial advice — just a look at structure and flow through the DC Trading lens.
📲 Follow the journey on IG: @dc_trading_journey
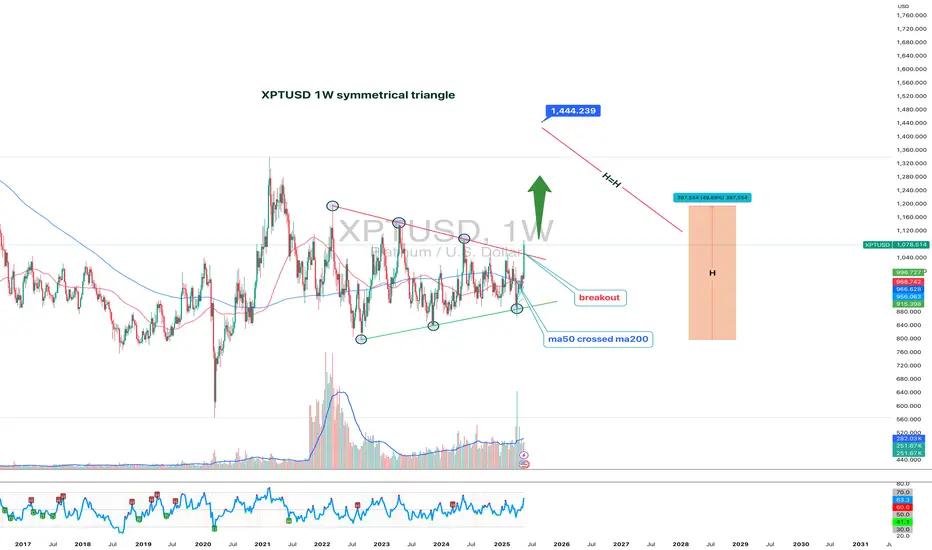
XPTUSD 1W:While Everyone Watches Gold, Platinum Quietly Wakes UpGold gets the headlines — but platinum just broke two years of silence with a clean, high-volume breakout from a symmetrical triangle on the weekly chart. And this isn’t noise — this is the structural shift traders wait for.
Price has been coiled inside a compressing wedge since early 2022. Equal highs. Equal lows. Stop hunts both ways. The classic “shake out before take off.” Now? The breakout is in. And the weekly candle closed above resistance with volume confirmation. Oh, and while we're at it — the 50MA just crossed above the 200MA, signaling a long-term trend reversal.
Target? Measure the triangle height: ~398 points. That projects a breakout target of 1440 USD, which aligns perfectly with previous institutional rejection zones.
But this isn’t just about the chart.
🔹 South Africa, the top global supplier, is struggling with energy and production cuts;
🔹 The Fed is pausing rate hikes — the dollar weakens, metals rally;
🔹 Demand from hydrogen tech, clean energy, and industrial catalysts is on the rise.
Translation? Smart money has been accumulating. The move from 965–1070 was just the ignition. The drive hasn’t started yet.
So while everyone fights over gold highs, platinum sits at the base of a move no one's prepared for — except those who know how accumulation ends.
🧭 Key support: 965–985
📍 Resistance zone: 1150–1180
🎯 Measured target: 1440+
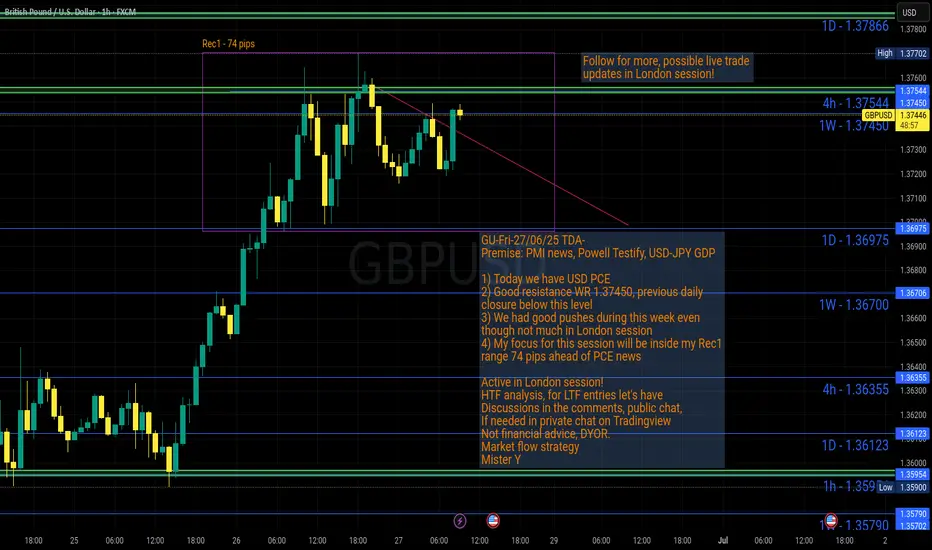
GU-Fri-27/06/25 TDA-Good resistance area 1.37500, PCE news laterAnalysis done directly on the chart
Follow for more, possible live trades update!
I often share my live trades in Tradingview public chat in London session, stay tuned!
Have priorities in your life.
What are the things that you consider to be top
before anything else?
Do you consider trading as top priority?
When facing doubts and insecurities, if you have
set a list of priorities, you'll likely to be more
oriented and not get lost easily shifting your focus
with your own top priorities.
Active in London session!
Not financial advice, DYOR.
Market Flow Strategy
Mister Y
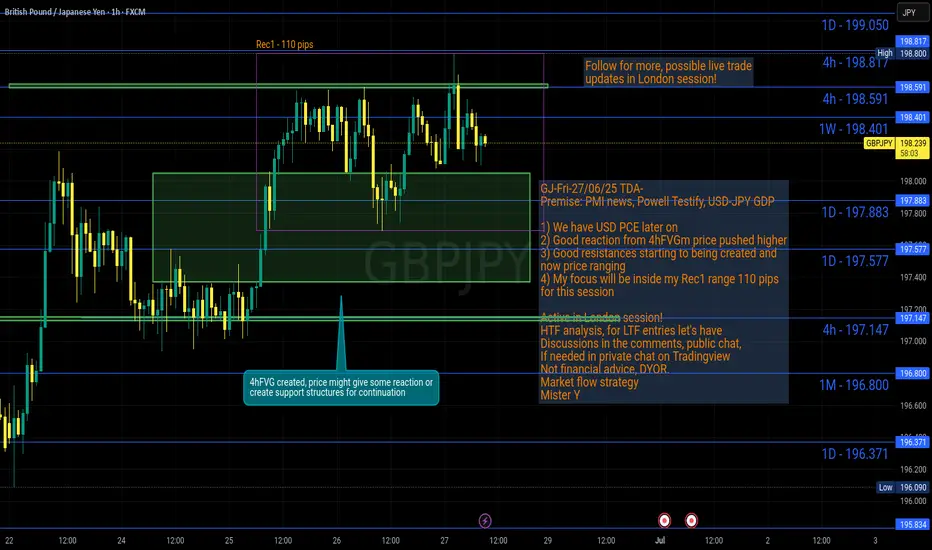
GJ-Fri-27/06/25 TDA-GJ starting to range after it broke higher!Analysis done directly on the chart
Follow for more, possible live trades update!
I often share my live trades in Tradingview public chat in London session, stay tuned!
Have patience!
Without patience, even the easiest thing can be
turned into burden!
Even the easiest setup trade can be turned into
a loss.
Do you agree or disagree? Comment down below!
Active in London session!
Not financial advice, DYOR.
Market Flow Strategy
Mister Y
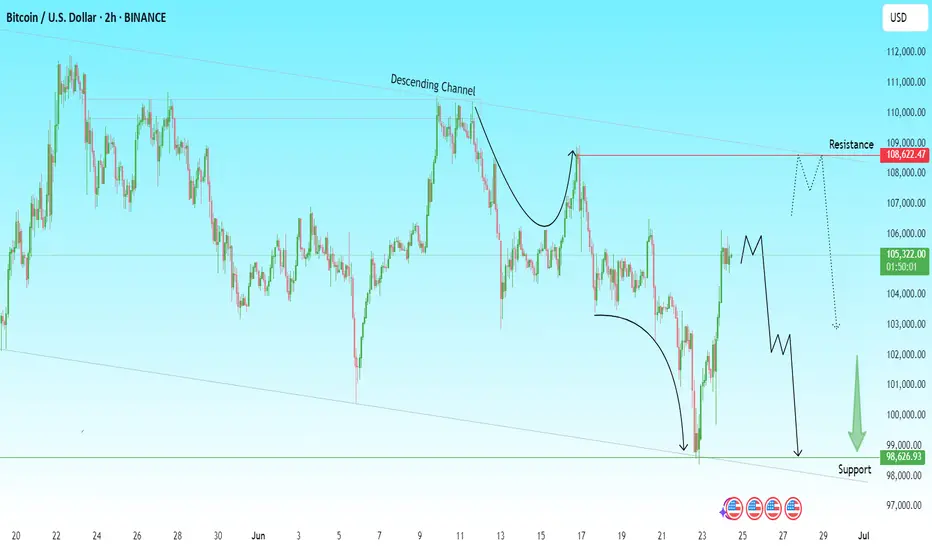
BTCUSD Analysis | Bearish Setup Unfolding?Bitcoin is trading within a descending channel, respecting lower highs and lower lows. The recent price action shows a sharp bounce from the $98,600 support zone, but the bigger picture still hints at potential downside.
🔍 Key Technical Insights:
Descending Channel remains intact – structure suggests bearish continuation.
Price bounced from $98,626 support, but is struggling below key resistance at $108,622.
A possible lower high formation near $106K–$107K could trigger the next drop.
Bearish projection remains valid if price fails to break above the descending trendline.
🟢 Upside Scenario: If bulls manage to break above $109K resistance, we could see a bullish reversal.
🔴 Downside Target: If the bearish setup confirms, we may revisit the $98,000–$99,000 support area once again.
📌 Plan Accordingly:
Wait for price action confirmation near resistance. Patience pays in volatile zones like this!
#BTCUSD #Bitcoin #CryptoAnalysis #TradingView #BTCUpdate #CryptoTrader #TechnicalAnalysis
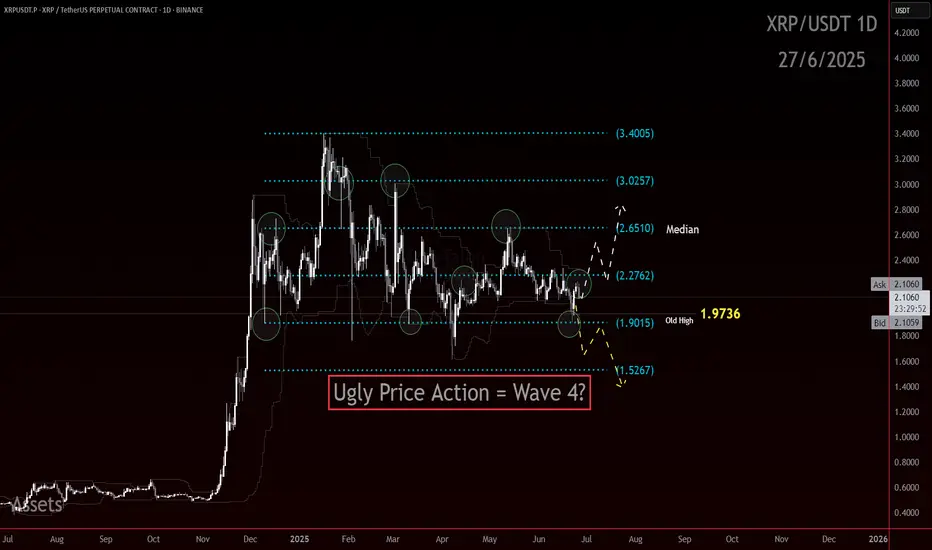
XRP UG-ah-LYXRP has been slowly chopping lower in a mess of overlapping candles. Lower highs and lower lows at the Highest degree. The trend is down and the Elliott Is ugly.
There is a chance here for the trend to shift, but that low needs to hold.
In Elliott Wave, ugly can be useful. An ugly pattern often screams correction. That is the working assumption right now. This structure could still be a complex wave four.
Even though the wave count has not been crystal clear, I am not flying blind. I am using support and resistance to track the structure and wait for clarity.
Here are the levels that matter right now:
3.4005 was the major high
3.0257 and 2.2762 are key reaction zones
2.6510 is the median and the first major line bulls need to beat
1.9736 is the old high that price continues to bounce from
1.9015 and 1.5267 are the potential downside reaction zones if the yellow path unfolds
If this is a correction, there is still potential to hold above 1.62 and send. If that level goes, the structure shifts fast to lower targets.
This is not the time to get brave without confirmation, mo.
Ugly price action can still resolve cleanly. But I want to see an impulsive move through one of these levels, followed by a corrective return to that level. That would offer a more ideal continuation in whichever direction price decides.
Let the level reactions speak first. I will act after.
2025-06-26 - priceactiontds - daily update - daxGood Evening and I hope you are well.
comment: Is this a bigger two-legged pullback to the 4h ema and now we strongly break above 23900 to go for 24200+ again? It’s my most likely case. It’s still not a good trade to buy above 23800 since that trapped you two times this week for 230 and 300 point pullbacks.
current market cycle: broad bull channel on the weekly chart. Daily chart is in a trading range 23000 - 24500
key levels: 23500 - 24500
bull case: Everything aligns for the bulls. They need the breakout above Tuesday’s high and then we go for the obvious big round number 24000 but I doubt we will stop here. Once the bears who sold above 23800 this week give up, I doubt there will be much resistance until maybe 24300 or higher. Anything below 23600 would be a huge bear surprise tomorrow and my bullish bias is likely wrong.
Invalidation is below 23000.
bear case: Bears don’t have much until they print below 23600 again. Can they hold the market below 24000 and keep this trading range alive? I doubt it. Bears tried 3 times this week and the bull gap to 23550 stayed open.
Invalidation is above 24100.
short term: Bullish. Still expecting 24000 and no print below 23600 tomorrow. Everything else would be a big bear surprise and we could go much lower than 23500 but this is the most unlikely scenario.
medium-long term from 2025-06-22: New bear trend has likely started on 2025-06-05 and we saw W2 conclude on Friday. Daily close below 23000 will be the confirmation for the bears and I have drawn 2 potential final W5 targets. I have written that we will see 20000/21000 again over the summer for many weeks/months now, this even is just another excuse for “analysts” to justify the move down.
trade of the day: Longs close to 23600 were the obvious trade today. The selling for 198 was at least 100 points stronger than I expected and stopped me out but I immediately went long again on the very strong buying below 23650 and closed the day with profits.