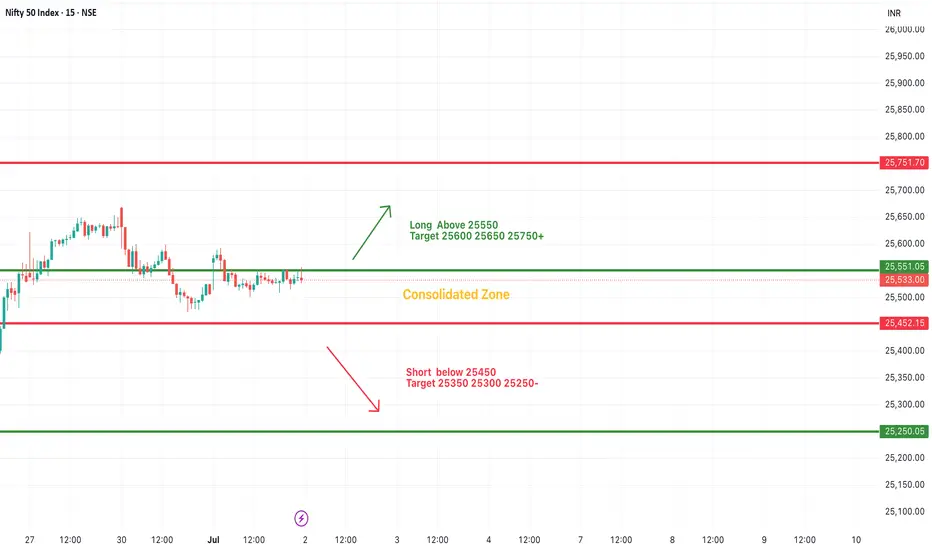
#NIFTY Intraday Support and Resistance Levels - 02/07/2025Nifty is expected to open flat near the 25,530 level, right in the middle of the consolidation zone between 25,450 and 25,550. This range has acted as a tight resistance and support band in recent sessions, indicating indecision in the market. A breakout above 25,550 can trigger bullish momentum toward 25,600, 25,650, and even 25,750+ levels, while staying within this zone may continue the sideways trend.
On the downside, if Nifty breaks below the 25,450 level, we may see selling pressure taking it toward 25,350, 25,300, or even 25,250. Traders are advised to wait for a clear breakout from this consolidation band before entering directional trades, and maintain proper risk management given the tight range and potential volatility
Priceactionanalysis
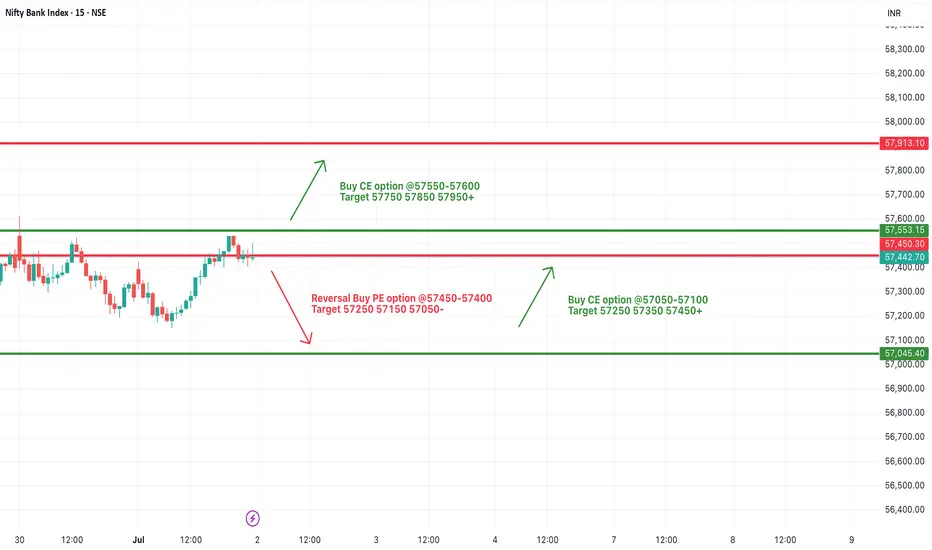
[INTRADAY] #BANKNIFTY PE & CE Levels(02/07/2025)Bank Nifty is expected to open flat near the 57,440 level, just below the immediate resistance at 57,450. This zone will play a crucial role in today’s session. Sustaining above 57,450 can lead to bullish momentum with potential upside targets of 57,550, 57,850, and 57,950. Traders may look for a breakout confirmation before entering long trades.
On the downside, if the index fails to sustain above the 57,450 level and reverses, support around the 57,100–57,050 zone could be tested. A move below this range might lead to a short-term decline toward 57,000 and 56,950. The market remains in a consolidation phase, and breakout from this tight zone can lead to a directional move.
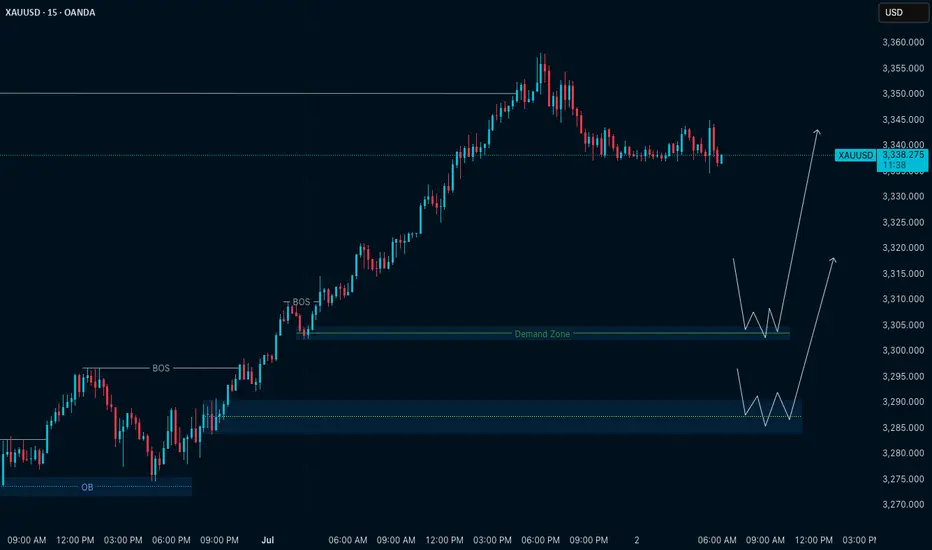
Gold (XAUUSD) – Bias for July 2Yesterday, price broke above the key H4 Lower High zone (3348–3350) with strong bullish momentum.
This breakout suggests a possible shift in the higher timeframe structure — indicating that the market may now be building toward a larger uptrend.
But we don’t chase breakouts — we prepare for the pullback phase .
🔍 What to Watch:
At present, M15 remains in a clean uptrend , fully in sync with the new H4 structure.
This multi-timeframe alignment gives us a clear bullish bias — but not an entry by itself.
We now need to see how price develops the pullback.
The best trades come when structure retraces with clarity — and confirms before continuation.
📍 Key M15 Level to Track:
• 3302 – Current M15 Higher Low
→ If this level holds, we may see a continuation of the uptrend from here.
→ If it breaks, the next potential reversal zone is around 3290 , where demand may reappear.
🎯 Execution Plan:
The trend is now clearly bullish across HTF and LTF.
We will only look for long setups , and only where structure confirms — either at the current HL or at deeper demand zones.
No confirmation = No trade.
No alignment = No edge.
Let price come to you. Our job is not to anticipate, but to align.
📖 From the Mirror Philosophy:
“In trend-following, the edge lies in waiting — not in chasing.
The market will reflect your patience back at you.”
📘 Shared by @ChartIsMirror
Author of The Chart Is The Mirror — a structure-first, mindset-grounded book for traders
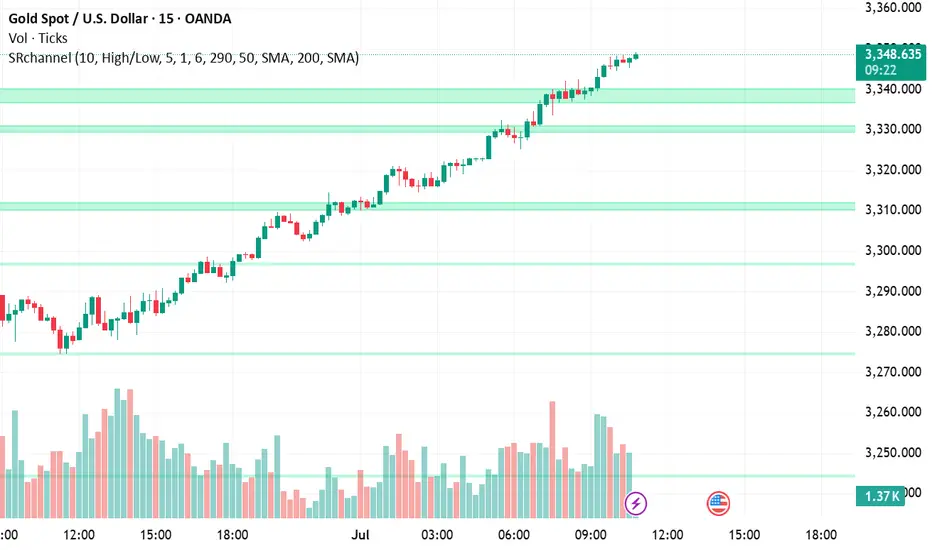
XAU/USD – Bullish Trend Faces Resistance at $3,350 XAU/USD – Bullish Trend Faces Resistance at $3,350 | Watch for Breakout or Pullback!
📅 Published on: Jul 01, 2025
✍️ By: MR_MARK0
🧠 Market Context:
Gold (XAU/USD) has been riding a strong bullish wave, pushing through multiple resistance levels. Currently, price is hovering just below the $3,350 resistance, which marks a critical level for either trend continuation or a potential pullback. Momentum remains in favor of buyers, but signs of exhaustion are beginning to surface.
🔍 Key Zones:
🔴 Resistance Zone: $3,350.0 – $3,352.5
🟢 Support Zone: $3,338.0 – $3,340.0
🟢 Demand Block: $3,310.0 – $3,315.0 (bullish base before recent breakout)
📌 Strategy in Play:
The chart reflects a Trend Continuation Strategy with key support/resistance zones identified. Price has shown strength, but we are now at a make-or-break level. Patience is crucial here.
🧭 Trade Idea:
🔁 Buy the Dip:
Entry Zone: $3,340 – $3,342
SL: Below $3,338
TP1: $3,352
TP2: $3,360
🔁 Breakout Play (Aggressive):
Entry: On breakout above $3,352 with bullish volume
SL: Below breakout candle low
TP: $3,360 and $3,372
⚠️ Risk Note:
Price is extended; a fake breakout above $3,350 may trigger a bull trap. If price fails and drops below $3,338, expect a corrective move toward $3,330 – $3,310. Watch volume divergence and candle rejection patterns.
01.07.25 Morning ForecastPairs on Watch -
FX:EURNZD
FX:GBPCAD
FX:EURUSD
FX:GBPJPY
A short overview of the instruments I am looking at for today, multi-timeframe analysis down to what I will be looking at for an entry. Enjoy!

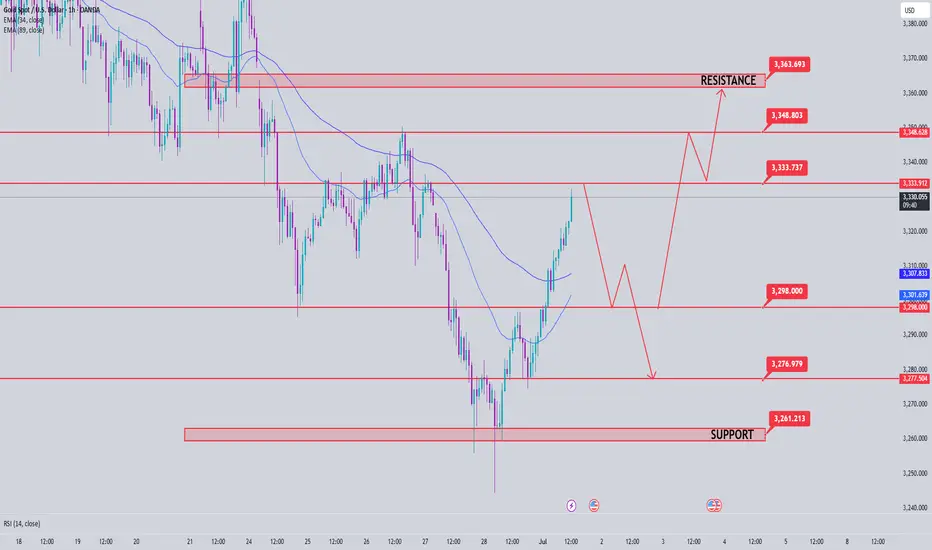
Gold price analysis July 1On the D1 chart, the price has recovered positively when the candle closed above 50% of the decrease range of last Friday's session. This shows that buying power is returning and a new uptrend is forming, with the target heading towards the GAP zone around 3363.
Today's trading strategy:
Prioritize buying (BUY) if the price has a correction to the support zone of 3300.
Sell strategy should only be implemented at important resistance zones, with short-term profit expectations because the main trend is leaning towards the uptrend.
Important technical levels:
Support: 3300 - 3337 - 3360
Resistance: 3334 - 3348 - 3363
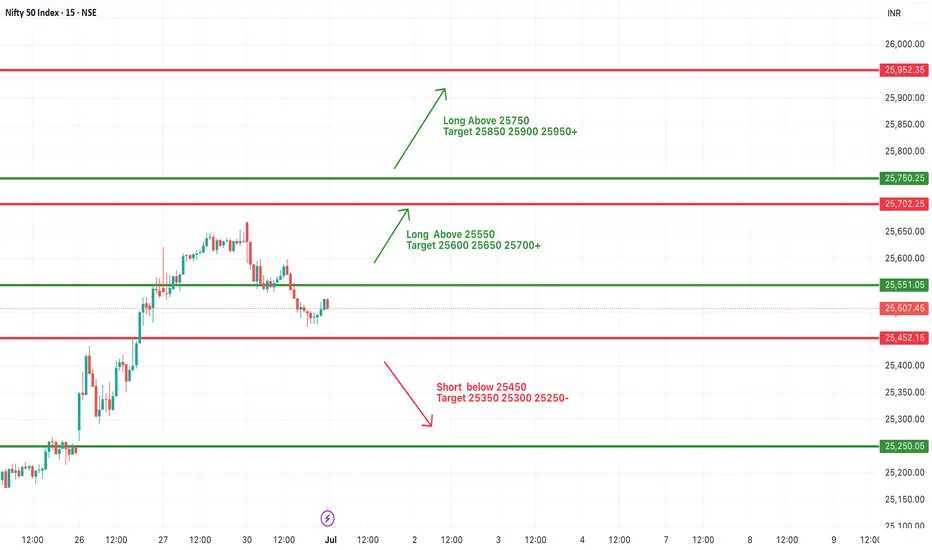
#NIFTY Intraday Support and Resistance Levels - 01/07/2025Nifty is expected to open with a slight gap up near the 25,550 level, which lies close to a minor resistance zone. If the index manages to sustain above this region, we may see a continuation of bullish momentum with potential upside levels at 25,600, 25,650, and 25,700. Holding above 25,550 would signal strength, supported by recent recovery attempts from lower levels.
However, if the index fails to hold above 25,550 and starts slipping below 25,450, weakness may creep in. A fall below 25,450 could open the door for downside targets of 25,350, 25,300, and possibly 25,250. Traders should stay cautious around the 25,550–25,600 zone for a clear directional move, with strict stop losses on both sides.
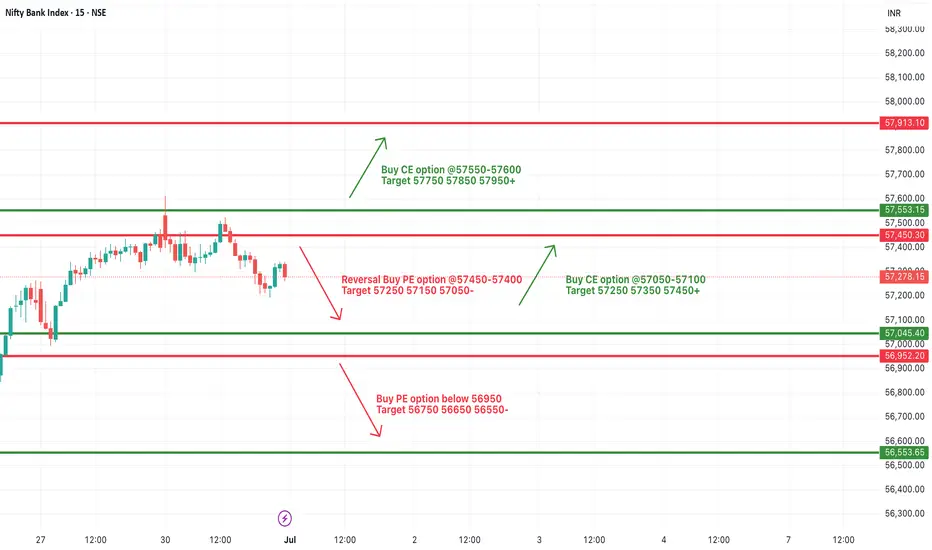
[INTRADAY] #BANKNIFTY PE & CE Levels(01/07/2025)Bank Nifty is expected to open slightly gap up near the 57,450 level, which lies close to an important resistance zone. If the index manages to sustain above this level, a further upside movement may be seen toward 57,750, 57,850, and 57,950. Strength above 57,500 could indicate bullish momentum continuation and may attract fresh buying interest.
On the flip side, if Bank Nifty fails to hold above the 57,450–57,400 zone and shows signs of reversal, a decline toward 57,250, 57,150, and 57,050 is possible. A breakdown below 56,950 will likely trigger further downside levels toward 56,750, 56,650, and 56,550. It is advised to observe price action around the 57,450–57,500 level for directional clarity in today’s session.
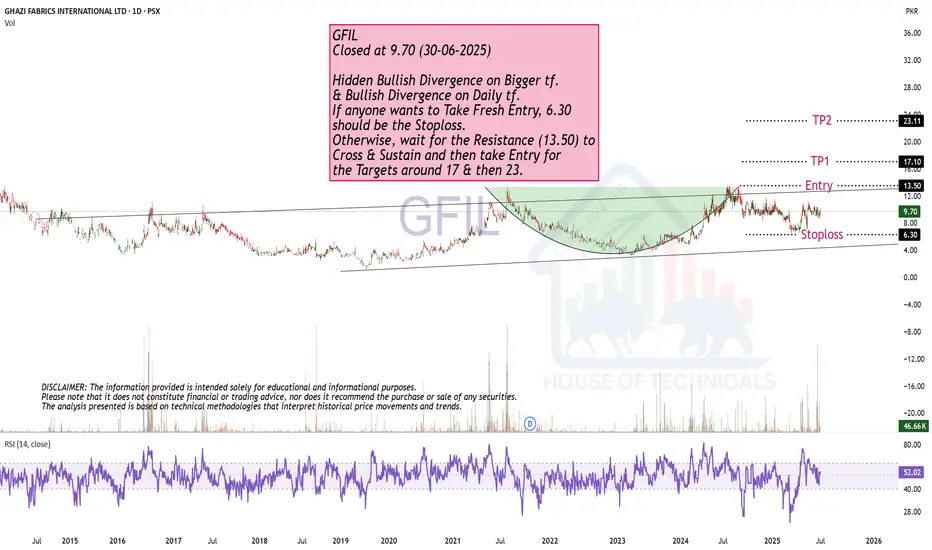
Cup & Handle Formation.GFIL
Closed at 9.70 (30-06-2025)
Hidden Bullish Divergence on Bigger tf.
& Bullish Divergence on Daily tf.
If anyone wants to Take Fresh Entry, 6.30
should be the Stoploss.
Otherwise, wait for the Resistance (13.50) to
Cross & Sustain and then take Entry for
the Targets around 17 & then 23.
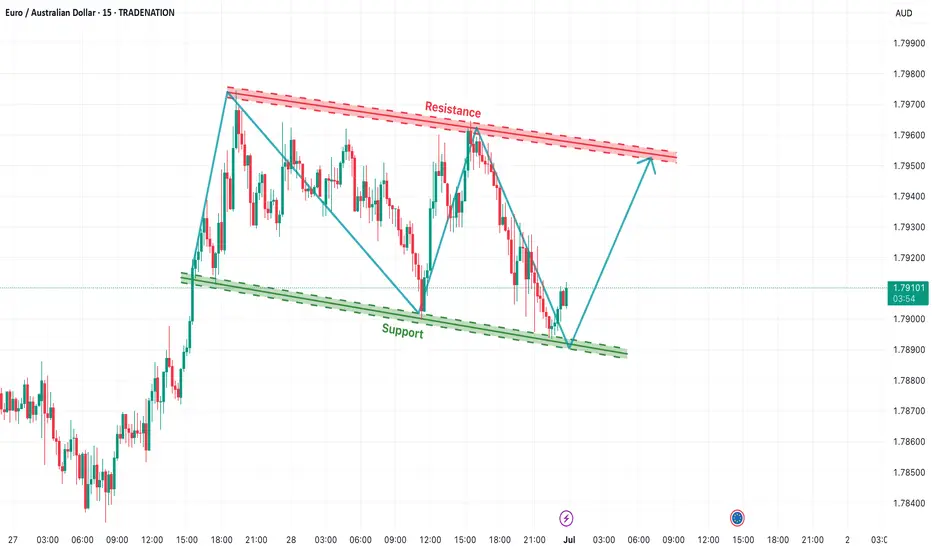
EUR/AUD Falling Channel Reversal SetupThe EUR/AUD pair is currently trading inside a well-respected falling channel structure on the 15-minute timeframe. Price action has been bouncing between a descending resistance trendline and a sloping support zone, confirming the integrity of the pattern. The pair recently rebounded from the lower boundary of the channel, indicating potential short-term bullish momentum ahead.
This setup highlights a typical channel reversal bounce, offering a high-probability trading opportunity if the pair maintains upward pressure.
📈 Bullish Scenario – Intraday Channel Rebound
The price has touched the support line near 1.7885 and is now climbing higher.
Based on previous cycles, price tends to move from support to resistance within this channel.
A bounce from this level may lead to a move toward the upper channel resistance zone around 1.7960–1.7970.
The blue arrows illustrate the expected zig-zag movement within the channel.
📉 Bearish Scenario – If Support Fails
If the price breaks below 1.7880, it would indicate a channel breakdown, invalidating the bullish setup.
Such a move could lead to fresh downside targets near 1.7850 or lower, continuing the micro downtrend.
🎯 Intraday Trade Plan
Buy Setup (Reversal Play):
Entry: 1.7895–1.7905 (after candle confirmation on support)
SL: Below 1.7875
TP: 1.7950–1.7970 (channel top)
Sell Setup (on rejection or breakdown):
Entry: Near 1.7960 resistance or breakdown below 1.7880
SL: Above 1.7980
TP: 1.7850 and below
🧭 Technical Outlook Summary
Pattern: Falling Channel
Bias: Short-term bullish (reversal from support)
Key Zones: 1.7885 support | 1.7960 resistance
Watch for breakout beyond channel for directional confirmation
=================================================================
Disclosure: I am part of Trade Nation's Influencer program and receive a monthly fee for using their TradingView charts in my analysis.
=================================================================
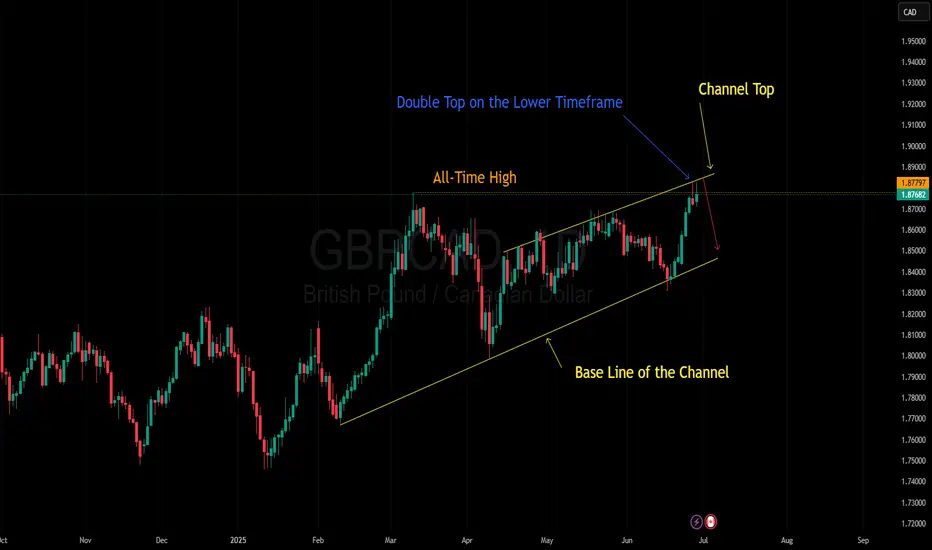
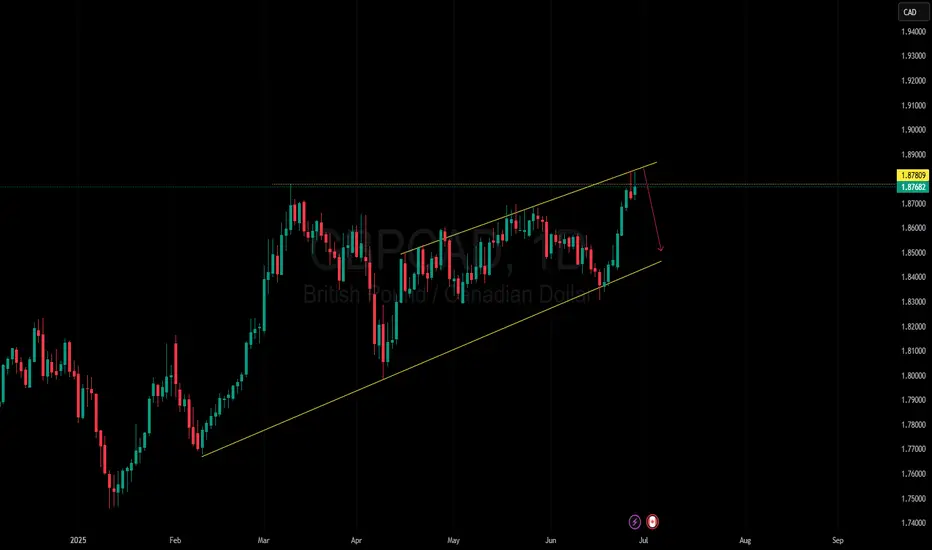
Failed to break higher — now it’s time to crash.After a sharp rally, the market has hit its previous all-time high.
📌 A double top is now forming — signaling a potential short-term pullback.
Get ready for a possible dip — let’s go! 🚨
OANDA:GBPCAD
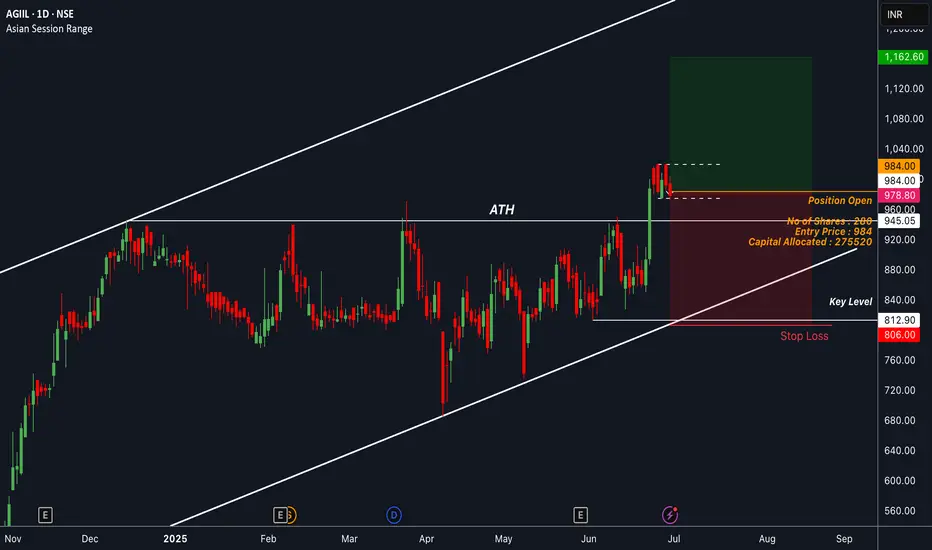
AGIIL : Sniped a Long with 1% Risk on the TableDecided to enter after the market consolidated post a strong ATH breakout. Looking for a rally toward the channel’s dynamic resistance from here.
📢📢📢
If my perspective changes or if I gather additional fundamental data that influences my views, I will provide updates accordingly.
Thank you for following along with this journey, and I remain committed to sharing insights and updates as my trading strategy evolves. As always, please feel free to reach out with any questions or comments.
Other posts related to this particular position and scrip, if any, will be attached underneath. Do check those out too.
Disclaimer : The analysis shared here is for informational purposes only and should not be considered as financial advice. Trading in all markets carries inherent risks, and past performance is not indicative of future results. It’s essential to conduct your own research and assess your risk tolerance before making any investment decisions. The views expressed in this analysis are solely mine. It’s important to note that I am not a SEBI registered analyst, so the analysis provided does not constitute formal investment advice under SEBI regulations.
GILLETTE : Took a long position with 1% riskEntered right after the close of the momentum candle that broke the ATH levels. Sl is kept underneath the most recent low. Will be managing the trade depending on the momentum of the market in the coming days.
📢📢📢
If my perspective changes or if I gather additional fundamental data that influences my views, I will provide updates accordingly.
Thank you for following along with this journey, and I remain committed to sharing insights and updates as my trading strategy evolves. As always, please feel free to reach out with any questions or comments.
Other posts related to this particular position and scrip, if any, will be attached underneath. Do check those out too.
Disclaimer : The analysis shared here is for informational purposes only and should not be considered as financial advice. Trading in all markets carries inherent risks, and past performance is not indicative of future results. It’s essential to conduct your own research and assess your risk tolerance before making any investment decisions. The views expressed in this analysis are solely mine. It’s important to note that I am not a SEBI registered analyst, so the analysis provided does not constitute formal investment advice under SEBI regulations.

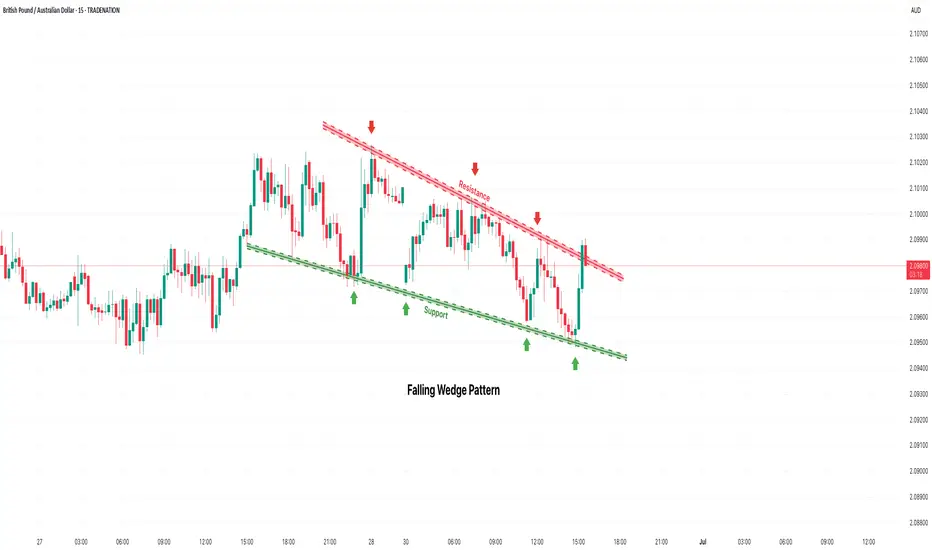
GBP/AUD Falling Wedge Pattern – Reversal or Breakdown?The GBP/AUD pair is currently trading inside a well-defined falling channel on the 15-minute timeframe. The price has been making lower highs and lower lows, respecting both the descending resistance and support trendlines. This setup suggests a short-term bearish structure, but the most recent bounce from the lower boundary raises the possibility of a bullish reversal from support.
🔁 Key Technical Levels
Resistance Zone: Around 2.0995–2.1005 (top of the channel)
Support Zone: Around 2.0930–2.0940 (bottom of the channel)
🔼 Bullish Reversal Scenario
The pair recently bounced strongly from the support zone, indicating buying interest near the channel bottom. If the price breaks above the descending resistance line with a strong bullish candle and follow-through, it would suggest a breakout from the falling channel. That could open upside potential toward 2.1020–2.1050, especially if volume supports the move.
🔽 Bearish Continuation Scenario
If the resistance holds and price starts to fall again, the pair could continue the downward structure, retesting the 2.0940–2.0930 support. A breakdown below that level would confirm a bearish continuation with possible targets near 2.0900 or lower.
🎯 Trade Plan Outline
Buy Setup:
Entry: On confirmed breakout above resistance (~2.1005)
SL: Below 2.0980
TP: 2.1030 / 2.1050
Sell Setup:
Entry: On rejection at resistance or confirmed breakdown below 2.0930
SL: Above 2.1000
TP: 2.0910 / 2.0885
=================================================================
Disclosure: I am part of Trade Nation's Influencer program and receive a monthly fee for using their TradingView charts in my analysis.
=================================================================
30.06.25 Morning ForecastPairs on Watch -
PEPPERSTONE:HK50
FX:EURJPY
FX:GBPJPY
FX:GBPUSD
A short overview of the instruments I am looking at for today, multi-timeframe analysis down to what I will be looking at for an entry. Enjoy!

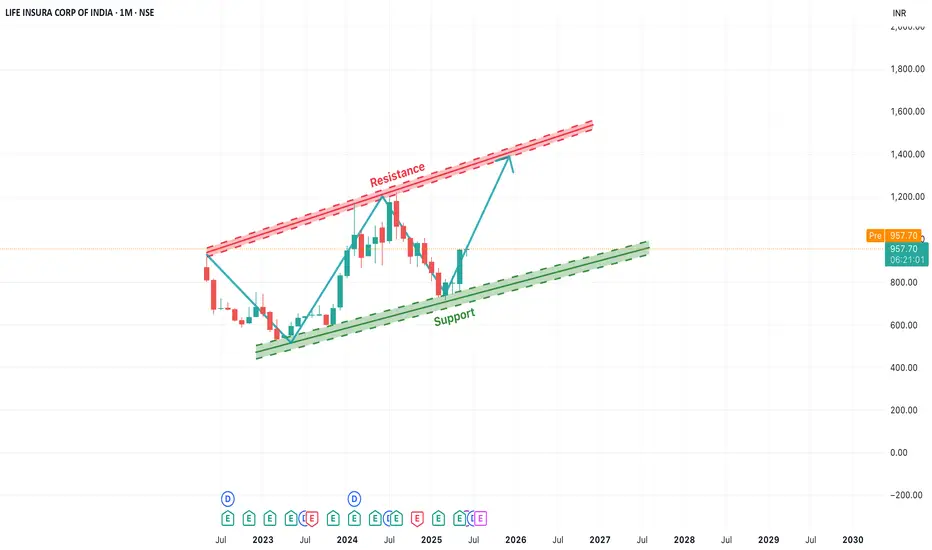
[Long-Term]LICI Rising Channel Pattern Indicates Bullish OutlookIn this monthly chart of LICI, we observe a clear ascending channel pattern forming over the past two years. The price has consistently respected both the support and resistance trendlines, creating a strong bullish structure.
Currently, the stock is bouncing off the lower support trendline, indicating a potential upward move towards the upper resistance zone. This offers a positive long-term outlook, especially if the momentum sustains. The key levels to watch are:
Support Zone: Around ₹850–₹900
Resistance Zone: ₹1250–₹1300
Traders and investors can monitor for a gradual rise toward the resistance level. A breakout beyond this channel may open up new highs, while a breakdown below the support trendline would invalidate the pattern.
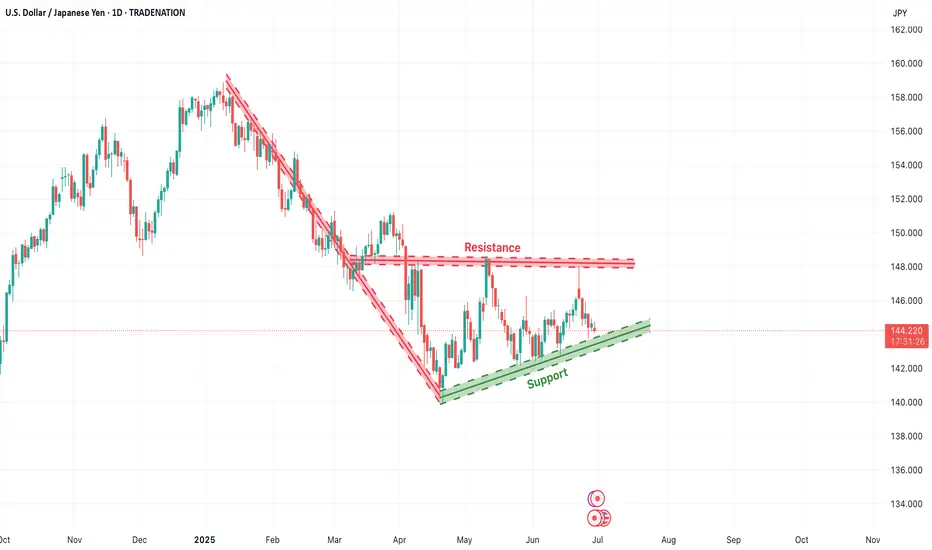
USD/JPY Consolidation Triangle – Breakout WatchThe USD/JPY pair is currently trading inside a well-formed symmetrical triangle pattern on the daily chart. This structure typically forms when the market is in a phase of consolidation, with neither buyers nor sellers able to break the range. Price is compressing between a horizontal resistance zone (~146.50) and a rising support line (~143.50), indicating that a breakout in either direction may be imminent.
This triangle has formed after a sharp downtrend, followed by a broad base formation. Such setups often precede a decisive move, especially if accompanied by volume.
🔼 Upside Breakout Scenario
If price breaks and closes above the resistance zone (above 146.50–147.00) with bullish confirmation, we can expect momentum to shift in favor of buyers. A confirmed breakout would open the path toward 150.00+, possibly even retesting the highs of 2024 near 152.00. This would be seen as a bullish reversal after a prolonged downtrend.
🔽 Downside Breakdown Scenario
Alternatively, if price fails to hold the rising trendline and breaks below the 143.00–142.50 support zone, it may confirm a bearish breakdown. This would suggest a continuation of the earlier downtrend with fresh bearish momentum targeting 140.00 and lower levels.
🧭 Trade Strategy Consideration
Bullish Plan: Buy breakout above 147.00 with SL below 145.50 and TP near 150.50–152.00
Bearish Plan: Sell breakdown below 142.50 with SL above 144.00 and TP near 140.00–138.00
Neutral Bias: Wait for breakout confirmation; no trade inside the triangle
This is a tight volatility setup where breakout traders should stay alert. The longer the consolidation, the stronger the breakout move tends to be.
=================================================================
Disclosure: I am part of Trade Nation's Influencer program and receive a monthly fee for using their TradingView charts in my analysis.
=================================================================
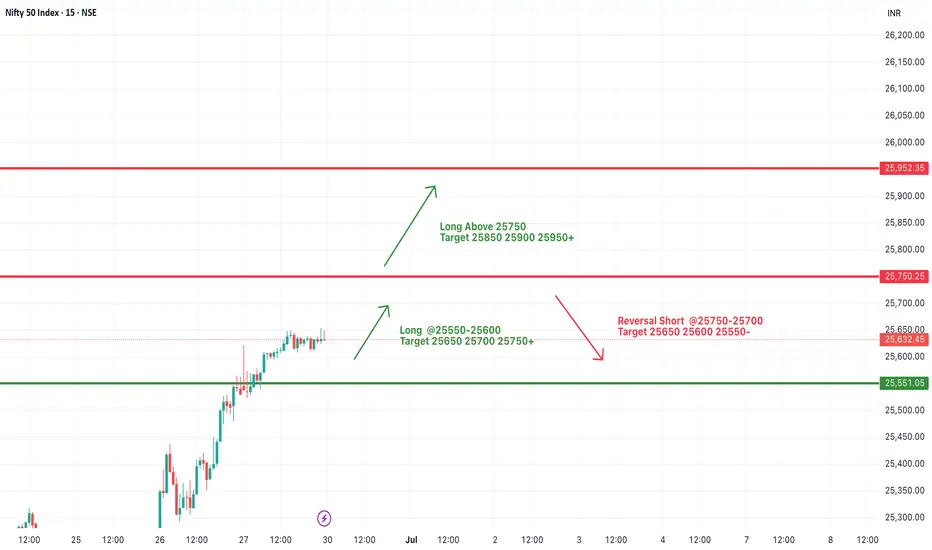
#NIFTY Intraday Support and Resistance Levels - 30/06/2025Nifty is expected to open on a flat note near the 25,630 zone. The market has shown strong bullish momentum in recent sessions, and prices are now hovering near the upper resistance band of 25,750. If Nifty manages to break and sustain above the 25,750 level, a fresh upward move can be expected, with targets around 25,850, 25,900, and 25,950+. This could offer good long opportunities, especially above the 25,750–25,770 breakout range.
On the downside, if Nifty faces resistance around 25,750 and starts to reverse from that level, a short opportunity could emerge in the 25,750–25,700 zone. In such a case, reversal targets can be seen at 25,650, 25,600, and 25,550. Support at 25,550 will act as a crucial level to watch.
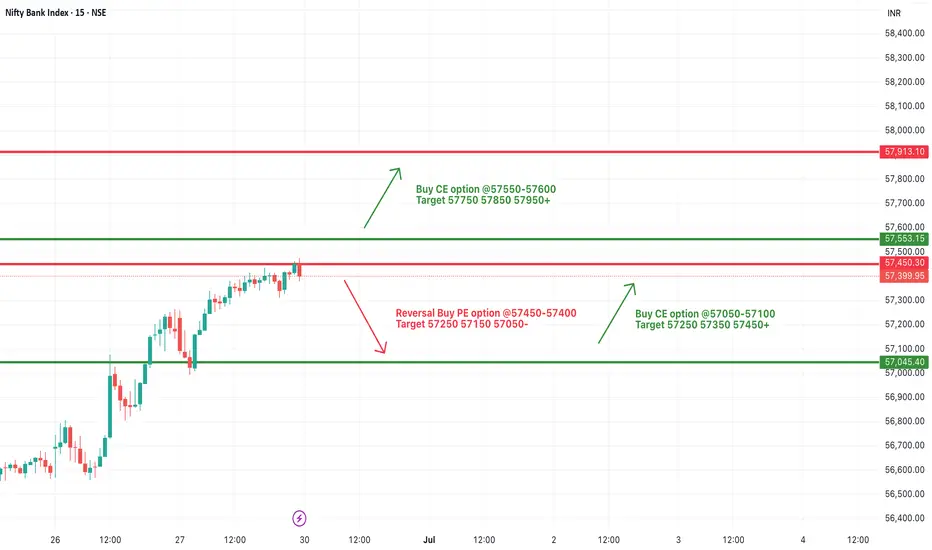
[INTRADAY] #BANKNIFTY PE & CE Levels(30/06/2025)Bank Nifty is expected to open on a flat note near the 57,400 zone, with price action currently hovering around a key resistance level of 57,450. If Bank Nifty sustains and breaks above this resistance zone of 57,450–57,500, a bullish breakout is likely. Traders can consider buying CE options in the 57,550–57,600 range with potential targets at 57,750, 57,850, and 57,950+. This move would signal continued upward momentum in the index.
However, if the price faces rejection from this resistance and slips below 57,450, a short-term reversal is possible. In that case, traders may look for PE opportunities in the 57,400–57,450 zone with targets at 57,250, 57,150, and 57,050. The lower support level remains around 57,050, which should act as a key zone for reversal or bounce-back scenarios.
Failed to break higher — now it’s time to crash.After a sharp rally, the market has hit its previous all-time high.
📌 A double top is now forming — signaling a potential short-term pullback.
Get ready for a possible dip — let’s go! 🚨
OANDA:GBPCAD
XAU/USD (Gold) Breakout or Breakdown Setup – Key Decision ZoneThe Gold Spot (XAU/USD) price action is currently at a crucial inflection point after consolidating in a rising wedge pattern between ascending support and horizontal resistance. This type of structure typically indicates a strong directional breakout is likely, and the current daily candle shows a close below the ascending support, signaling a potential bearish breakdown confirmation.
🔽 Bearish Breakdown Scenario (Confirmed Below 3250)
If price sustains below the 3250 support breakdown level, it confirms a bearish breakdown from the wedge. The height of the wedge (distance between the base of the move and the resistance) is used to project the downside target, giving us key levels to monitor:
Breakdown Confirmation: Below 3250.00
Target 1: 3111.67
Target 2: 2990.31
Projected Downside Target: 2861.24
This move suggests that gold could enter a deeper correction if buyers fail to reclaim the ascending structure quickly.
🔼 Bullish Breakout Scenario (Above 3500)
On the flip side, if bulls manage to push price back above the 3500 level, it would invalidate the current bearish momentum and confirm a bullish breakout. The projected upside targets are based on the same measured move logic:
Breakout Confirmation: Above 3500.00
Target 1: 3621.90
Target 2: 3741.84
Projected Upside Target: 3855.78
A close above 3500 with volume would set the tone for a fresh rally toward new highs.
🧭 Strategy Outlook
Short Bias (active): Entry below 3250; SL above 3300; TP at 3110 / 2990 / 2860
Long Bias (if reversal): Entry above 3500; SL below 3460; TP at 3620 / 3740 / 3850
Always wait for a strong daily candle close beyond the breakout/breakdown levels before initiating any trades
=================================================================
Disclosure: I am part of Trade Nation's Influencer program and receive a monthly fee for using their TradingView charts in my analysis.
=================================================================

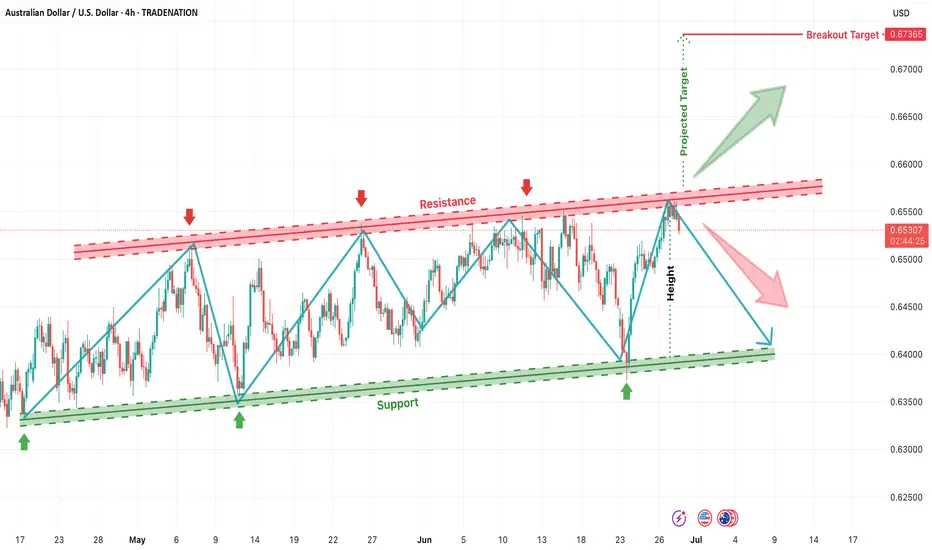
AUD/USD Parallel Channel Setup – Breakout or Pullback in PlayThe AUD/USD pair is trading within a clearly defined ascending parallel channel, with consistent rejections from both the upper resistance zone near 0.6550–0.6560 and repeated bounces from the rising support area near 0.6390–0.6400. This structured price movement indicates strong channel discipline, which traders can use for high-probability breakouts or reversal plays.
The current price action is approaching the upper boundary of the resistance, and a decisive breakout here could lead to a bullish rally toward the projected target.
📈 Bullish Breakout Scenario
If the price breaks and closes above the resistance zone (above 0.6560), it will confirm a bullish breakout from the channel. Based on the height of the channel, the projected breakout target is 0.67365, which is derived by measuring the vertical distance between support and resistance and projecting it upward from the breakout point. This could signal a major trend continuation in favor of the bulls.
📉 Bearish Rejection Scenario
If the price once again gets rejected at the resistance zone, a corrective move is expected toward the support area around 0.6400. The structure suggests that unless a breakout occurs, price may continue to oscillate within the rising channel. The next bearish leg could form a lower high and test the trendline support again.
🧭 Trading Strategy Outlook
Buy Breakout Strategy:
Entry: Above 0.6560
SL: Below breakout candle
TP: 0.67365 (projected target)
Sell Rejection Strategy:
Entry: Near 0.6550 resistance
SL: Above 0.6570
TP: 0.6400 support zone
This is a neutral-to-bullish setup, with a potential for continuation if the resistance breaks with strength. Traders should wait for confirmation before entering.
=================================================================
Disclosure: I am part of Trade Nation's Influencer program and receive a monthly fee for using their TradingView charts in my analysis.
=================================================================
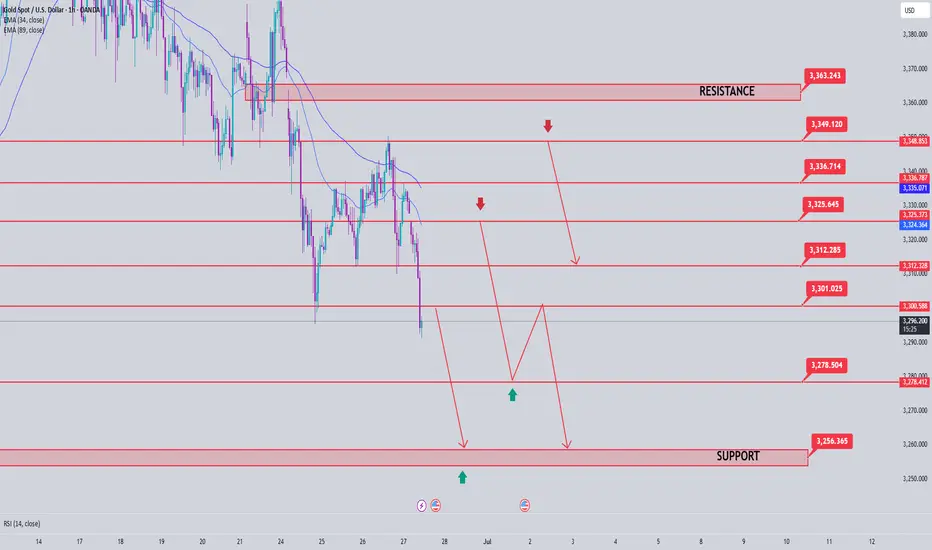
Gold Price Analysis June 27Daily Trend Analysis:
The price has reacted strongly at the 3348 level, forming a clear and sustainable bearish structure. The 3296 zone is now a critical level — a confirmed breakout below this area could lead to a deeper decline, especially with limited potential for recovery on Friday.
Today, the bearish trend is likely to face less resistance compared to the bullish side. As such, a move toward the support zones at 3278 and 3255 is highly probable.
Any bullish retracement during the European session should be viewed as a good opportunity to look for SELL setups, targeting 3278 and 3255.
As previously analyzed, SELL zones are clustered around key resistance levels. Traders should closely watch price reactions in these areas for potential entry signals.
🔹 Breakout key level: 3296
🔹 Support zones: 3278 – 3255
🔹 Resistance zones: 3300 – 3312 – 3325 – 3336 – 3348 – 3363