#NIFTY Intraday Support and Resistance Levels - 27/06/2025Nifty is expected to open with a strong gap up near the 25,750 level, indicating bullish sentiment continuation from the previous sessions. If Nifty sustains above this 25,750 mark, it could trigger a breakout setup. In that case, long positions can be considered above 25,750 with targets placed at 25,850, 25,900, and 25,950+. This zone aligns with a potential resistance-turned-breakout level, and a move beyond it could bring in further momentum on the upside.
On the other hand, if Nifty fails to hold above the 25,750 level and shows signs of rejection, then it may consolidate or experience mild profit booking. Key intraday support lies near the 25,550–25,600 range. A break below this can drag the index down to 25,450 or even 25,250.
Priceactionanalysis

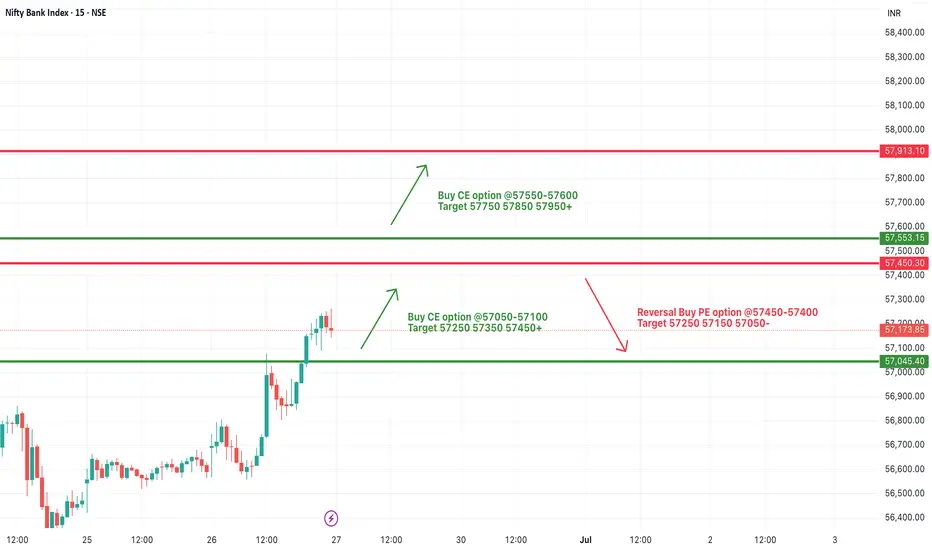
[INTRADAY] #BANKNIFTY PE & CE Levels(27/06/2025)Bank Nifty is expected to open with a strong gap up near the 57,500 level, indicating continued bullish sentiment from the previous session’s upward momentum. The index is currently trading above key support levels, and if it manages to sustain above the 57,450–57,500 zone, a further upward move is likely. In such a case, traders can consider buying CE options around 57,550–57,600 for targets of 57,750, 57,850, and 57,950+. This zone will act as a potential breakout area, and sustaining above it could trigger fresh buying interest.
However, if Bank Nifty fails to hold above the 57,450 level after the gap up, some profit booking or reversal may occur. In that scenario, a put option opportunity may arise near the 57,450–57,400 levels with downside targets of 57,250, 57,150, and 57,050.
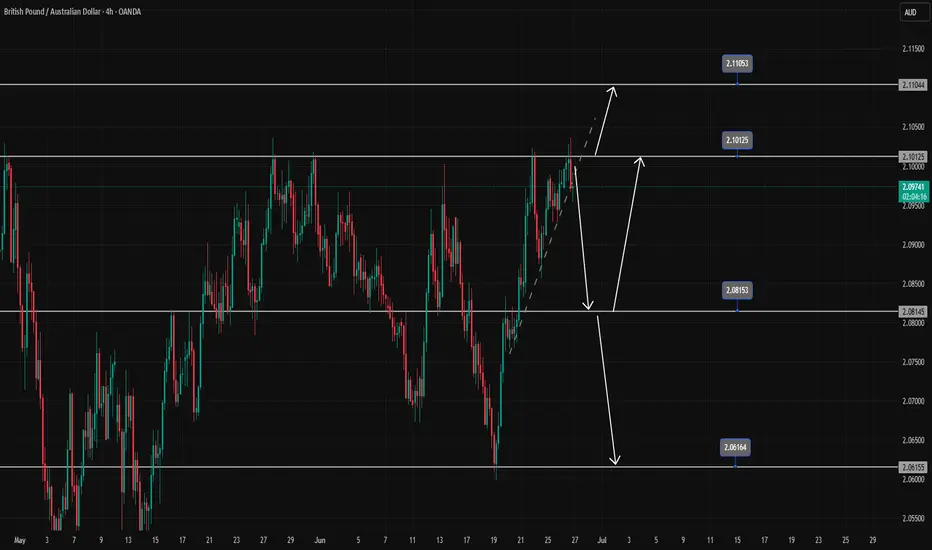
GBPAUD Refuses to Make New Weekly HighsFailed to trade above the resistance zone of 2.101
Currently, the weak reaction at the trendline suggests that it will be difficult for the pair to push higher.
If the trendline breaks, the downtrend may extend toward 2.08100 — a level where buyers are likely to step back into the market.
We are waiting for further price action around the 2.081 support zone to look for new trade signals.
If this level is broken, 2.061 will become the next target for all SELL positions.
On the contrary, if the price bounces from 2.081, strong buying momentum could emerge and potentially break through the 2.101 resistance, targeting 2.110.
Amd - This is just the beginning!Amd - NASDAQ:AMD - perfectly plays out:
(click chart above to see the in depth analysis👆🏻)
Despite the harsh drop of about -65% which we have been witnessing starting back in 2024, Amd remains bullish. Just three months ago, Amd retested a textbook confluence of support. We saw bullish confirmation, the bottom is in and Amd will rally significantly from here.
Levels to watch: $200, $300
Keep your long term vision!
Philip (BasicTrading)

NUVAMA : Opened a position with 1% riskEntered the position immediately at the close of the strong bullish momentum candle that broke the ATH levels.
📢📢📢
If my perspective changes or if I gather additional fundamental data that influences my views, I will provide updates accordingly.
Thank you for following along with this journey, and I remain committed to sharing insights and updates as my trading strategy evolves. As always, please feel free to reach out with any questions or comments.
Other posts related to this particular position and scrip, if any, will be attached underneath. Do check those out too.
Disclaimer : The analysis shared here is for informational purposes only and should not be considered as financial advice. Trading in all markets carries inherent risks, and past performance is not indicative of future results. It’s essential to conduct your own research and assess your risk tolerance before making any investment decisions. The views expressed in this analysis are solely mine. It’s important to note that I am not a SEBI registered analyst, so the analysis provided does not constitute formal investment advice under SEBI regulations.

26.06.25 Morning ForecastPairs on Watch -
FX:EURUSD
FX:EURCAD
FX:GBPCAD
A short overview of the instruments I am looking at for today, multi-timeframe analysis down to what I will be looking at for an entry. Enjoy!

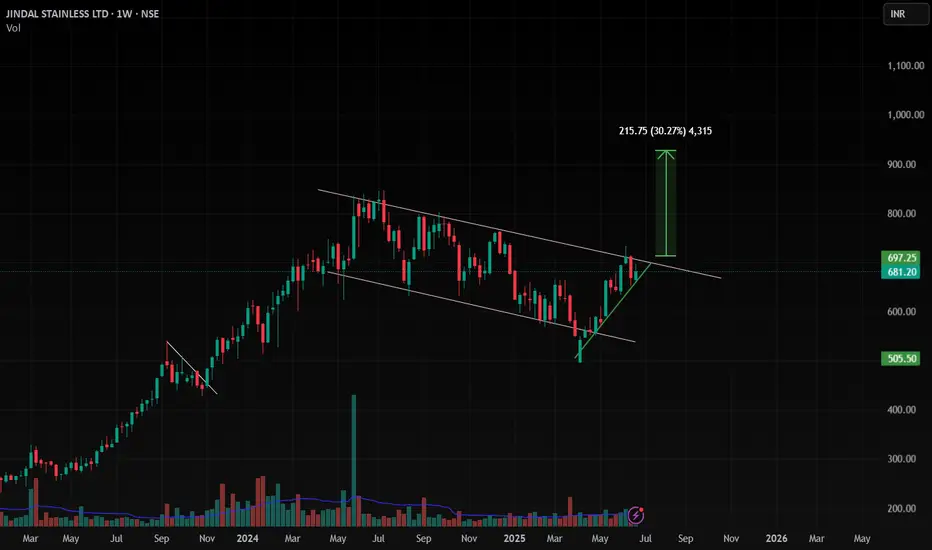
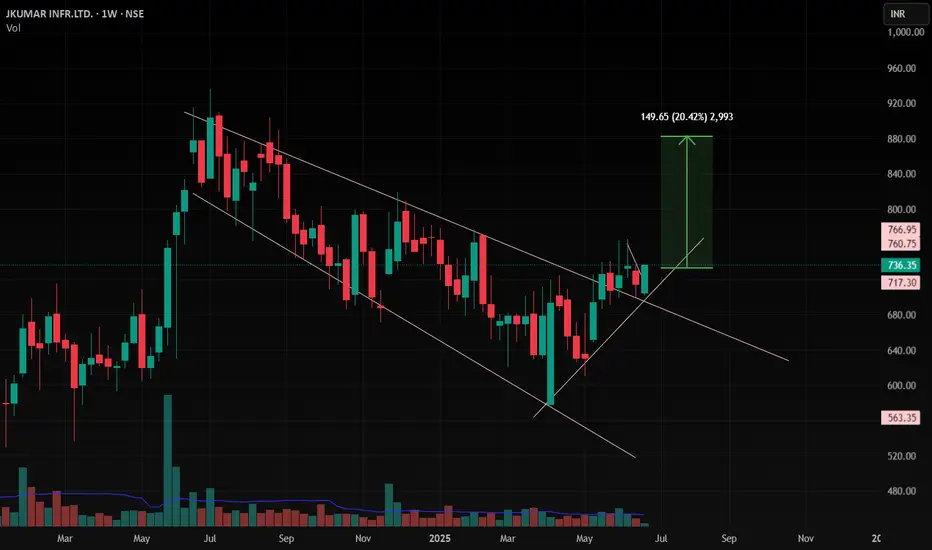
JSL , 1W Pattern is looking soo good and it is ready to Breakout from this pattern ,
do not enter into this until it give a Good Weekly close , if you enter it can be a trap also , so enter after Confirmation and Risk according to your Capital .
Follow for More Swing Ideas Like this
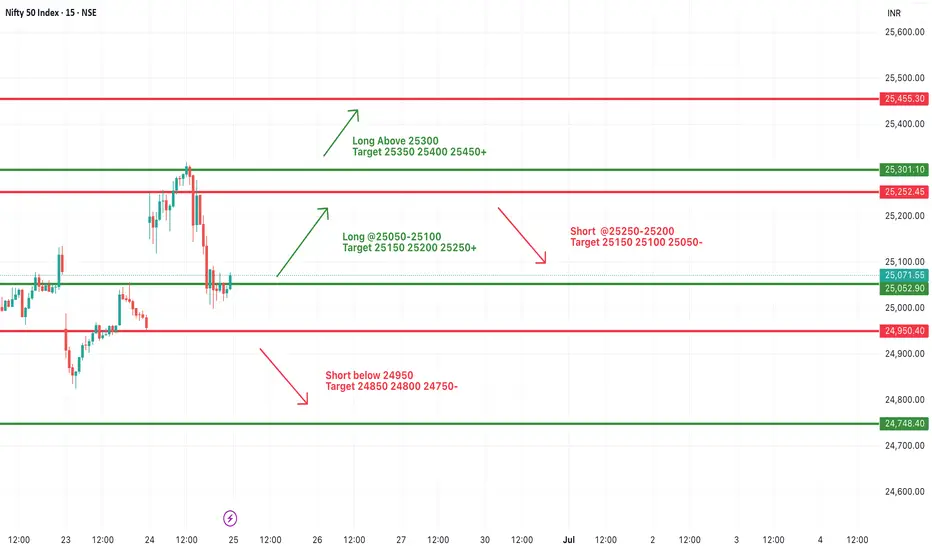
#NIFTY Intraday Support and Resistance Levels - 26/06/2025Nifty is set to open slightly gap up today near the 25,250 mark, signaling a continuation of the ongoing consolidation phase. The market has been hovering around this zone for the past couple of sessions, making it a key inflection point. A sustained move above 25,300 can trigger bullish momentum, leading to targets of 25,350, 25,400, and 25,450+. This level also coincides with previous intraday highs, making it a potential breakout zone for aggressive buyers.
On the flip side, if Nifty faces rejection from this resistance zone and slips below the 25,250–25,200 levels, a downside move could emerge. In that case, short positions can be considered with immediate support levels at 25,150, 25,100, and 25,050. The opening hour will be crucial—traders should monitor for either a breakout above 25,300 or a breakdown below 25,200 to determine intraday direction. Volatility may increase due to expiry, so a wait-and-watch approach with tight stop-losses is advisable.

[INTRADAY] #BANKNIFTY PE & CE Levels(26/06/2025)Today, Bank Nifty is likely to open slightly gap up near the 56,550–56,600 zone, which is a crucial resistance area. A sustained move above this zone can trigger bullish momentum, opening the door for further upside targets of 56,750, 56,850, and potentially 56,950+. Traders can look for buying opportunities in call options above this range with a tight stop-loss, especially if the index breaks out with strong volume and positive sentiment. The zone between 56,600 and 56,950 has acted as a resistance band in recent sessions, so a clean breakout may lead to a directional rally.
On the flip side, if Bank Nifty fails to hold above the 56,450 mark and starts to trade below it, we may see downside pressure in the market. This breakdown could offer a good short opportunity using put options, with downside targets around 56,250, 56,150, and 56,050. The 56,050 level will act as a strong support and could attract buyers again if tested. Traders should remain cautious near resistance and support zones and avoid aggressive positions unless there is clear confirmation. The market may remain volatile in the first half, so a wait-and-watch approach with disciplined risk management is advisable.

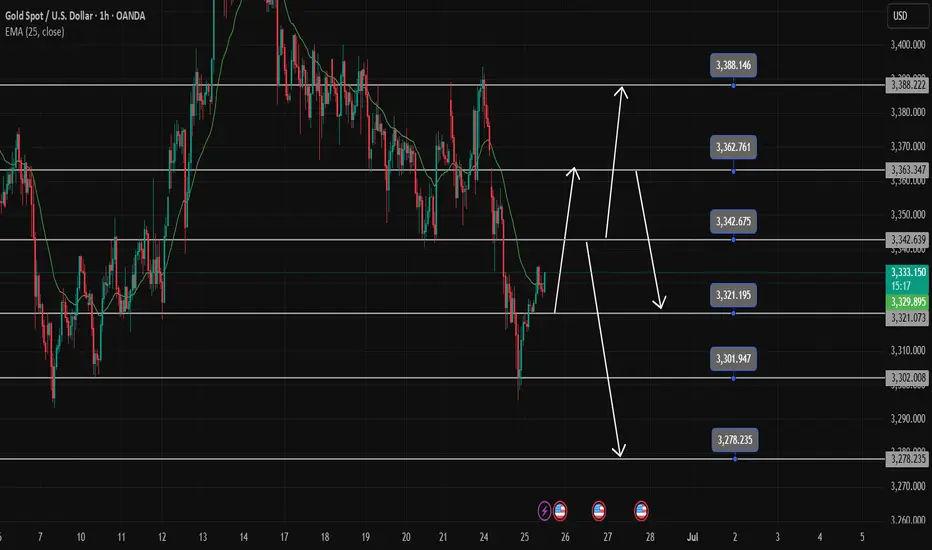
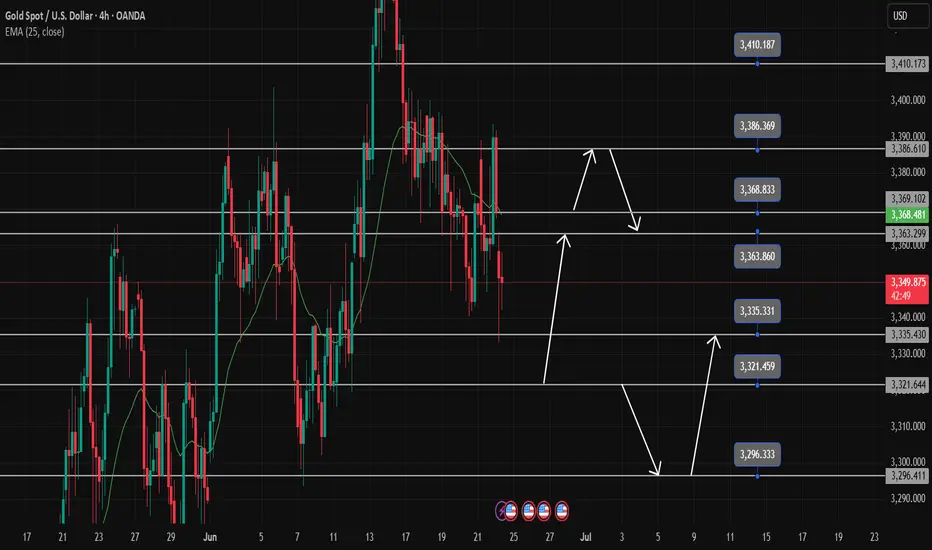
Gold Trading Strategy June 25The Daily Candle shows a strong selling force breaking out of the 3-day accumulation zone. Gold touches the support zone of 3296 and bounces back as analyzed yesterday. Today, it is difficult for the bullish force to return, there is a possibility of an increase in the Asian session and the European session, and the US session will return with the Selling force.
The recovery from 3296 towards 3342, some selling force may appear around 3342, forming a strong bearish structure. The bearish wave structure will weaken if it breaks 3342. The 3363 area still has a reaction but the bearish wave structure is no longer strong.
The market closed above 3363 confirming the downtrend break and heading towards the resistance zone of 3388. The bottom support of 3302 will help to temporarily stop the price decline before heading towards the target of 3278.
Support: 3321-3302-3278
Resistance: 3342-3363-3388
Break out: 3342-3322
Recommended trading signal
BUY GOLD 3302-3300 SL 3297
SELL GOLD 3363-3365 SL 3369
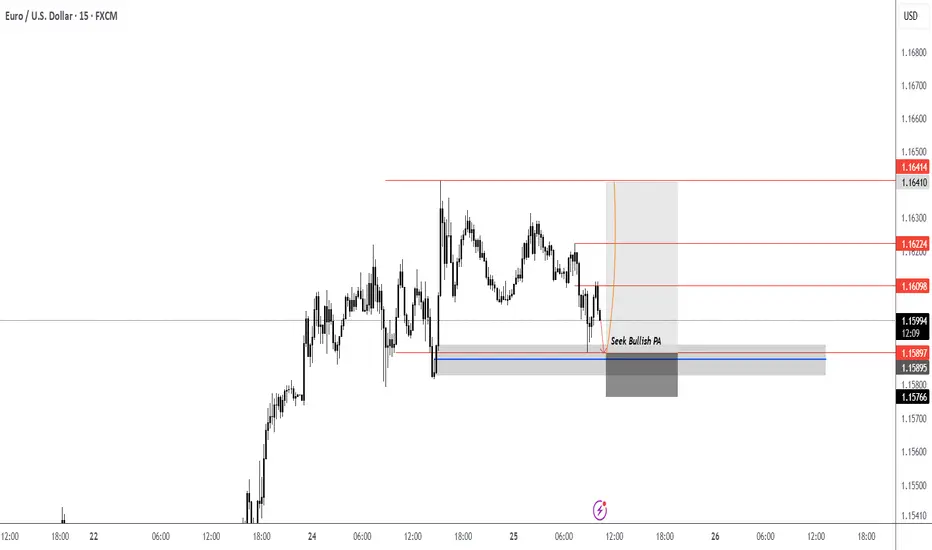
EURUSD - Looking to the upside retest of SupplyLooking to the upside, first lets get that push to lower level of liquidity swing then a push to the upside. Only on bullish confirmation at our highlighted level. I think we have one more retest before catching a potential short (pullback) on the larger time frame. Long term target for EURUSD is 1.200.
25.06.25 Morning ForecastPairs on Watch -
FX:AUDUSD
FX:NZDUSD
FX:EURAUD
A short overview of the instruments I am looking at for today, multi-timeframe analysis down to what I will be looking at for an entry. Enjoy!

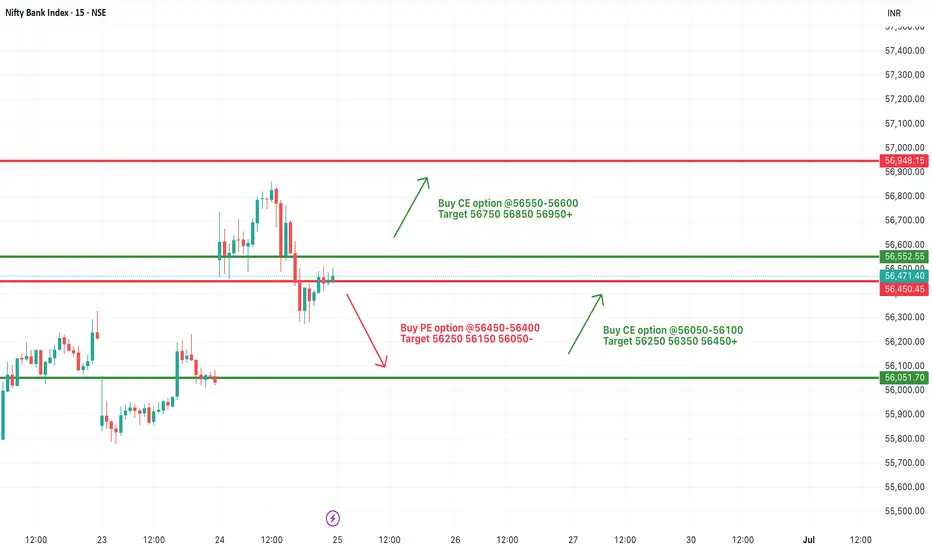
[INTRADAY] #BANKNIFTY PE & CE Levels(25/06/2025)Bank Nifty is expected to open slightly gap up near the 56,450 level. If the index sustains above 56,450, we may see a bullish continuation toward 56,550 and above. A move above the 56,550–56,600 zone can trigger further upside momentum with targets at 56,850, 56,950, and potentially 57,000+.
However, if Bank Nifty fails to hold above 56,450 and starts trading below 56,400, a short opportunity could arise. In that case, downside targets would be 56,250, 56,150, and 56,050. The 56,050 level will act as strong support for today's session, and only a break below this may invite a deeper correction.
#NIFTY Intraday Support and Resistance Levels - 25/06/2025Nifty is expected to open with a gap-up near the 25,250 level, signaling early bullish strength. If the index sustains above the 25,250–25,300 zone after opening, we could see a continuation of the upward momentum toward the next resistance levels at 25,350, 25,400, and possibly 25,450+. However, if it fails to hold above 25,250 and slips back into the 25,100–25,050 zone, there could be selling pressure. A break below 25,050 may drag Nifty further down to 24,950. If 24,950 breaks, then a short trade could trigger, with targets at 24,850, 24,800, and 24,750. The key levels to watch today are 25,250 on the upside and 24,950 on the downside.
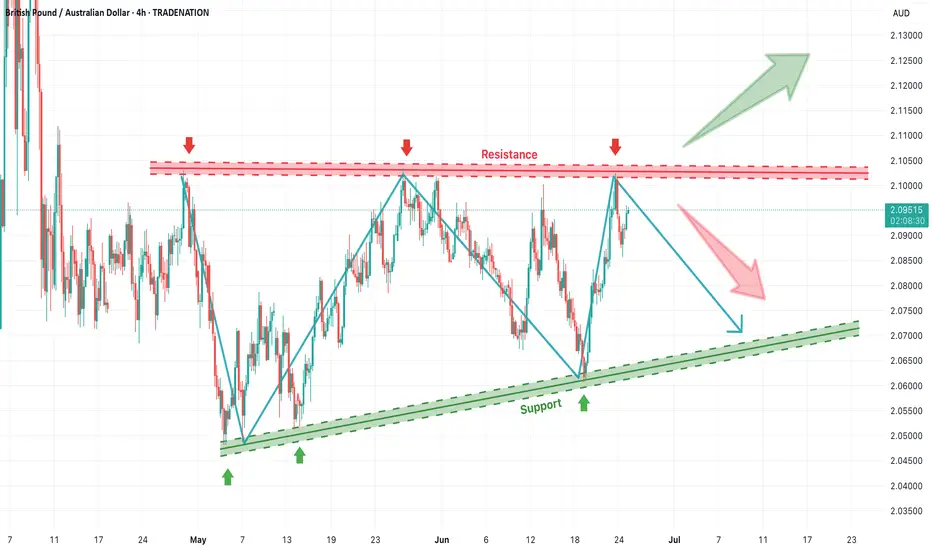
GBP/AUD Triple-Top Resistance Test – Watch for Reversal or BreakThe GBP/AUD pair is currently testing a strong horizontal resistance zone near 2.1000, which has been rejected multiple times in the past. The chart clearly highlights a triple-top formation (marked by red arrows), signaling repeated failures to break above this supply area. Meanwhile, the price action has been respecting an upward trendline support, forming a broad ascending channel or rising wedge-like structure.
This setup is now at a critical juncture — with the potential for either a strong bullish breakout or a bearish reversal.
📉 Bearish Rejection Scenario
If the resistance holds once again, we may see a pullback toward the rising support line around 2.0700. This would maintain the overall sideways-to-bullish bias within the structure. A firm rejection pattern (e.g., bearish engulfing or long upper wick) near 2.1000 could provide confirmation for short entries targeting that support.
📈 Bullish Breakout Scenario
On the other hand, a decisive breakout above 2.1000 — especially with strong volume and candle close — could trigger a breakout rally. If confirmed, the next leg up may drive GBP/AUD toward 2.1250–2.1300, based on the previous swing expansion zones.
🧭 Strategic Outlook
Sell near resistance: Target 2.0750–2.0700 with SL above 2.1020.
Buy on breakout: Enter above 2.1010–2.1025 with targets near 2.1250.
Confirmation required: Wait for candle confirmation (break or rejection) before acting.
This setup offers a clear risk-managed opportunity in either direction, ideal for breakout traders or reversal players.
=================================================================
Disclosure: I am part of Trade Nation's Influencer program and receive a monthly fee for using their TradingView charts in my analysis.
=================================================================
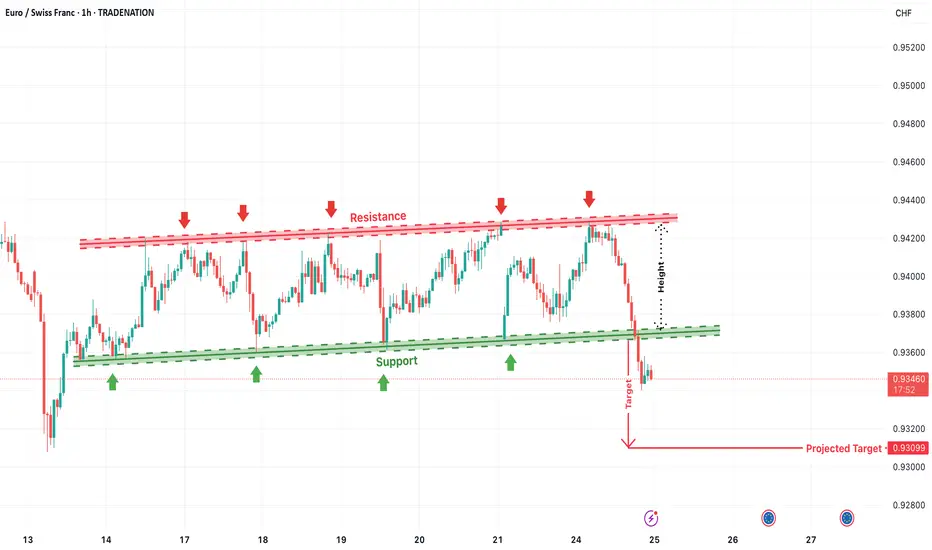
EUR/CHF Channel Breakdown – Bearish MomentumThe EUR/CHF pair has broken down from a well-defined ascending parallel channel, indicating a shift in market structure and a possible continuation to the downside. The price had been consistently respecting the resistance zone near 0.9435–0.9440 (marked in red) and the support zone near 0.9375–0.9380 (marked in green), forming an upward-sloping consolidation channel.
After multiple rejections at the upper resistance, the price decisively broke below the support line with strong bearish momentum, confirming a bearish breakout from the channel.
🔻 Breakdown Implication
The height of the channel—measured from the support to the resistance—has been used to project the next potential downside target. The projected breakdown target is marked near 0.9309, which aligns with historical price reaction zones and provides a clean structure-based price objective.
This suggests the bearish move could extend further in the coming sessions unless the price quickly recovers and climbs back above the broken support, which would invalidate the breakdown structure.
🧠 Trading Outlook
Bias: Bearish after confirmed breakdown from channel
Entry (if not in already): Consider selling on retest of broken support (~0.9375)
Target: 0.9309 (based on channel height)
Stop Loss: Above 0.9390–0.9400 (above breakdown point)
This setup is ideal for momentum traders looking to capitalize on trend continuation after a failed bullish structure.
=================================================================
Disclosure: I am part of Trade Nation's Influencer program and receive a monthly fee for using their TradingView charts in my analysis.
=================================================================
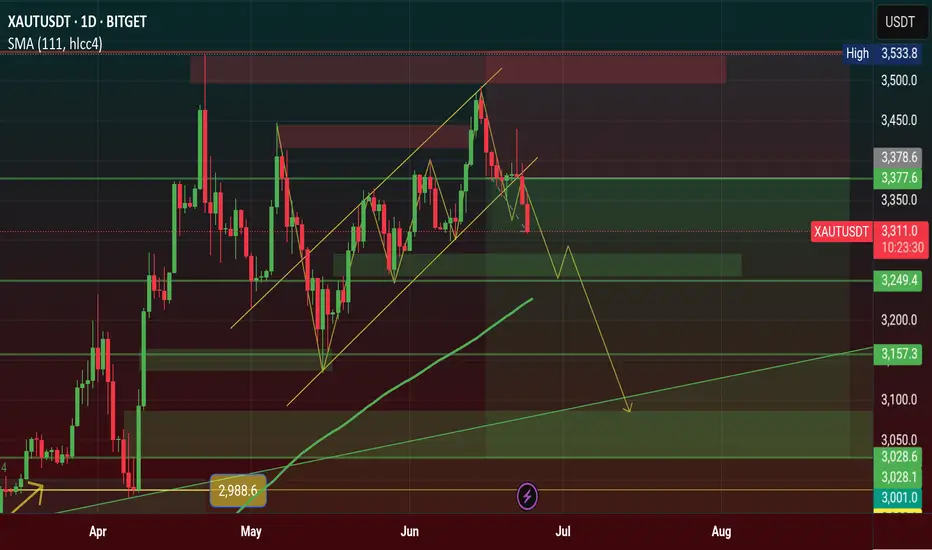
$XAU Showing Bearish Flag Pattearn & Dropped $3K Support area...TVC:XAU Showing Bearish Flag Pattearn & Dropped $3K Support area. Price dropping now and back to $3K price level area. price FVG touch and Strong support $3K Price Level area. Here is many support Holder.
Stoploss: $3,536
Entry: $3,377
1st Target point $3,377
2nd Target point $3,249
3rd Target point $3,028
Disclaimer: This article is for informational purposes only and does not constitute financial advice. Always conduct your own research before making any investment decisions. Digital asset prices are subject to high market risk and price volatility. The value of your investment may go down or up, and you may not get back the amount invested. You are solely responsible for your investment decisions and Binance is not available for any losses you may incur. Past performance is not a reliable predictor of future performance. You should only invest in products you are familiar with and where you understand the risks. You should carefully consider your investment experience, financial situation, investment objectives and risk tolerance and consult an independent financial adviser prior to making any investment.
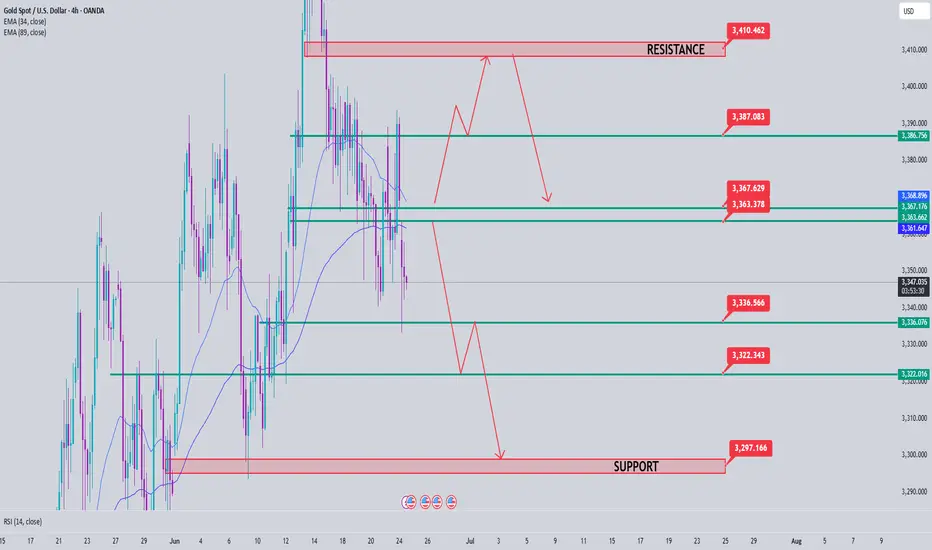
Gold Trading Strategy June 24Quite surprised with the price gap down at the beginning of the day. A sweep to 3333 and recovery to increase again in the Tokyo trading session.
This recovery completely breaks the market's bullish wave structure.
3363 and 3335 are paying attention in today's Asian and European trading sessions. This area can be traded short-term in the sideways range. The SELL area pays attention to the opening gap at 3368.
The upper range has some adjustments compared to yesterday in the direction of decreasing prices, so the SELL range 3386 and 3410 is paid attention to for trading.
Resistance: 3363-3368-3386-3410
Support: 3335-3322-3296
Good trading signal
BUY GOLD 3323-3321 Stoploss 3318
SELL GOLD 3363-3365 Stoploss 3370
24.06.25 Morning ForecastPairs on Watch -
FX:AUDNZD
FX:USDJPY
FX:EURCAD
A short overview of the instruments I am looking at for today, multi-timeframe analysis down to what I will be looking at for an entry. Enjoy!

Gold Price Analysis June 24Quite a surprise with a price gap down at the beginning of the day. A sweep to 3333 and a recovery to increase again in the Tokyo trading session.
This recovery to increase completely breaks the market's bullish wave structure.
3363 and 3335 are being watched in the Asian and European trading sessions today. This zone can be traded short-term in the sideways range. The SELL zone pays attention to the opening gap at 3368.
The upper range has some adjustments compared to yesterday in the direction of decreasing prices, so the SELL range 3386 and 3410 is being watched for trading. Support is still held as yesterday at the 3322 and 3296 zones.
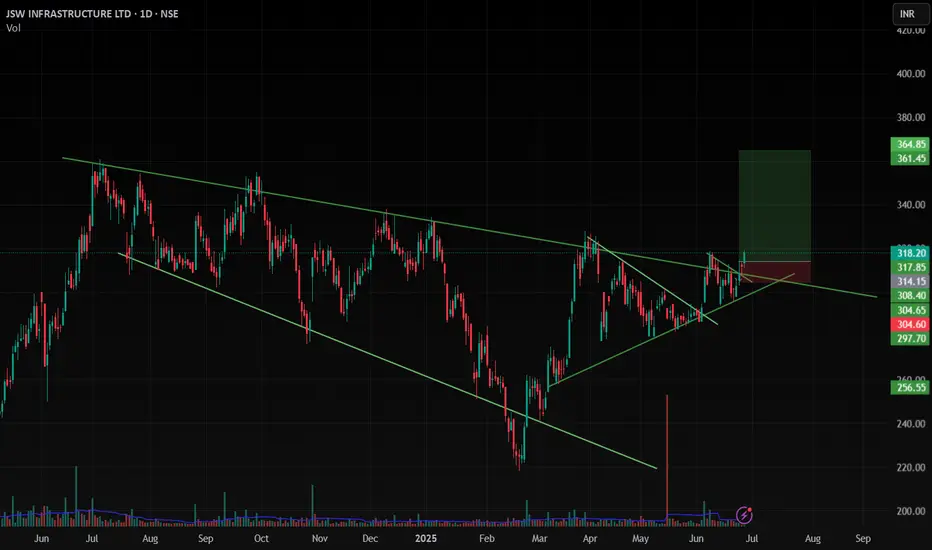
JKIL , Bullish A Very Good Pattern Breakout and come at Retest of Upper Trendline , and at Retest in 1D and Weekly supporting 20 EMA and Sustaining Above that , so we can Expect A Bullish Move in this Stock , As Nifty also giving good bullish move .
Follow for more Swing Ideas Like this
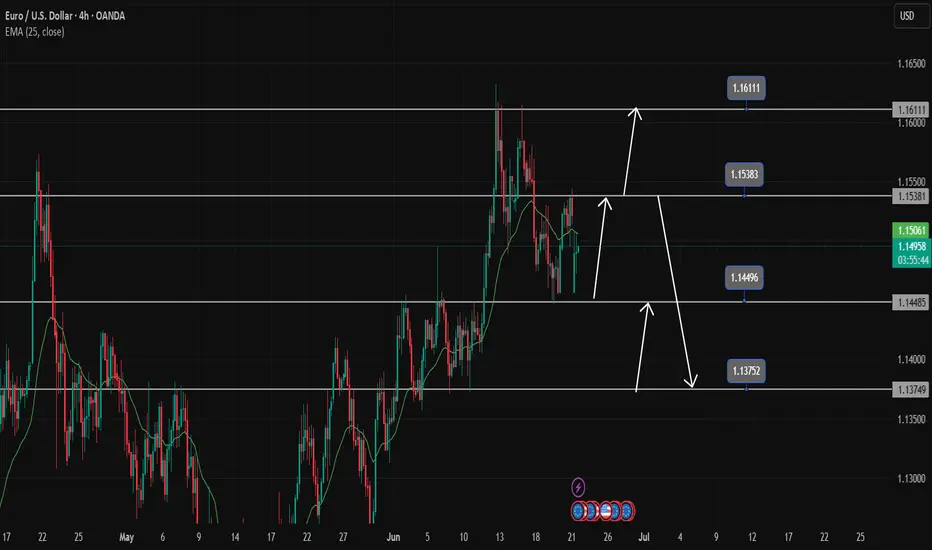
EURUSD Trading Strategy for the WeekEURUSD is reacting at the support zone of 1.14500. This is an important support zone that helps EURUSD continue to maintain its upward momentum. The uptrend in the h4 time frame is still strong and heading towards the peak of 1.161.
Below the support of 1.145 will be the 1.138 zone. When this 1.138 zone is broken, it confirms that a Downtrend is established. The possibility of breaking this zone is not high, so it is still possible to set BUY signals around these support zones. On the other hand, 1.153 is an important resistance zone in the near future where the pair will have a price reaction before finding the peak of last week.
Support: 1.13800
Resistance: 1.16000
Break out: 1.14600-1.15300
Recommended good trading strategy:
Trade when price confirms in Break out zone.
BUY 1.13800-1.13600 Stoploss 1.13300
SELL 1.16000-1.16200 Stoploss 1.16500