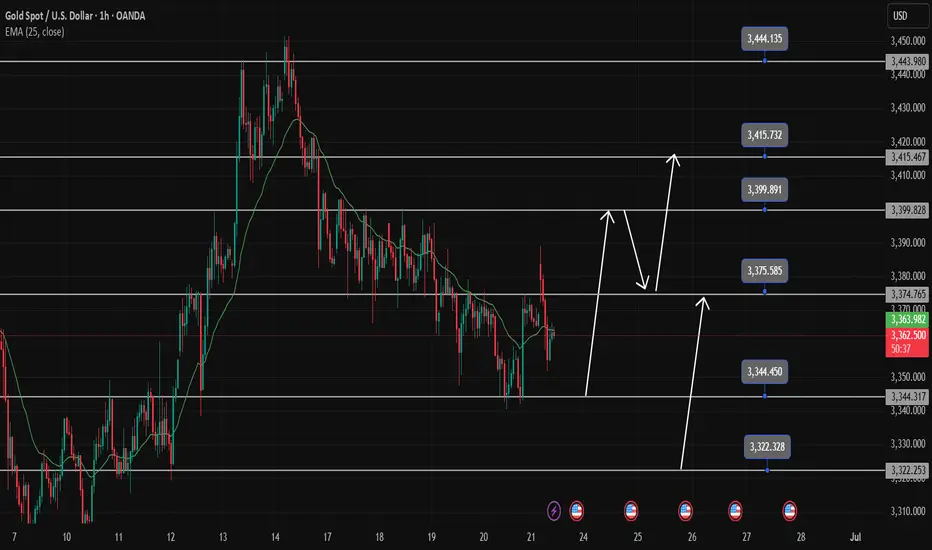
Gold Trading Strategy June 23The last two D1 candles have continuously drawn out the wicks. The Sellers may no longer be interested in dominating the market.
Currently, Gold is moving sideways in a wide range. 3345 and 3375 are the two Breakout zones of the gold price in today's trading day. When breaking out of the breakout zone, the price will continue its strong trend. Limit trading against the trend when the price breaks out.
Trading signals may also appear if there is confirmation from the candle that does not break out of this breakout zone.
Resistance and support zones remain the same as last week.
Resistance 3400-3415-3443
Support 3322-3296
Break out: 3375-3345
Recommended good trading signals
SELL 3399-3401 Stoploss 3405
BUY 3322-3320 Stoploss 3306
Priceactionanalysis
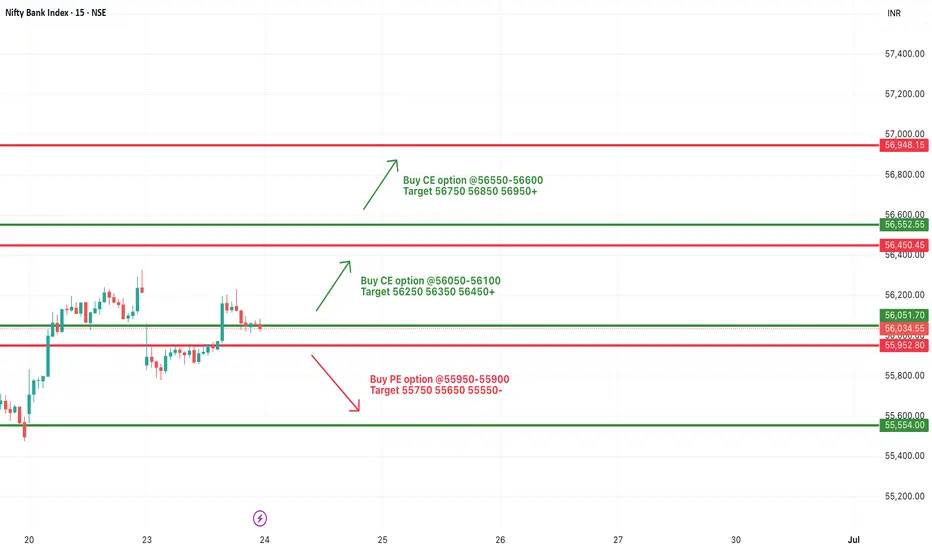
[INTRADAY] #BANKNIFTY PE & CE Levels(24/06/2025)Today, a gap-up opening is expected in Bank Nifty near the 56,500 level. This zone lies close to a crucial resistance level, so price action after opening will be key. If Bank Nifty sustains above the 56,550–56,600 zone, it could trigger a strong upside rally toward 56,750, 56,850, and potentially 56,950+ levels. On the other hand, if it fails to hold above 56,000 and starts slipping below the 55,950–55,900 zone, a downside move is likely, which could push the index toward 55,750, 55,650, and 55,550 levels.
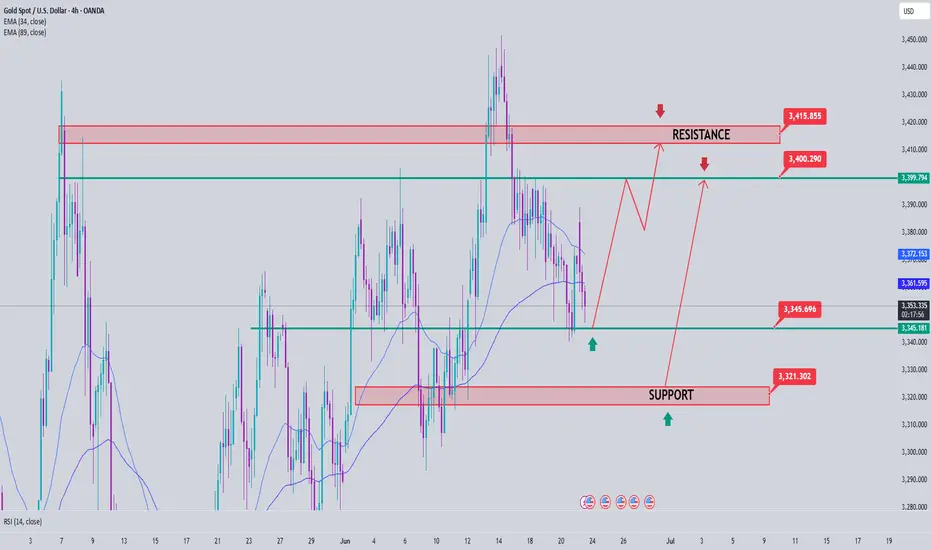
Gold price analysis June 23The last two D1 candles have continuously withdrawn their wicks. The Sellers may no longer be interested in dominating the market.
Currently, Gold is moving sideways in a wide range. 3345 and 3375 are the two Breakout zones of the gold price in today's trading day. When breaking out of the breakout zone, the price will continue its strong trend. Limit trading against the trend when the price breaks out.
Trading signals may also appear if there is confirmation from the candle that does not break out of this breakout zone.
The resistance and support zones remain the same as last week. The upper limit is at 3400 and 3415. The lower limit is still at 3322 and 3296
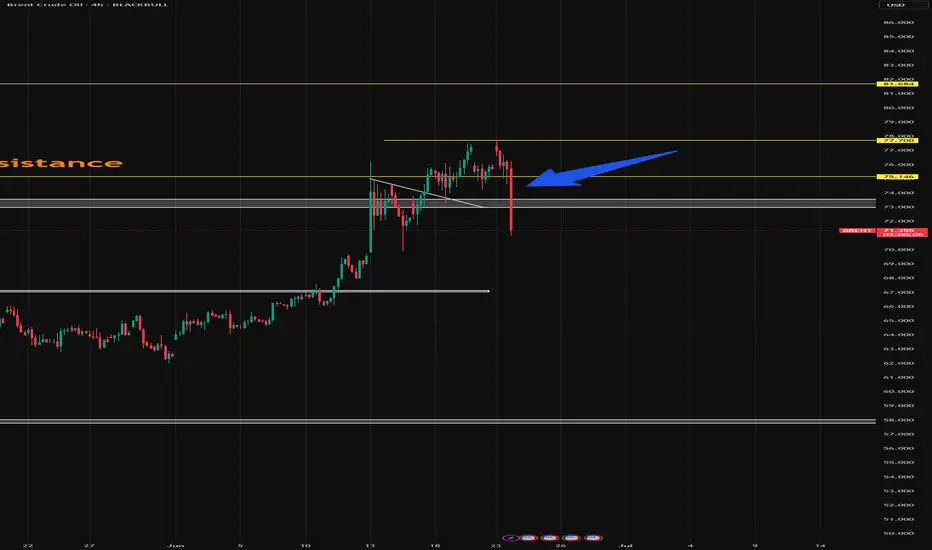
Brent oilOil prices fell! Trump's tweet sent oil prices lower. But the last three candles were probably because the market was expecting a stronger reaction from Iran, but it is likely that the US will not respond again.
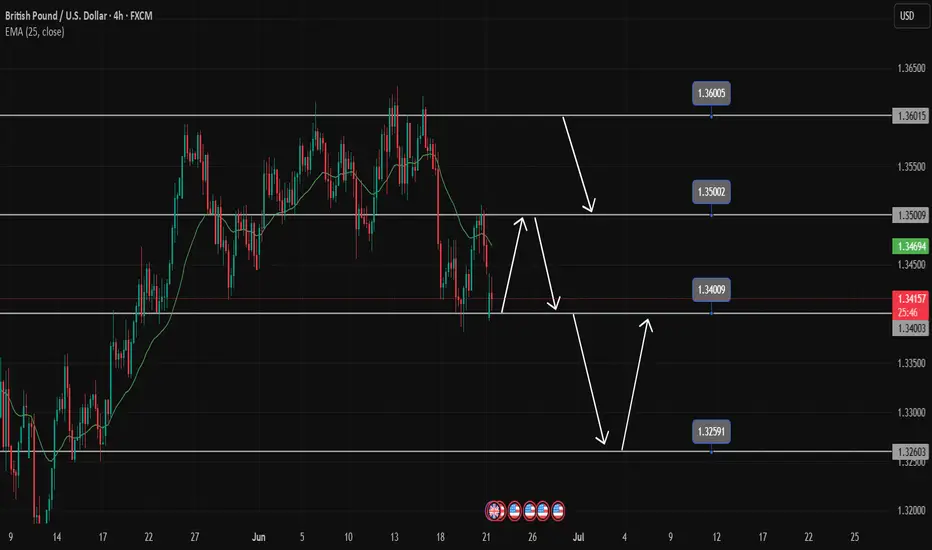
GBPUSD Trading Strategy for the WeekGBPUSD is reacting at the support zone of 1.34000. This is the last important support zone that the pair is facing. If this support zone is broken, the pair will enter a prolonged Downtrend phase. 1.325 could be the target for this decline.
If the 1.34000 zone is pushed up by buyers, the pair will touch the 1.35000 border zone. If this zone is broken, the pair will form a double bottom pattern and continue to increase back to the peak of last week around 1.36000. In case the buying force is not strong enough to break 1.35000, the pair will return to the sideway in the rectangular border.
Support: 1.32500
Resistance: 1.36000
Break out: 1.34000-1.35000
Recommended good trading strategy:
Trade when price confirms in Break out zone.
BUY 1.32600-1.32400 Stoploss 1.32000
SELL 1.35900-1.36100 Stoploss 1.36400
GBP/USD Downtrend Wedge Breakout Setup – Bullish Target AheadThe GBP/USD pair is currently displaying a downtrend wedge pattern, a structure that typically signals a bullish reversal when confirmed. The pattern is formed by a descending resistance trendline (in red) and a gradually sloping support line (in green), converging to a point. Price has bounced off the wedge’s support multiple times while forming lower highs, creating pressure that often leads to a breakout.
As seen in the chart, the pair recently surged toward the upper resistance line and is now attempting to break above it. A successful breakout with bullish candle confirmation could lead to a strong move upward.
📈 Breakout Scenario
If the price manages to close above the resistance zone (~1.3490–1.3500), it would confirm the wedge breakout. Based on the height of the pattern, the projected breakout target is around 1.3692. This target is calculated by measuring the vertical height of the wedge and adding it to the breakout point. Confirmation of breakout should ideally include a retest of the broken resistance acting as new support.
📉 Rejection Scenario
However, if the breakout attempt fails and the price gets rejected again from the red resistance line, the pair could retest the wedge’s support area around 1.3360. A breakdown below the green zone would invalidate the bullish outlook and suggest continued bearish pressure.
⚙️ Strategy Tips
Buy Setup: Enter after breakout candle closes above 1.3500 with stop loss just below breakout zone.
Take Profit: Use the 1.3692 level as the primary target or scale out on the way up.
Confirmation: Always wait for breakout confirmation before entering; avoid false breakouts.
✅ Conclusion
This wedge breakout setup offers a bullish trading opportunity if confirmed. The clear structure, repeated tests of both support and resistance, and recent momentum build a strong technical case. Still, confirmation is key before initiating any positions.
=================================================================
Disclosure: I am part of Trade Nation's Influencer program and receive a monthly fee for using their TradingView charts in my analysis.
=================================================================

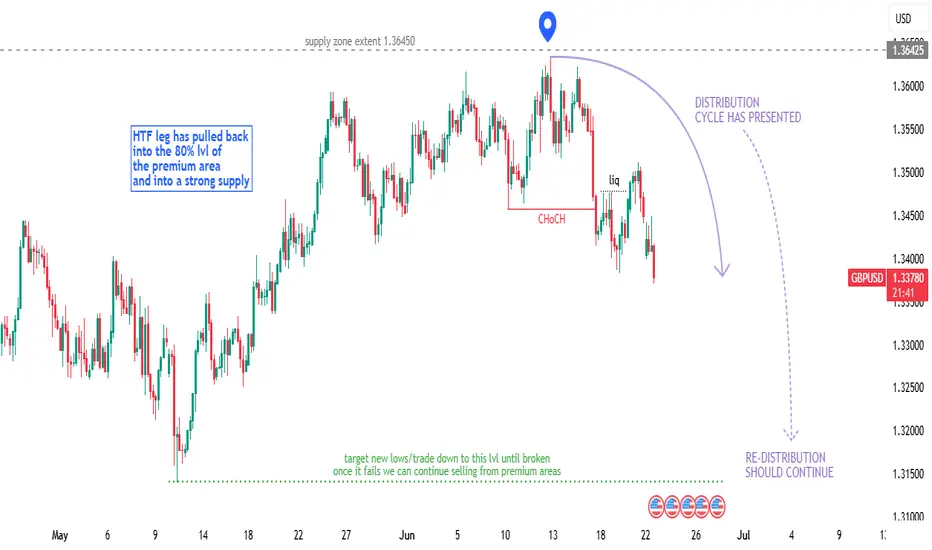
GBPUSD - Technical Outlook (Long + Short Term)In this article, I’ll share my current outlook on GBPUSD, highlighting both higher time frame (HTF) and intraday considerations.
Higher Time Frame Analysis
The overall trend remains bearish. Price is still trading within the previous structural leg, with the key level at 1.42500. Unless we see a decisive break above this level, my bias will remain bearish for this pair.
Recently, we’ve witnessed what looks like institutional manipulation to the upside, followed by a sharp bearish reaction from the weekly supply zone. This price action aligns with a classic Wyckoff distribution cycle, which often signals that the prevailing trend is likely to continue.
Intraday Advice
For short-term traders, it’s best to wait for lower time frame (LTF) pullbacks and signs of manipulation before considering short positions. If price continues to push lower, there should be opportunities to ride the trend down over the coming weeks, with multiple entry points along the way.
Trading Considerations
If this analysis plays out, there’s potential to maximize gains through both swing and intraday trades. However, patience and risk management are key. Losses are inevitable - what matters is managing risk and staying disciplined.
Key Points to Remember:
Wait for clear pullbacks before entering trades.
Stick to your risk management plan.
Stay patient and let the market come to you.
This is an exciting time to trade FX:GBPUSD , but always assess if the risk is worth the reward before entering any position.
Happy hunting predators...
Apex out!
EURUSD Long As the war escalated over the weekend market gapped during Asia session invalidating our initial forecast. (Linked Idea). Looking for the long on EURUSD.

Quick Forex Market Overview | USDJPY, GBPUSD, CADJPY, EURUSD...In this video, I give an unstructured but insightful overview of the current market conditions across several major forex pairs. I walk through key price action and technical levels on USDJPY, GBPUSD, CADJPY, EURJPY, EURUSD, and EURAUD — sharing what I’m seeing in the moment and how the setups are developing.
Perfect if you're looking for a raw, real-time perspective without the fluff.

23.06.25 Morning ForecastPairs on Watch -
FX:EURAUD
FX:EURNZD
FX:EURUSD
A short overview of the instruments I am looking at for today, multi-timeframe analysis down to what I will be looking at for an entry. Enjoy!

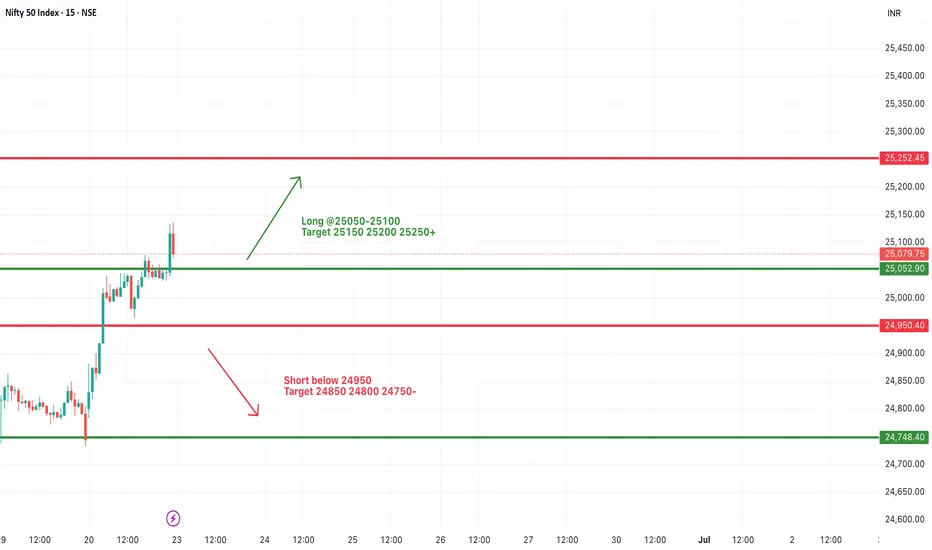
#NIFTY Intraday Support and Resistance Levels - 23/06/2025A flat opening is expected in Nifty today. If Nifty sustains above the 25,050–25,100 zone after the open, we can expect an upside rally toward 25,150 → 25,200 → 25,250+ levels. This bullish momentum may continue if Nifty remains strong above 25,100.
However, any downside momentum may begin if Nifty starts trading below 24,950, which is a crucial support zone. In such a scenario, the index could slip toward 24,850 → 24,800 → 24,750- levels.
For intraday trades, focus on breakout or breakdown levels, and manage risk with trailing stop-losses in place.
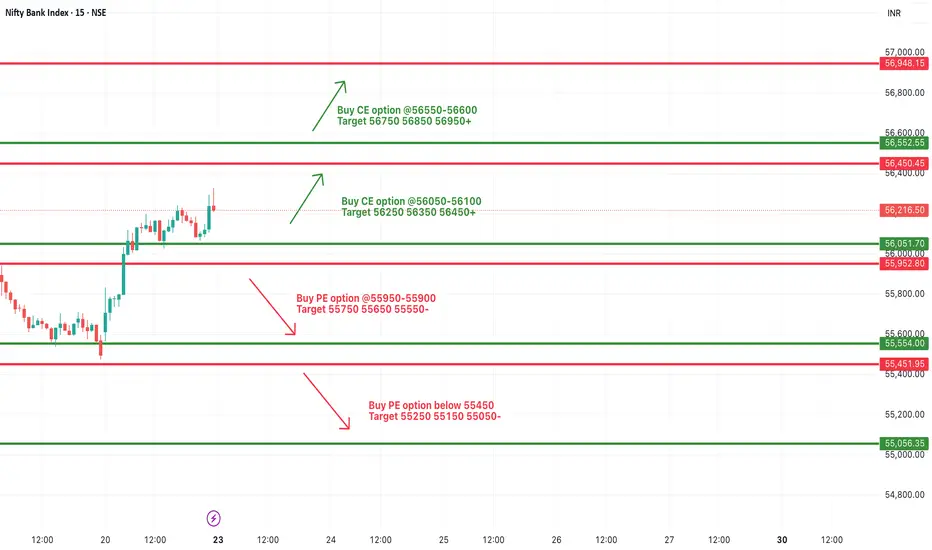
[INTRADAY] #BANKNIFTY PE & CE Levels(23/06/2025)A flat opening is expected in Bank Nifty today. After the open, if Bank Nifty sustains above 56,050, an upside rally is likely toward 56,450+. A further continuation of this rally could occur if the index trades above 56,550–56,600, with extended targets up to 56,750 → 56,850 → 56,950+.
On the downside, if Bank Nifty trades below 55,950, some selling pressure may emerge. However, 55,550 will act as strong support for today’s session. A major downward move is only expected if this support breaks, opening potential targets of 55,250 → 55,150 → 55,050-.
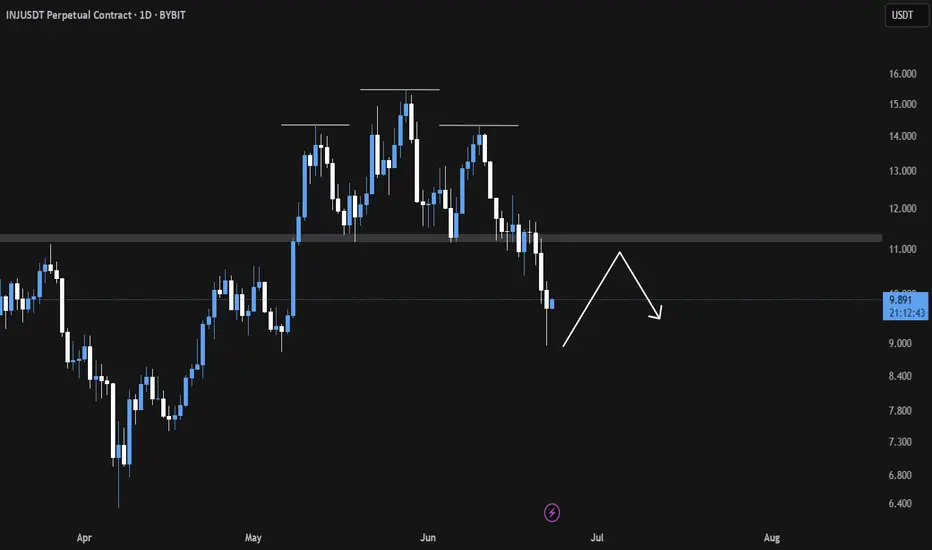
INJ Breakdown in Play Eyeing the Neckline for Precision ShortsINJ/USDT Analysis
〽️ The Head and Shoulders pattern has broken down successfully, confirming a bearish structure.
💠We anticipate a potential relief bounce towards the $11 region which aligns closely with the neckline retest zone. This area is likely to act as a liquidity trap, where institutional sellers may re-enter aggressively 👀.
🎯 Key downside targets remain at
1. $8.98
2. $8.03
3. $6.92
Strategic Plan 🎖️
Look to initiate short positions around the neckline retest near $11, as the risk-reward becomes increasingly favorable from that level.
Trade with discipline. Let the structure lead the execution. 🫡🧠
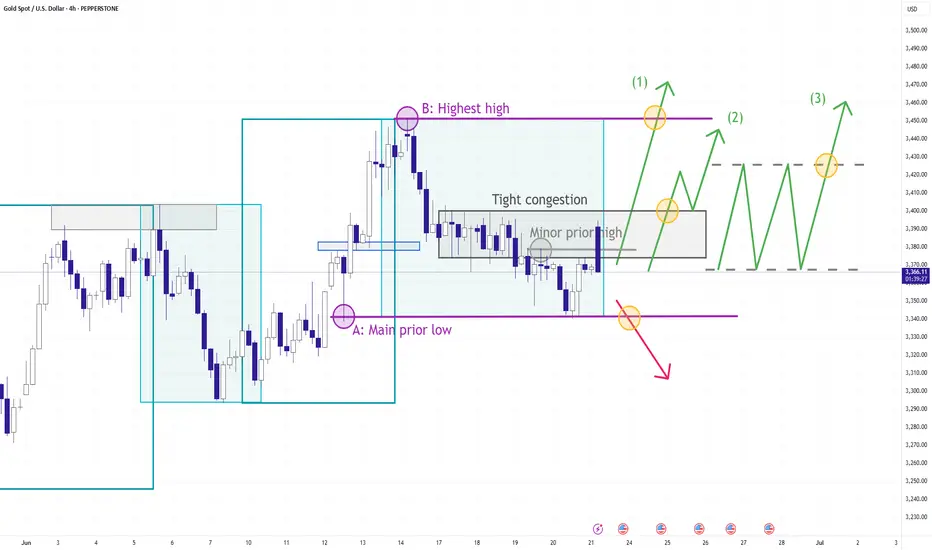
Gold Outlook: 3 Critical Zones That Could Shape the Next Move▋Observation & Meanings:
▪Price has broken out of the Broadening Wedge to the upside — a strong move led by bulls.
▪It then pulled back after reaching the 100% projection of the previous upswing, which also marked the likely extent of the retracement.
▪A break below the minor low (a) suggests short-term downward pressure.
▪However, the overall uptrend structure remains intact as long as the main low (A) holds.
▋What’s next?
Trading a retracement is always tricky — by nature, it means going against the prevailing trend.
▪ Question 1 : Is there anything to do when price falls below the minor low (a)?
Often, the best move is to stay patient and let the market reveal its intentions, some setups may offer opportunities:
▫The main prior low could act as a key short-term support, as it aligns with the 100% retracement of the previous upswing.
▫For aggressive traders, a quick short toward that level may be an option.
▪ Question 2 : When will a new trend begin?
▫Bearish scenario: A confirmed break below the main prior low could signal the start of a more sustainable downtrend.
▫Bullish scenario: Aside from Aside from (1) a direct breakout above the previous high (B), signs of strength may also come from:
(2) A clear lower high or
(3) A consolidation range, followed by a strong upside break.
In this case :
- The prior high (by definition) marks resistance.
- However, there’s also a tight congestion area before that high, which may act as the real barrier — potentially even more significant due to its cluster of price action.
▫Once early trend signals appear, the next step is to assess if the structure supports a lasting trend.
▋The 3 big zones:
▪ Uptrend Zone
The market is likely regaining upward momentum when one of the following occurs:
1. Price spikes above the previous swing high at point B.
2. Price breaks the tight congestion area to the upside.
3. A new consolidation range forms and breaks to the upside.
▪ Downtrend Zone
A clean break below the main prior low (A) would likely confirm bearish control and may open room for further downside.
▪ Ambiguous Zone
If price fails to meet the conditions for either an uptrend or a downtrend, it’s likely to remain in a drifting, indecisive state.
▋Mental Notes:
▪Don’t predict the price, trade the price. Have a plan, but not blindly follow.
▪The market will always find ways to surprise. Stay open and follow the flow.
▋Not Financial Advice
The information contained in this article is not intended as, and should not be understood as financial advice. You should take independent financial advice from a professional who is aware of the facts and circumstances of your individual situation.
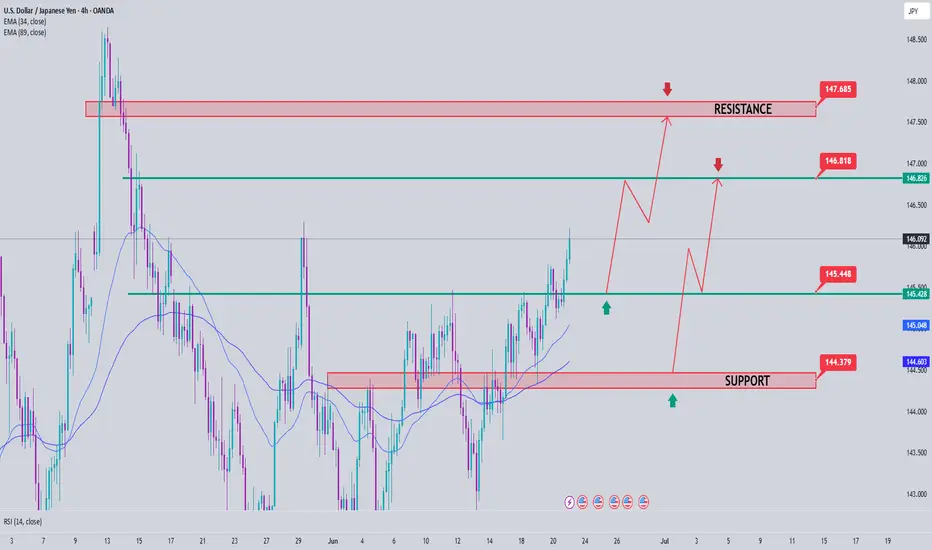
USDJPY ANalysis week 26Fundamental analysis
The Fed kept interest rates unchanged and forecast only a small cut in 2026-2027 due to concerns about high inflation. The number of officials opposing a rate cut this year increased. The Israel-Iran conflict escalated, the US may attack Iran but is waiting for Tehran's response, causing the Japanese Yen to appreciate thanks to its safe-haven role.
Japan and the US have not reached a trade deal, the risk of higher tariffs before the July 9 deadline. The US dollar is near a one-week high, supporting the USD/JPY pair, but investors remain cautious due to the lack of new economic data.
Technical analysis
USDJPY is rising quite strongly and reacting at the resistance zone of 146.200. There is a possibility of a price gap next week, so trading early will be quite risky. The trading range is expected to be clearer at the resistance and support zones. 146,800 and 147,700 are noted as the two important upper boundary zones. 145,400 and 144,400 will be important support zones with a very strong buyer force waiting.
Trading Signals
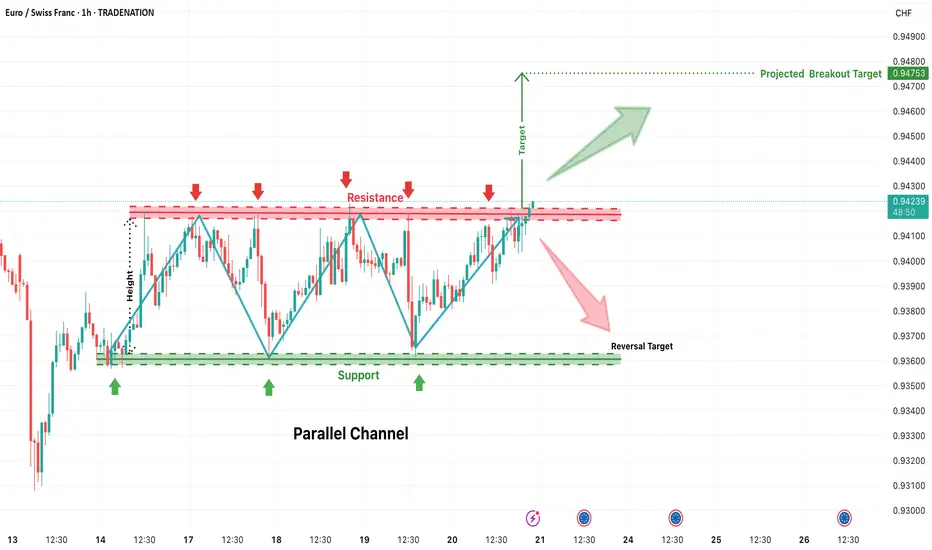
EUR/CHF Parallel Channel Breakout WatchThe EUR/CHF pair has been trading within a well-defined parallel channel on the 1-hour timeframe. The price action is contained between a strong resistance zone near 0.9420–0.9425 (marked in red) and a support zone near 0.9365–0.9370 (marked in green). Multiple rejections from both the top and bottom of the range indicate solid market structure and participation from both buyers and sellers.
This type of formation often leads to explosive moves when the price eventually breaks out of the consolidation range. The current chart shows price testing the upper boundary of the channel once again, and now attempting a bullish breakout.
📈 Bullish Breakout Scenario
If the price sustains above the resistance zone (confirmed breakout), we could see a continuation of bullish momentum toward the projected breakout target near 0.9475. This target is calculated using the height of the channel added to the breakout level, a classic price projection method. A strong candle close above the resistance with volume would validate this move. Traders may look for long entries on breakout confirmation or on a successful retest of the resistance zone as new support.
📉 Bearish Reversal Scenario
However, if the breakout fails and price gets rejected again from the red zone, a sharp reversal back toward the support zone around 0.9370 may occur. This would keep the channel intact and suggest continued range-bound movement. A breakdown below support would then be required for further bearish confirmation, leading toward deeper downside targets.
This setup provides a high-probability opportunity in either direction with clearly defined levels and structure. Wait for breakout confirmation before entering to avoid false moves.
=================================================================
Disclosure: I am part of Trade Nation's Influencer program and receive a monthly fee for using their TradingView charts in my analysis.
=================================================================
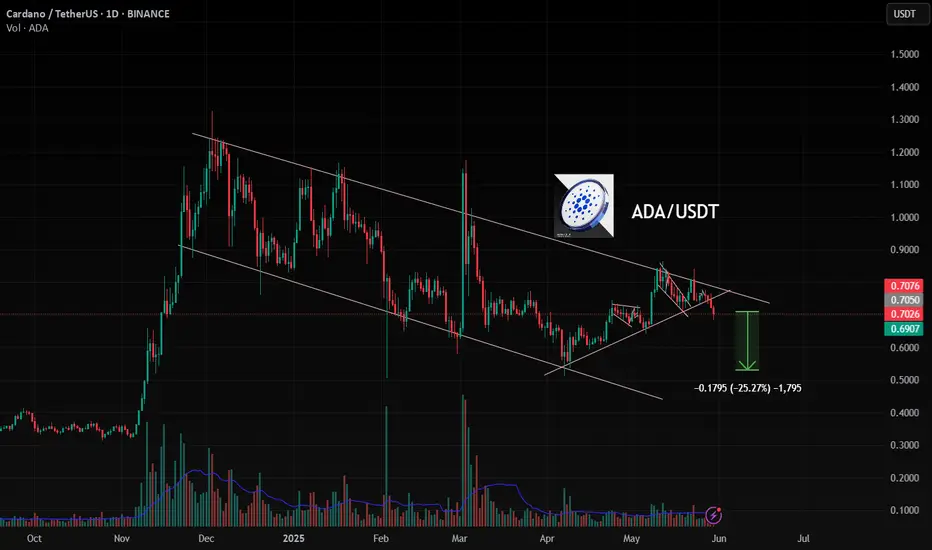
ADA , 1DAs BTC is Falling And BTC is given Breakout of Pattern in 4Hr , then Remaining coins will also fall drastically .
in 1D pattern of ADA USDT , it is Breaking Down as BTC is also given Break Down of Pattern
Follow for More Ideas like This
20.06.25 Morning ForecastPairs on Watch -
FX:EURJPY
FX:EURNZD
FX:EURUSD
A short overview of the instruments I am looking at for today, multi-timeframe analysis down to what I will be looking at for an entry. Enjoy!

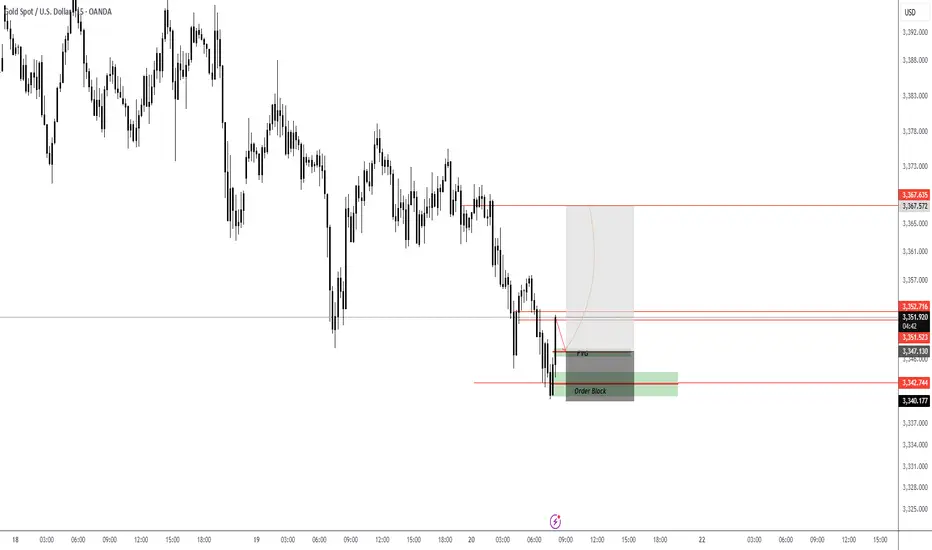
Gold Longlooking to the upside on Gold from Asia lows. This is a prelim entry (forecast) need to seek bullish PA around the FVG if we get a pull back. If a pull back does not form we will wait for a break and RT above 3,352 and plan entries accordingly.
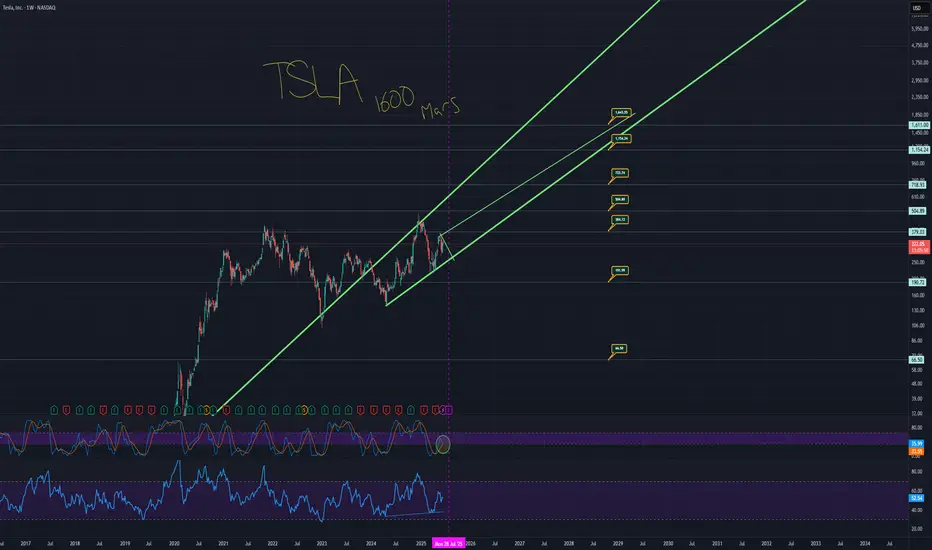
TSLA TO 1600, YOU SAW IT HERE FIRSTHere's the TA that takes Tesla legitimately to 1600.
The monthly chart has a trend that is currently acting as support.
The price has fallen under that trend.
Price action is also over a massive support trend from the weekly chart.
These are the two thickest green trends.
When you zoom back and look at TSLA as a whole, you see the bigger picture.
You have a situation where the low side takes you to around $60 to 70 dollars with a low of around $48. And then you have the high side taking you to around 1600. It sounds like a candidate for a stock reverse split.
Essentially, don't miss out on this potential solar data fast car thingy ready to really zoom.
Here is the chart with the auto fib numbers showing potential targets.
Remember, this likely doesn't occur all in one night, but the projection is really looking like it takes off from earnings. Projection line in yellow.
You have an opportunity where short term trends go to a strong long term trend which climbs to a support trend meaning price can literally take off from multiple of these trends meaning, we can price action go from 420 down to 250 and back up to 1600 in less than a year total.
UK100 ShortManipulation in the Asian session, looking for price to retest higher supply then push down to the London and Asia low, this is a forecasted entry, entries will be based after 8am M5 candle opening.

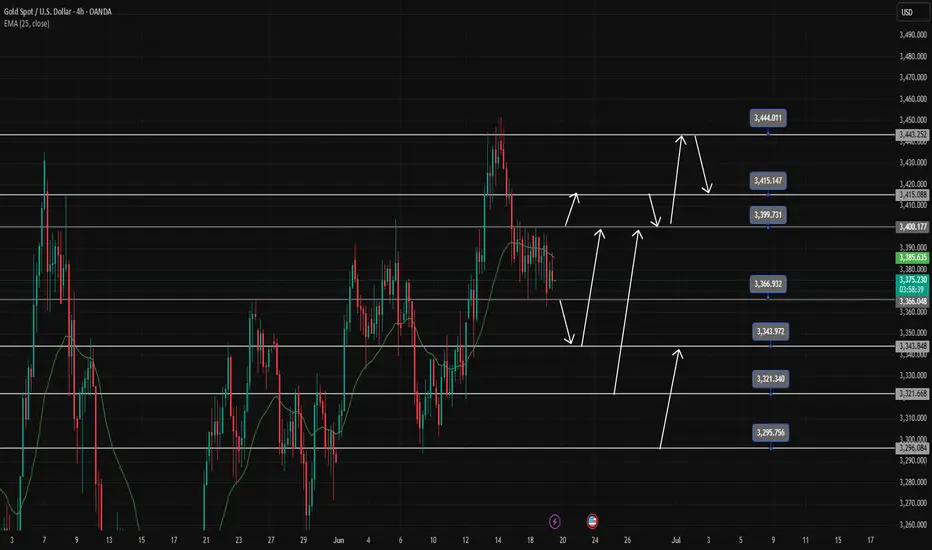
Gold Trading Strategy June 19Yesterday's D1 candle confirmed the Sell side after the FOMC announcement. Today's Asian session had a push but the European and American sessions are likely to sell again.
3366 will be an important breakout zone today, if broken through, the Sell side will continue to be strong and push the price deeper and limit buying when breaking this 3366 zone. 3344 is the first target, it is difficult for gold to break this zone but if it breaks right away, wait below 3296 to BUY for safety. Before that, pay attention to another support zone 3322.
3400 is the Breakout border zone from yesterday to today but gold has not broken it yet. To SELL this zone, you must also wait for the confirmation of the candle, but if you want to wait for a better SELL, you must wait for 3415 or wait at the ATH peak 3443. However, if it breaks 3400, waiting for a Buy test will be quite nice.
Support: 3343-3322-3296
Resistance: 3415-3443
Break out zone: 3366-3400
GOLD XAUUSD 1H Chart Idea"Gold is forming a descending triangle pattern, signaling bearish pressure. Price is testing the lower support zone, and a confirmed breakdown below this level could trigger a strong downside move. Bears are likely to dominate if the support breaks with volume confirmation. Watch closely for a retest of the broken support turning into resistance for possible short entries. Risk management is crucial in this setup."
