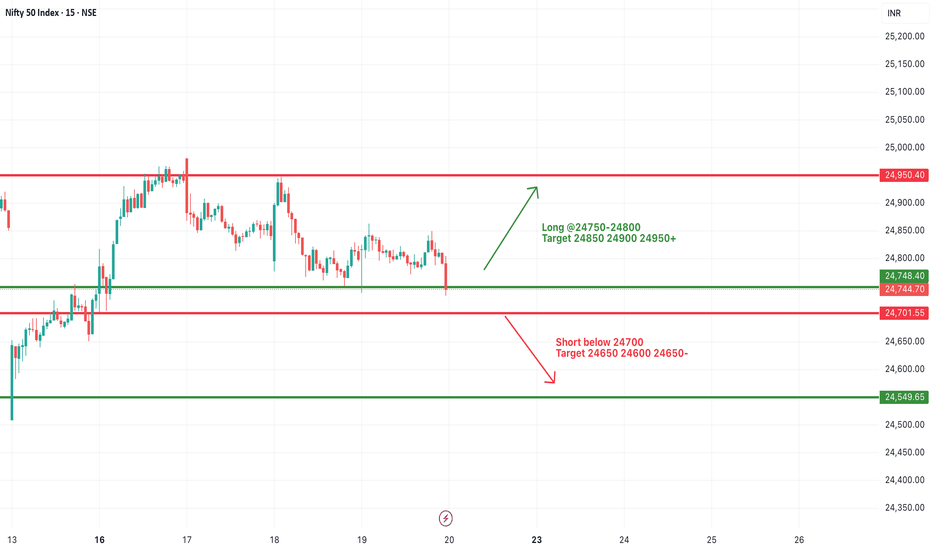
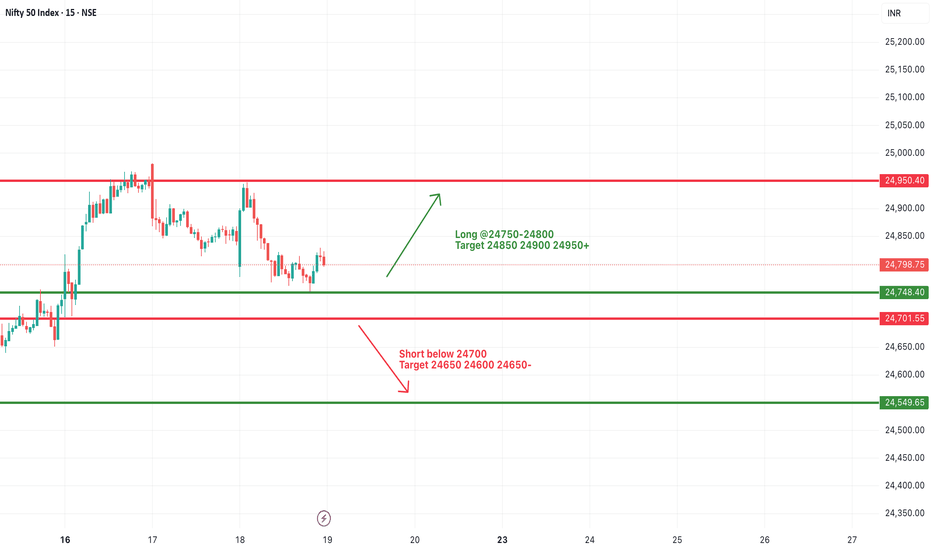
#NIFTY Intraday Support and Resistance Levels - 20/06/2025A flat opening is expected in Nifty today. After the open, all eyes will be on the 24,700 level, which has acted as a key support zone recently.
🔽 If Nifty starts trading below 24,700, downside momentum may pick up, with potential targets at 24,650 → 24,600 → 24,550-. Sustained weakness below 24,700 could attract short positions.
🔼 On the upside, if Nifty reclaims 24,750–24,800 and sustains, a bullish move may trigger toward 24,850 → 24,900 → 24,950+. However, 24,950 remains a strong resistance area from the past sessions.
⚠️ Strategy Note:
Market remains in a range-bound zone; wait for a decisive breakout for positional trades.
Use strict stop-losses and manage risk actively.
Ideal approach: scalp the range with quick profit booking unless a directional move confirms.
Priceactionanalysis
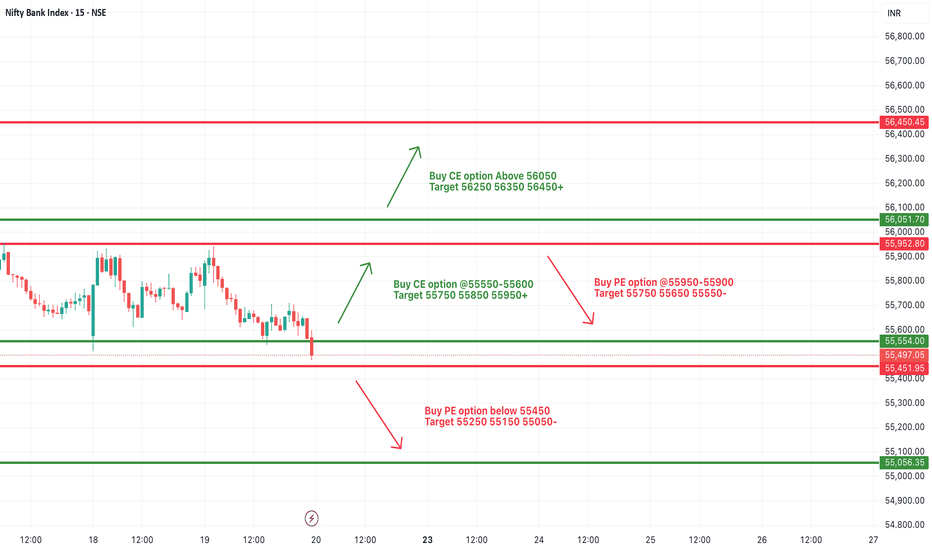
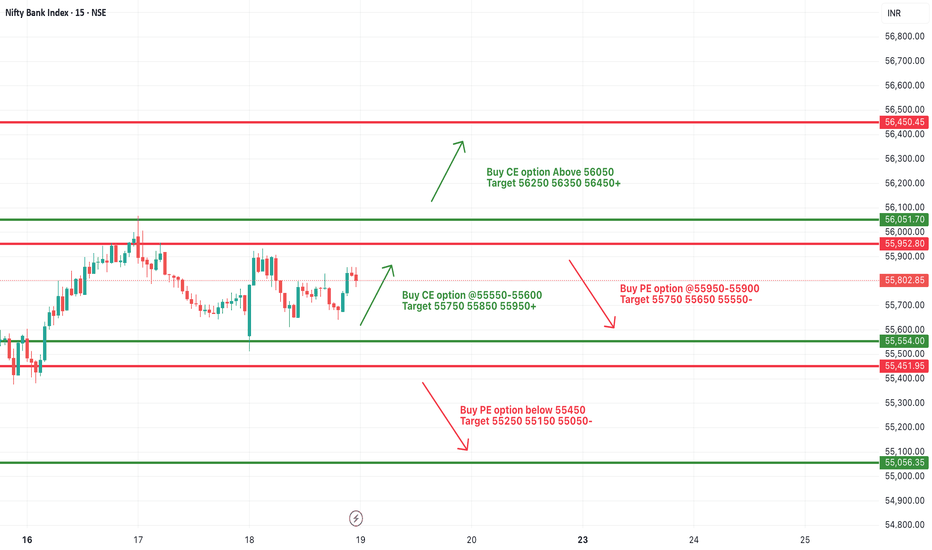
[INTRADAY] #BANKNIFTY PE & CE Levels(20/06/2025)Today, a flat opening is expected in Bank Nifty, with price action likely to begin around 55,500 levels. There are no major changes in the key levels compared to yesterday, and the market has remained in a consolidation phase.
🔽 If Bank Nifty starts trading below 55,450, it may trigger further downside toward 55,250 → 55,150 → 55,050-. This zone has acted as intraday support recently.
🔼 On the other hand, a move above 55,550–55600 may lead to upward momentum toward 55,750 → 55,850 → 55,950+. A breakout above 56,050 could open the path toward 56,250 → 56,350 → 56,450+.
⚠️ Key Takeaways:
Consolidation continues, so avoid aggressive positions until a breakout occurs.
Watch for range breakouts above 56,050 or below 55,450 for directional moves.
Use tight stop-losses and trail profits smartly to protect against volatility spikes.
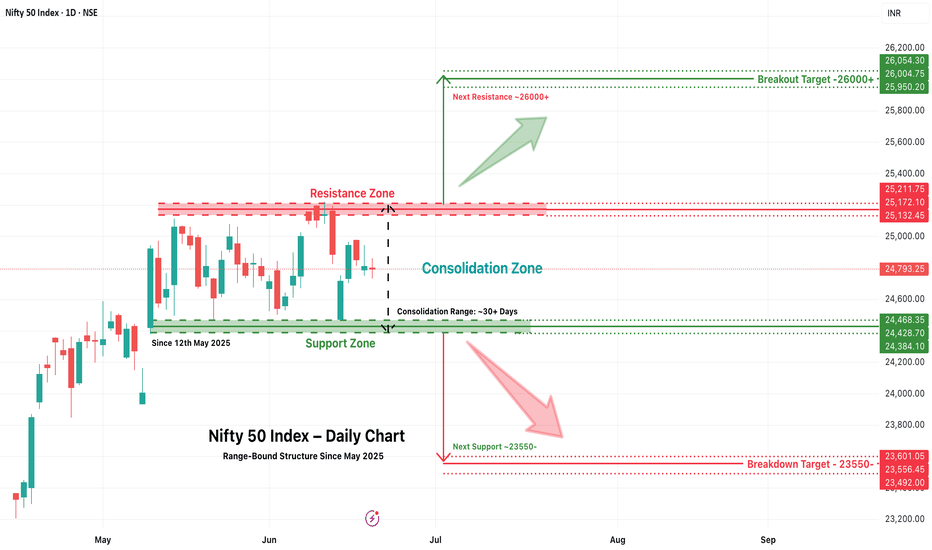
Nifty 50 Trapped in a Tight Range – Breakout or Breakdown Ahead?📍 Market Overview:
For over a month now, the Nifty 50 Index has been moving sideways in a tight consolidation range, frustrating both bulls and bears. Since May 12, 2025, the index has fluctuated between 24,350 on the lower side and 25,250 on the upper side, forming a classic rectangular pattern often associated with accumulation or distribution phases.
This zone is now becoming a crucial battlefield that could define the index’s direction for the coming sessions.
🔲 The Consolidation Zone
Support Zone: 24,350 – 24,450
Resistance Zone: 25,150 – 25,250
Consolidation Duration: ~30+ days
Current Price: 24,793.25
This range has seen multiple rejections at the top and bottom, reflecting indecisiveness in broader market sentiment. Traders are waiting for a trigger — either fundamental or technical — that could push the index out of this range with strength.
📈 Bullish Scenario: Breakout Above 25,350
If Nifty 50 breaks and sustains above 25,350, especially with higher volume and a strong daily close, it could signal a bullish continuation pattern. This scenario would be supported by:
A potential breakout from the rectangle consolidation.
Positive sentiment from global markets or domestic catalysts (monsoon, earnings, policy announcements, etc.)
A shift in FII or DII buying behavior.
📌 Breakout Target:
👉 26,000 – 26,100 (Based on measured move projection)
📌 Next Resistance Zone:
👉 26,050 – 26,200
In this case, traders may look for long opportunities with trailing stop-losses under the breakout zone.
📉 Bearish Scenario: Breakdown Below 24,350
On the flip side, a decisive breakdown below the 24,350 mark, especially with increased selling pressure and bearish candles, may lead to a quick decline toward the next major support levels.
📌 Breakdown Target:
👉 23,550 – 23,400
📌 Next Support Zone:
👉 23,500 – 23,300
This could trigger panic selling or profit-booking in frontline stocks. Caution is advised in such scenarios, and shorting opportunities may arise for experienced traders.
🧠 Strategic Insights for Traders
Avoid trading within the range: Unless you're scalping, wait for breakout/breakdown.
Watch global cues and FII flows: They often align with large breakouts.
Stick to risk management: Whichever direction the index moves, always set a stop loss.
🚀 Final Thoughts
The market is clearly in a wait-and-watch phase, but such consolidation periods often precede large moves. Nifty’s current structure suggests a breakout or breakdown is imminent — and being positioned correctly can make a big difference in returns.
Stay alert. Don’t predict — prepare.
⚠️ Disclaimer
This article is for educational and informational purposes only and does not constitute financial advice or a recommendation to buy or sell any securities. Trading and investing in the stock market involve risk, including the risk of losing capital. Always conduct your own research or consult with a qualified financial advisor before making any trading decisions. We are not responsible for any losses incurred from decisions based on this analysis.
#NIFTY Intraday Support and Resistance Levels - 19/06/2025Today, a flat opening is expected in Nifty around the 24,800 level. The index continues to trade within a narrow range, indicating market indecision and potential consolidation.
🔼 On the upside, if Nifty sustains above the 24,750–24,800 zone, it may trigger a bullish move toward 24,850 → 24,900 → 24,950+. Sustained strength above 24,950 can further open room for a breakout.
🔽 On the downside, if the index slips below 24,700, a short opportunity may arise toward 24,650 → 24,600 → 24,550-. Breach of 24,550 could lead to deeper correction.
⚠️ Key Notes:
The market is likely to remain range-bound and volatile.
Reversals from resistance and support levels are possible.
Trade with a strict stop loss and manage positions actively.
[INTRADAY] #BANKNIFTY PE & CE Levels(19/06/2025)Today, a flat opening is expected in Bank Nifty near the 55,800 zone. The index has been moving within a defined range for the past few sessions, and there are no major changes in yesterday’s key levels.
🔼 If Bank Nifty sustains above 55,550–55,600, it may show bullish momentum toward 55,750 → 55,850 → 55,950+. A breakout above 56,050 could lead to further upside toward 56,250 → 56,350 → 56,450+.
🔽 However, if the index fails to hold above 55,900–55,950 and starts reversing, a short opportunity may arise toward 55,750 → 55,650 → 55,550-. Sustained selling below 55,450 can drag the index down to 55,250 → 55,150 → 55,050-.
⚠️ Note:
The market is still in a consolidation phase, so false breakouts are possible. Stick to levels, wait for confirmation, and use strict stop-losses with trailing targets to manage risk effectively.
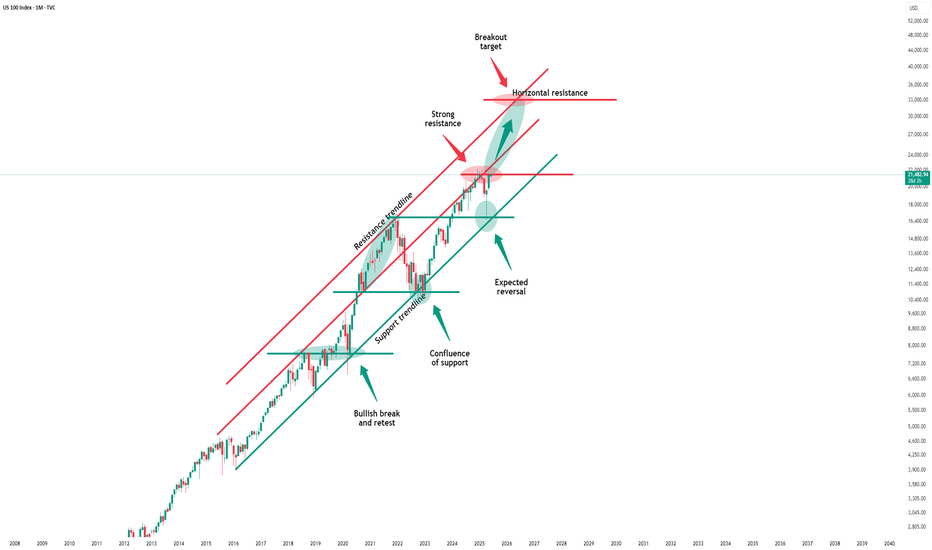
Nasdaq - This starts the next +50% rally!Nasdaq - TVC:NDQ - might break out soon:
(click chart above to see the in depth analysis👆🏻)
Despite the quite harsh correction of about -25% which we saw in the beginning of 2025, the Nasdaq is clearly heading for new all time highs. It sounds almost incredible but if the Nasdaq breaks above the current confluence of resistance, a breakout rally of +50% will follow thereafter.
Levels to watch: $21.500, $33.000
Keep your long term vision!
Philip (BasicTrading)
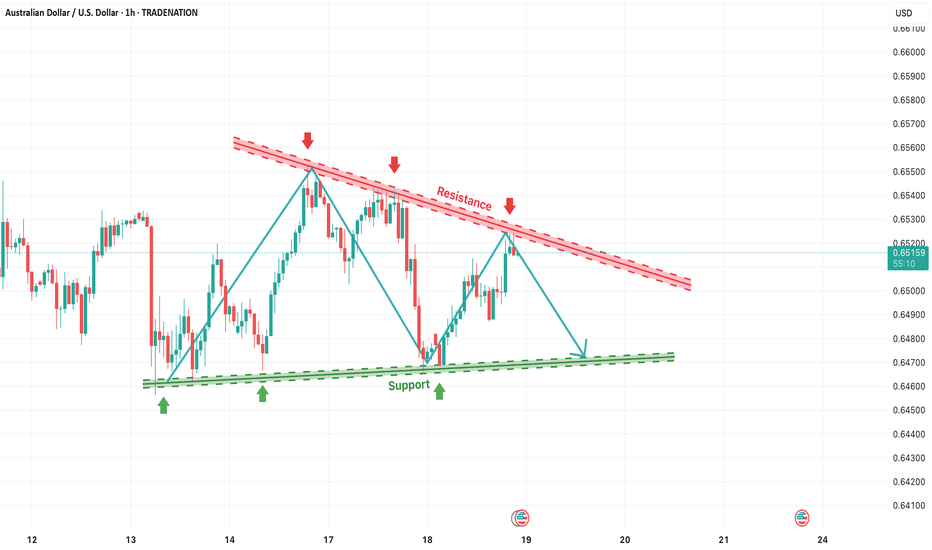
AUD/USD Descending Triangle Setup – Support Retest in FocusThe AUD/USD pair is currently forming a descending triangle pattern, a common bearish continuation structure where price makes lower highs while holding above a horizontal or slightly rising support level. This setup indicates increasing selling pressure at lower resistance levels (highlighted with red arrows and trendlines), while buyers are consistently defending the green support zone around 0.6475–0.6485.
So far, the price has been rejected multiple times from the descending resistance line, confirming seller dominance. At the same time, it has found buying interest at support, forming a tight range where a breakout or breakdown is likely to occur soon.
🔽 Current Price Action & Outlook
The latest price structure shows a potential lower high forming, suggesting another move downward toward support.
If the pair revisits the support zone once again, it will be a critical retest, and the market could either:
Bounce from support, continuing the sideways structure within the triangle, or
Break down below the green trendline, triggering a bearish continuation.
Until the support breaks, the market remains range-bound inside the triangle, offering short-term trade setups between support and resistance.
🎯 Strategy Notes
Short-Term Idea: Sell near resistance (~0.6525–0.6535), buy near support (~0.6475–0.6485)
Breakout Traders: Wait for a confirmed breakout of either boundary with volume before entering
Invalidation: A strong breakout above the red descending trendline may invalidate the bearish structure
This is a neutral-to-bearish setup with a potential for breakout in either direction. Patience is key for waiting on confirmation.
=================================================================
Disclosure: I am part of Trade Nation's Influencer program and receive a monthly fee for using their TradingView charts in my analysis.
=================================================================
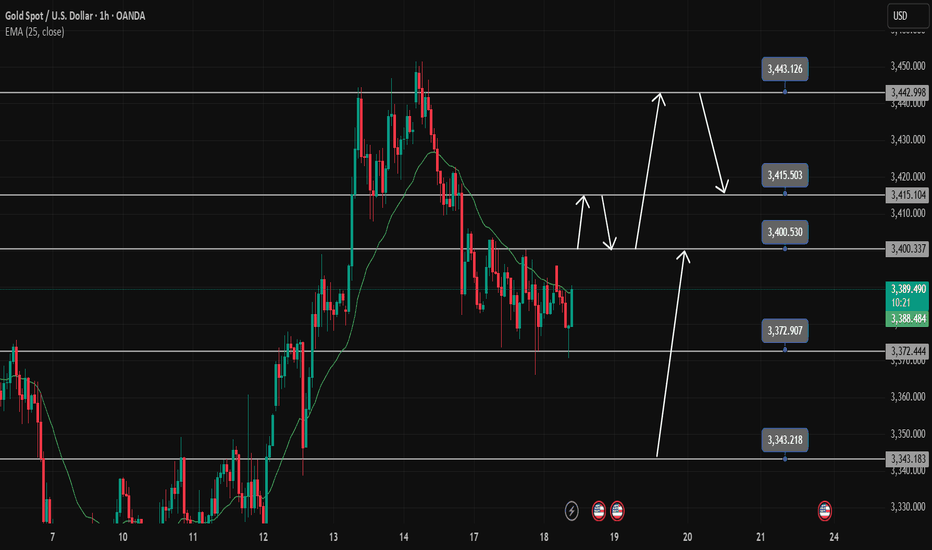
Trading strategy june 18Yesterday's D1 candle was a Doji candle. It shows the hesitation of buyers and sellers at the price near ATH.
The h4 structure is a sustainable bullish wave structure and is heading towards higher hooks.
The 3400 zone is the immediate resistance zone that Gold is heading towards. This zone will be the breakout zone for the confirmation of the candle closing above 3400.
The profit-taking reaction zone of sellers at 3415 acts as a price reaction when the price uptrends again and creates momentum towards 3443.
On the opposite side, the breakout point of 3472, if broken, will push the price to the support zone of 3342
Break out zone: 3400; 3372
Resistance: 3415; 3443
Support: 3343
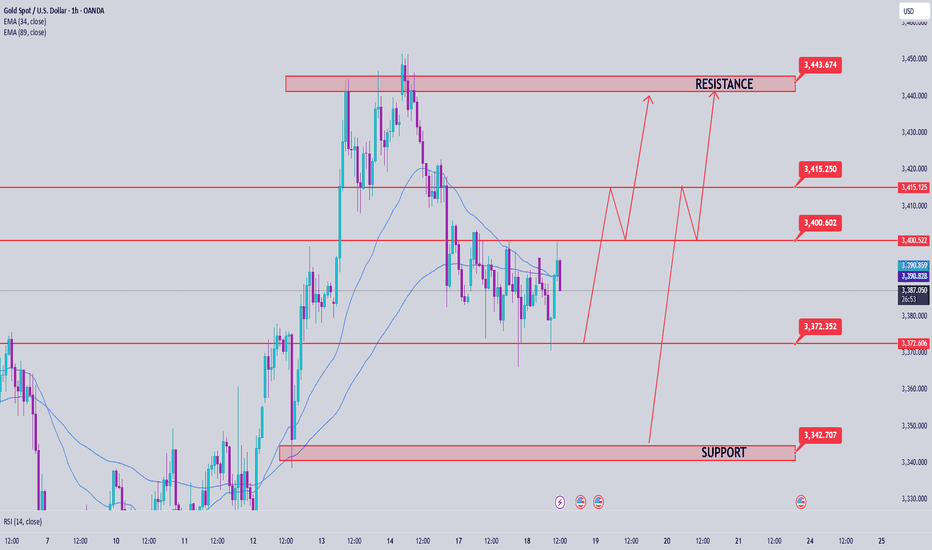
Gold price analysis June 18Yesterday's D1 candle was a Doji candle. It shows the hesitation of buyers and sellers at the price near ATH.
The h4 structure is a sustainable bullish wave structure and is heading towards higher hooks.
The 3400 zone is the immediate resistance zone that Gold is heading towards. This zone will be the breakout zone for the confirmation of the candle closing above 3400.
The profit-taking reaction zone of sellers at 3415 acts as a price reaction when the price uptrend returns and creates momentum towards 3443.
On the other hand, the breakout point of 3472, if broken, will push the price to the support zone of 3343
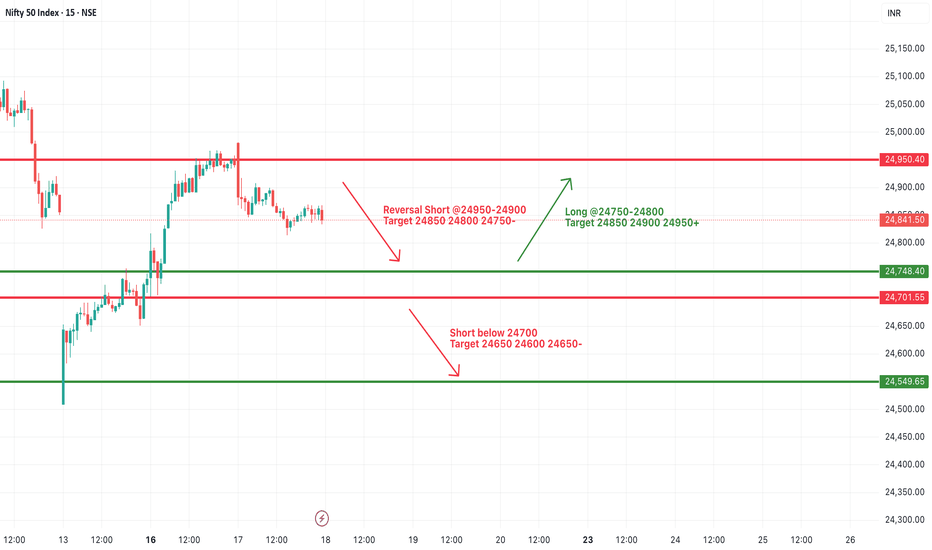
#NIFTY Intraday Support and Resistance Levels - 18/06/2025Today, Nifty is expected to open with a slight gap down near the 24,850 zone, indicating caution among participants at higher levels.
🔼 If Nifty sustains above the 24,750–24,800 zone, a positive move may unfold with upside targets at 24,850 → 24,900 → 24,950+. Sustained strength above 24,950 could lead to a further rally.
🔁 On the other hand, if Nifty approaches the 24,950–24,900 zone and shows signs of rejection, it could lead to a reversal. In that case, the downside targets may be 24,850 → 24,800 → 24,750-.
🔽 A decisive move below the 24,700 level would indicate bearish control, opening further downside towards 24,650 → 24,600 → 24,550-.
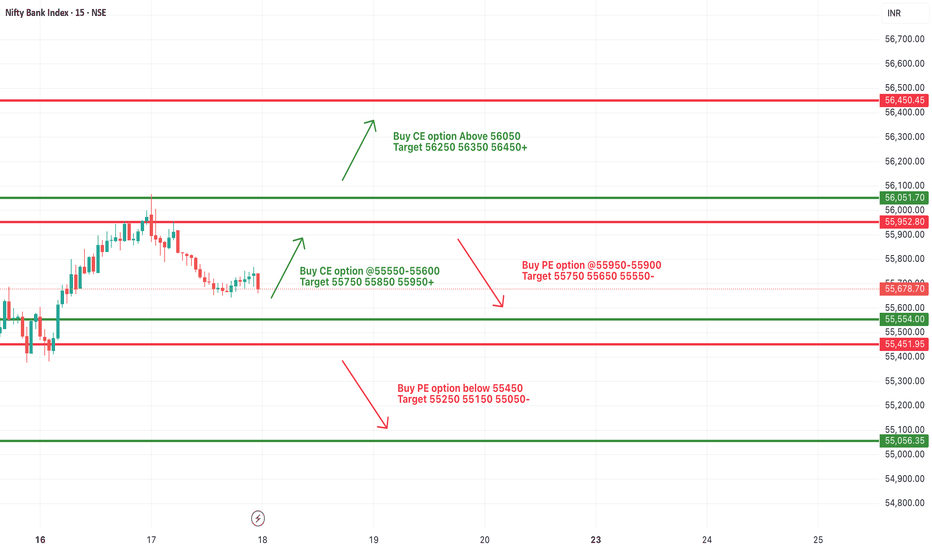
[INTRADAY] #BANKNIFTY PE & CE Levels(18/06/2025)Today, Bank Nifty is expected to open with a slight gap down near the 55,650–55,700 zone, indicating early signs of consolidation within a tight range.
🔼 If Bank Nifty sustains above the 55,550–55,600 levels after opening, it could trigger a bullish move towards the targets of 55,750 → 55,850 → 55,950+.
🔽 However, if Bank Nifty approaches the 55,950–55,990 zone and shows signs of reversal, a corrective fall may follow with potential downside targets at 55,750 → 55,650 → 55,550.
🔻 A clear breakdown below the 55,450 level would indicate bearish strength, and the next downside levels to watch are 55,250 → 55,150 → 55,050-.
🚀 On the upside, if Bank Nifty manages to break out above the key resistance of 56,050, we can expect a strong rally with targets at 56,250 → 56,350 → 56,450+.
SOLUSDT // 15M // LONGPrice tapped into a previous support zone which is now acting as support & resistance flip, showing early signs of a bullish structure shift.
Just below, a clearly defined Bullish Order Block between ~151.00 and 152.20 is providing institutional demand, which strengthens this zone further.
The current entry sits slightly above this confluence, giving a high-probability long setup.
📈 Expected Price Path: Anticipating a possible liquidity grab, internal pullback inside the grey box, followed by continuation toward target liquidity around 156.00+.
🔹 Entry: 153.23 (Market Execution)
🎯 Take Profit (TP): 156.02
🛑 Stop Loss (SL): 152.22
📊 Risk-Reward Ratio (RRR): ~1:2.53
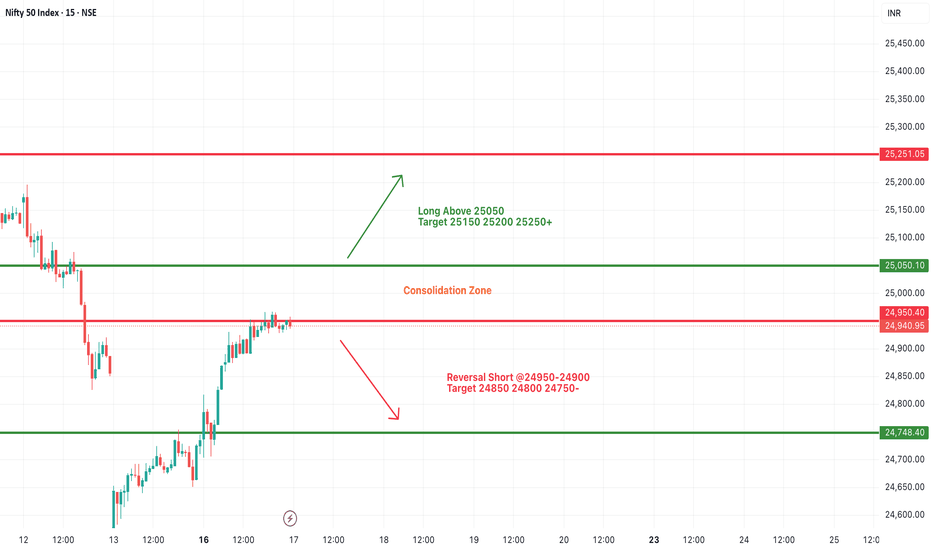
#NIFTY Intraday Support and Resistance Levels - 17/06/2025Today, a flat opening is expected in Nifty near the 24,950 level. The index has been moving in a narrow consolidation zone and currently trades just below an important resistance. If Nifty manages to sustain above the 25,050–25,100 zone after the opening, we may witness bullish momentum building up. This could lead to an upward move toward 25,150, 25,200, and possibly 25,250+ levels during the day.
However, if Nifty fails to hold above the 24,950 mark and slips into weakness, it may invite intraday profit booking. A drop below the 24,900–24,950 level could open the downside toward 24,850, 24,800, and 24,750 levels. This zone has previously acted as a support range, and any break here could intensify selling pressure.
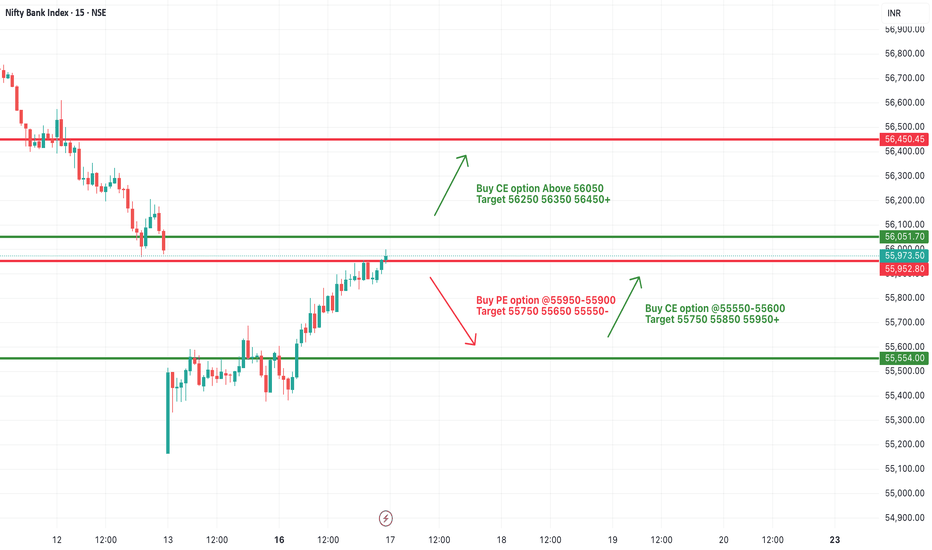
[INTRADAY] #BANKNIFTY PE & CE Levels(17/06/2025)Today, Bank Nifty is expected to open flat near the 55,970 zone. The market has shown a steady recovery over the past few sessions, and now it stands near a crucial resistance level. If Bank Nifty manages to sustain above the 56,000–56,050 level after the opening, we may see bullish momentum picking up. This could lead to a move toward the higher levels of 56,250, 56,350, and even 56,450+ in the intraday session. A breakout above 56,050 with volume confirmation can act as a trigger for continued upside.
On the flip side, if Bank Nifty struggles to hold above 55,950 and slips below this level, it may face intraday selling pressure. A breakdown can drag the index back down toward 55,750 initially, followed by 55,650 and 55,550 if weakness persists. These levels will act as immediate support zones where short covering or fresh buying may be seen.
Overall, the index remains in a narrow range with critical levels on both ends. A directional move can emerge if either side breaks with strength. Traders should remain cautious and avoid aggressive positions near the opening. Trade with a strict stop loss and consider trailing profits once levels are achieved, as the market may remain choppy around key zones.
Gold Price Analysis June 16There is not much surprise when the price gap up appeared on Monday morning
there is no barrier that can stop the price of gold from increasing towards ATH.
Gold has a slight correction in Tokyo session after the price gap up touched the round resistance zone 3450.
The correction may extend to 3413 in European session. This is a BUY zone with the expectation that Gold will regain the ATH hook. If broken, there will be some Scalping buy zones but the risk is quite high so to be safe, wait for 3398.
3463 acts as temporary resistance for a reaction period before Gold returns to the all-time high. Maybe before 3490 there will be another price reaction before reaching the top.
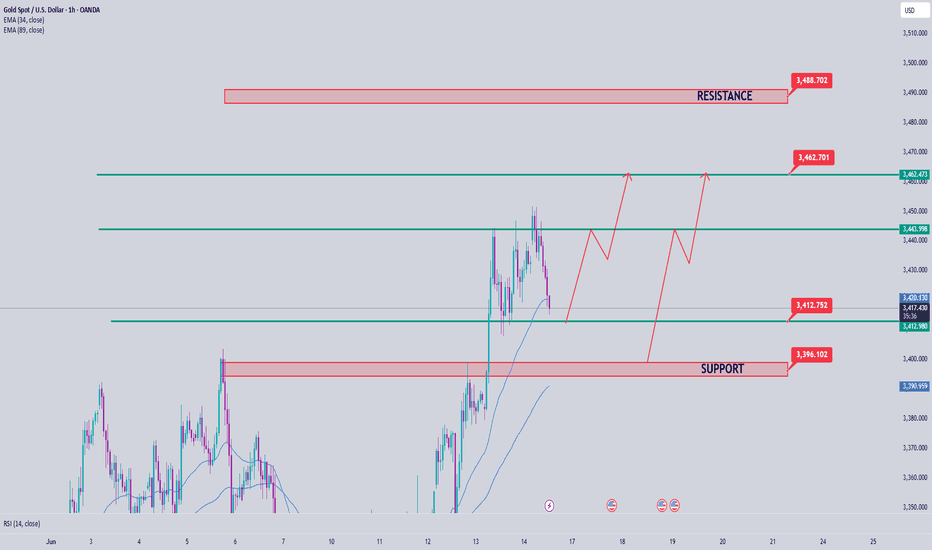
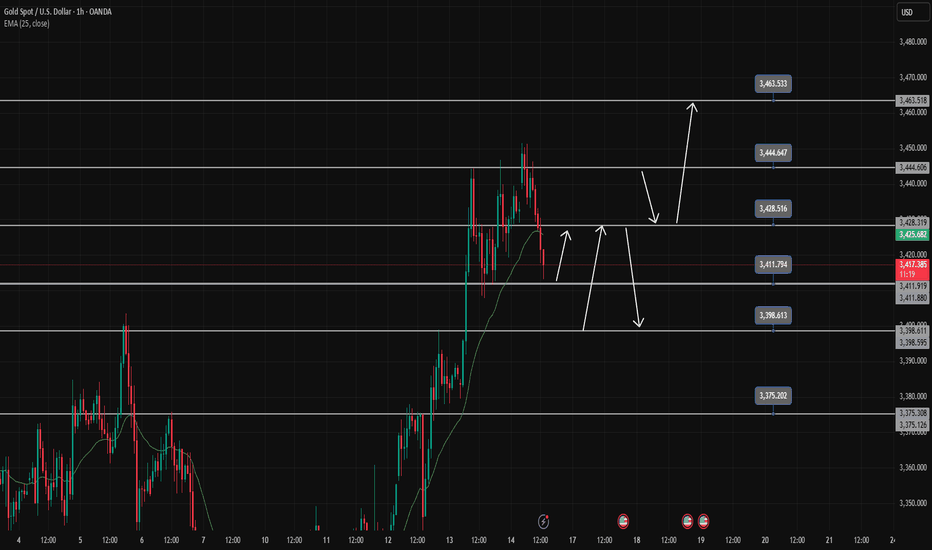
Gold Trading Strategy June 16There is not much surprise when the price gap up appeared on Monday morning there is no barrier that can stop the price of gold from increasing towards ATH. Gold has a slight adjustment in Tokyo session after the price gap up touched the round resistance zone 3450.
The adjustment may extend to 3413 in European session. This is a BUY zone with the expectation that Gold will regain the ATH hook. If broken, there will be some Scalping buy zones but the risk is quite high so to be safe, wait for 3398.
In the long term, 3463 acts as temporary resistance for a reaction phase before Gold returns to its all-time high. Maybe before that, 3490 will have another price reaction before reaching the peak.
Resistance: 3428 (Scalping) - 3444 - 3463 - 3490
Support: 3413- 3298
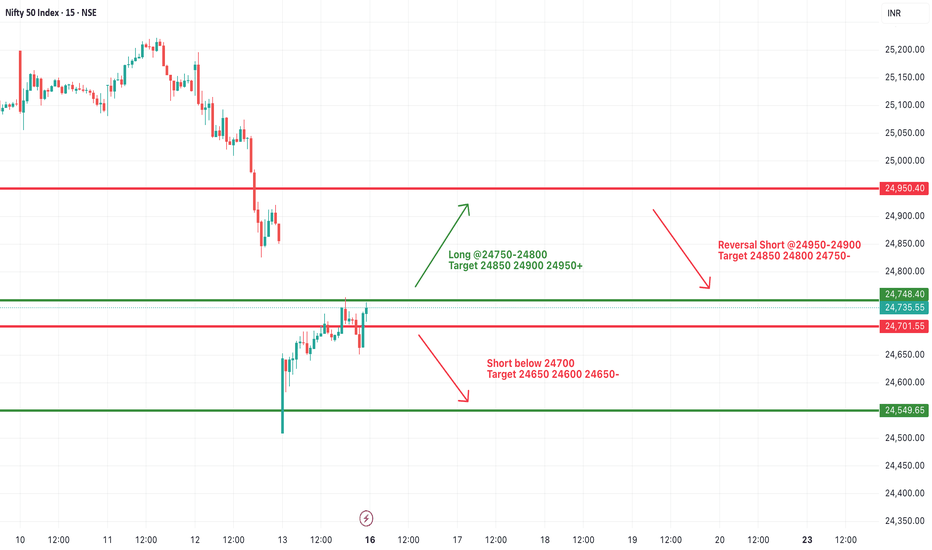
#NIFTY Intraday Support and Resistance Levels - 16/06/2025Today, a slightly gap-up opening is expected in Nifty near the 24,735 level. If Nifty sustains above the 24,750–24,800 zone after the opening, it may lead to a continuation of the upside move toward 24,850, 24,900, and potentially 24,950+ during the day. This zone can attract intraday buying interest, especially if supported by volume and momentum.
However, any rally approaching the 24,950 level should be watched cautiously, as it may act as a reversal zone, triggering profit booking or intraday resistance.
On the other hand, if Nifty fails to hold 24,700 levels and starts drifting lower, fresh selling pressure could emerge, pushing the index toward 24,650, 24,600, and even 24,550 during the session.
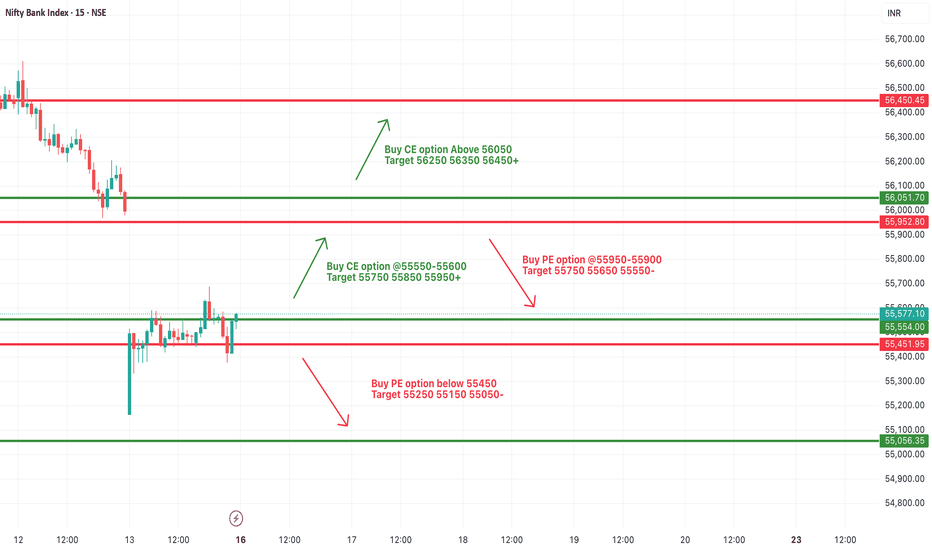
[INTRADAY] #BANKNIFTY PE & CE Levels(16/06/2025)Today, a slightly gap-up opening is expected in Bank Nifty near the 55,550–55,600 zone. If Bank Nifty sustains above this zone, it may attempt an upside move toward 55,750, 55,850, and potentially 55,950+ levels during the session.
If Bank Nifty starts trading above 56,050, a further bullish rally can be seen, taking it higher toward the 56,250, 56,350, and 56,450+ zones.
On the downside, if Bank Nifty slips below the 55,450–55,400 zone, it may face further selling pressure, leading to a possible move toward 55,250, 55,150, and 55,050 levels.
