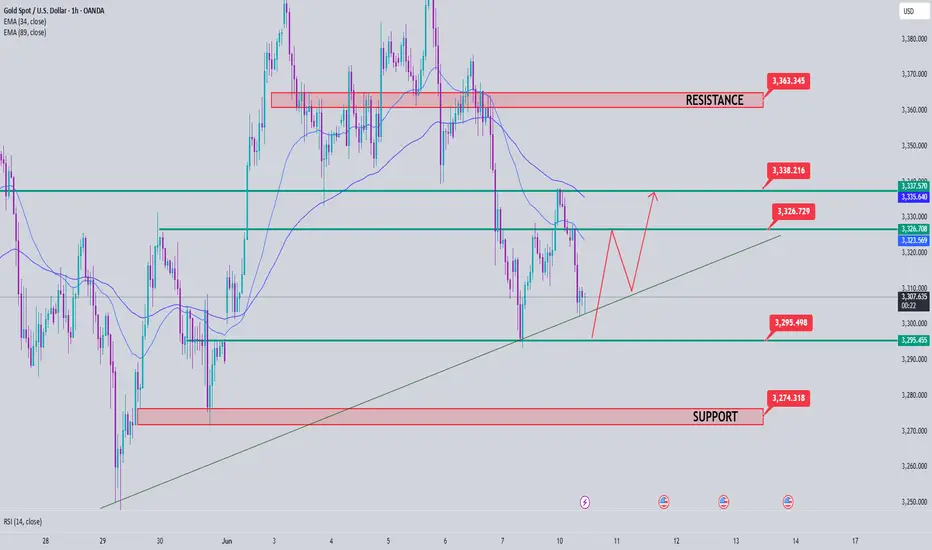
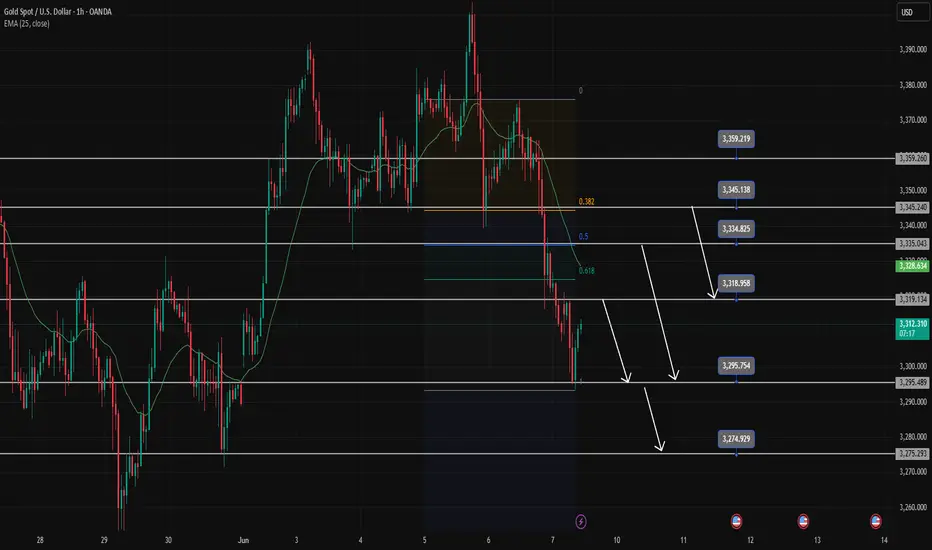
Gold Trading Strategy June 10Gold price in D1 frame reacted at EMA and Trend zone yesterday and bounced back but at the end of the day still closed below the 3335 breakout zone. The downtrend can still continue as long as 3335 remains stable today.
Looking at H1, it is still in a fairly clear downtrend. 3327 is the area that is currently in dispute. 3310 is the resistance zone that Gold broke through in the Asian session. To BUY this area, you must wait for price reaction and confirmation from the candle. Breaking 3309, Gold will head towards today's important support 3295. This is a good zone for BUY signal. The daily support zone around 3275 will prevent any excessive price slide of Gold.
On the other hand, when the buyers push the price strongly through 3327, you must wait for the US session resistance around 3338 yesterday for a SELL signal. (H1 does not break through 3328, we can set up SELL with the confirmation of selling force) Breaking 3338, the bearish structure will no longer exist, the market will switch to a short-term uptrend towards 3364.
Resistance 3337-3364-3374
Support 3310-3295-3275
Wish you successful trading. If you do not understand the strategy clearly, you can contact me for support.
Priceactionanalysis

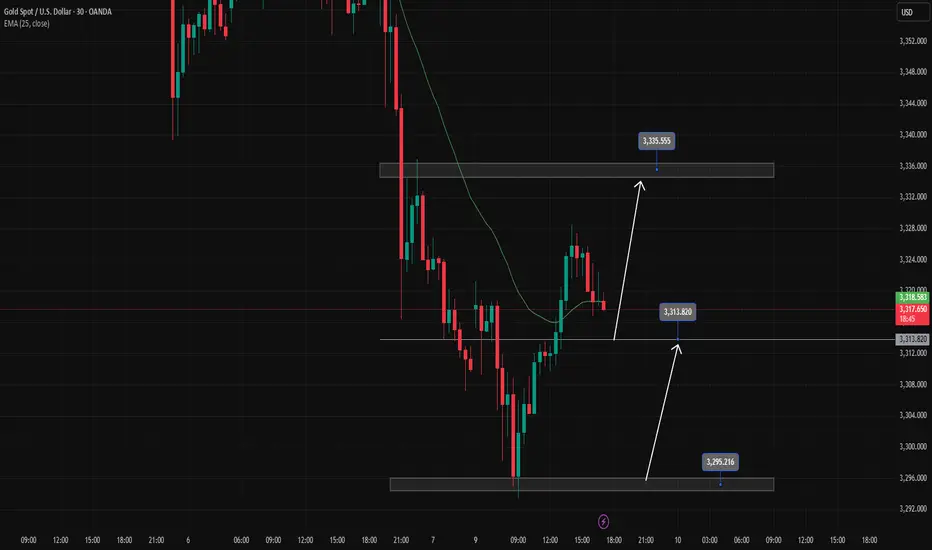
Gold Price Late LonDon Session Trading StrategyGold is looking for support at 3314 in the late European session. If Gold breaks 3314, it will look for a daily trading plan around 3295. Note that 3314 will give a BUY signal if there is a reaction from the buyers. Target for BUY signals 3335 today
10.06.25 Morning ForecastPairs on Watch -
FX:GBPJPY
FX:EURJPY
FX:USDCHF
A short overview of the instruments I am looking at for today, multi-timeframe analysis down to what I will be looking at for an entry. Enjoy!

Gold Price Analysis June 10Gold price reacted at the Trenline and EMA 34 yesterday and bounced back but still closed below the breakout zone of 3335.
The downtrend can still continue as long as 3335 remains strong today.
H4 shows the provincial port area at 3295 and 3275 in the opposite direction of the provincial port at 3339 and 3365.
H1 is still forming a clear downtrend. 3309 is the immediate resistance zone. is the price zone that can scalp breakout if it closes above this zone. break 3309 Gold will head to 3327 in this zone, if you want to SELL, you have to wait for confirmation from the selling candle. When the buyers push the price strongly through 3327, you have to wait for the US session resistance around 3338 yesterday. Resistance and support during the day are noted around 3275 and 3365
Gold price analysis on June 9The D1 candle on Friday broke the sideways structure and confirmed the downtrend for Gold prices.
Gold prices pushed up quite high in today's Tokyo trading session after touching the Gap zone around 3395.
With this upward force, 3319 will be available at the end of the Asian session. This zone can wait for a reaction and SELL can return because this is the zone where the Sellers pushed the price down at the beginning of the session. The European session will pay more attention to the 3334 zone with a break out point that is also quite important. The upward force will be stopped by the Sellers at the daily resistance level around 3345.
SELL is following the trend and can sustain the profit far away, while the BUY points are considered to find the reaction wave to increase and correct. The first zone is 3295, the second zone is around 3275.
Wishing you a successful trading day

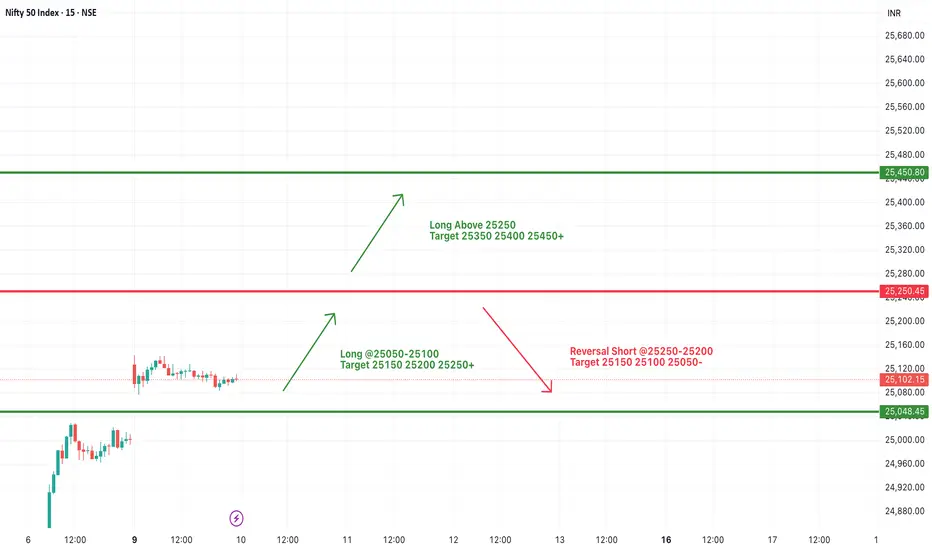
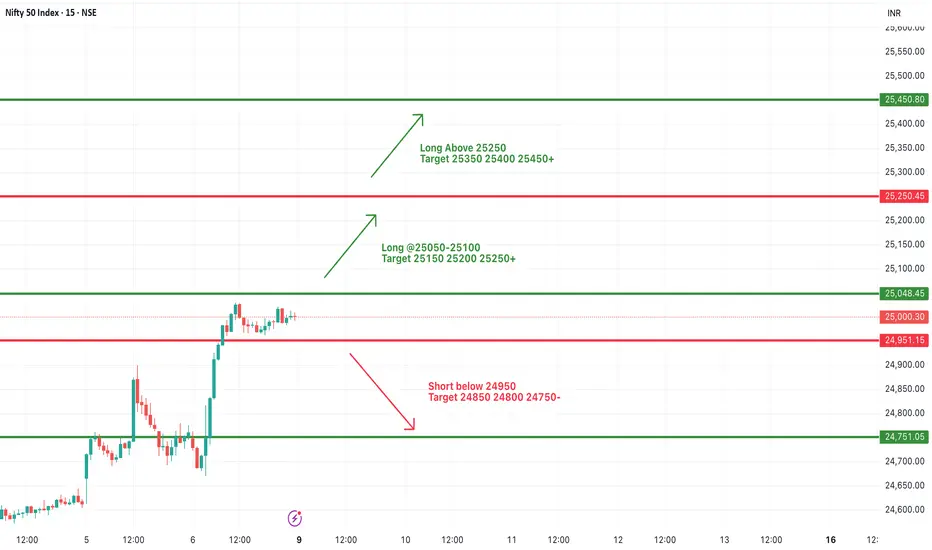
#NIFTY Intraday Support and Resistance Levels - 10/06/2025Nifty is opening with a gap-up near the 25250 level, approaching a crucial resistance zone. This area has previously acted as a turning point, and today's opening could define whether bulls retain control or face exhaustion.
If Nifty sustains above 25250, we can expect further upside momentum toward 25350, 25400, and 25450+. A clean breakout above this level could open the path to short-term bullish continuation.
However, if the index struggles to hold above 25250 and reverses, profit booking may kick in, pulling the index back toward 25150, 25100, and even 25050.
Holding above 25050–25100 will be key for maintaining a positive structure. A breakdown below this zone may shift sentiment in favor of bears.
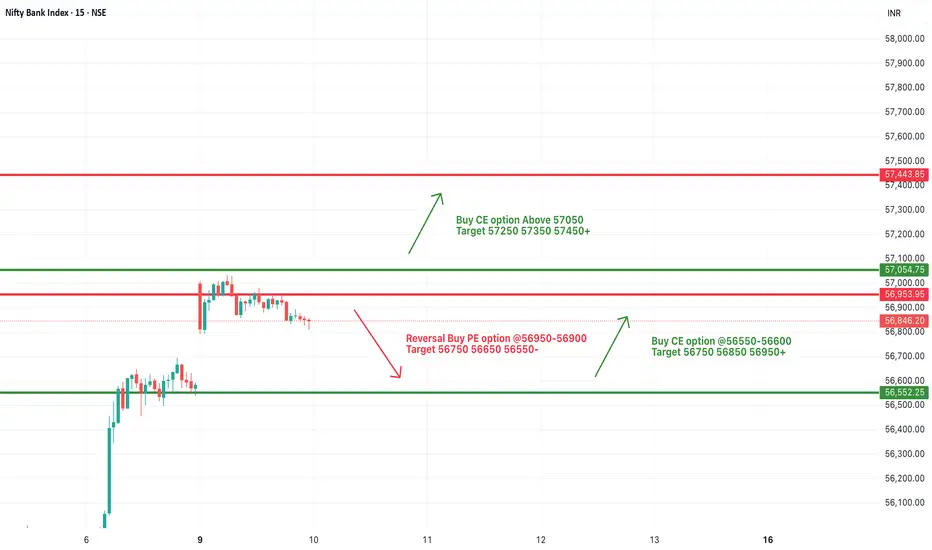
[INTRADAY] #BANKNIFTY PE & CE Levels(10/06/2025)Bank Nifty is expected to open with a gap-up around the 57000 level, placing it directly at a critical resistance zone. This area has previously acted as a rejection point, making today's price action especially significant.
If the index sustains above 57050, it may trigger a fresh bullish leg with potential upside targets at 57250, 57350, and 57450+. Strong momentum above this range could lead to continued buying pressure through the session.
However, if Bank Nifty fails to hold above 57000 and starts rejecting the zone, a reversal may play out. In that case, downside movement toward 56750, 56650, and 56550 can be expected.
Holding above 56550–56600 is essential to maintain bullish structure. If the price dips below that, short-term weakness may extend.
Gold Trading Strategy June 9The D1 candle cluster on Friday broke the sideway structure near the AHT peak and confirmed the downtrend for Gold price by breaking through 50% of the main bullish candle on June 2.
After touching the Gap zone around 3395. Gold price pushed up quite high in Tokyo trading session today and headed towards the first resistance levels around 3319. This area can wait for reaction and SELL to return because this is the area where the Sellers accumulated quite strongly at the beginning of the session.
The European session will pay more attention to the 3334 area with a breakout point also quite important on Friday. If from 3334 the gold price falls, it will form a strong fall according to the downtrend structure and head towards 3275 soon.
SELL is following the trend and can sustain profits far away, while BUY points are considered to find a corrective reaction wave, so narrow expectations.
Support: 3295, 3275
Resistance: 3319, 3334, 3345, 3359
Wish you a successful trading day
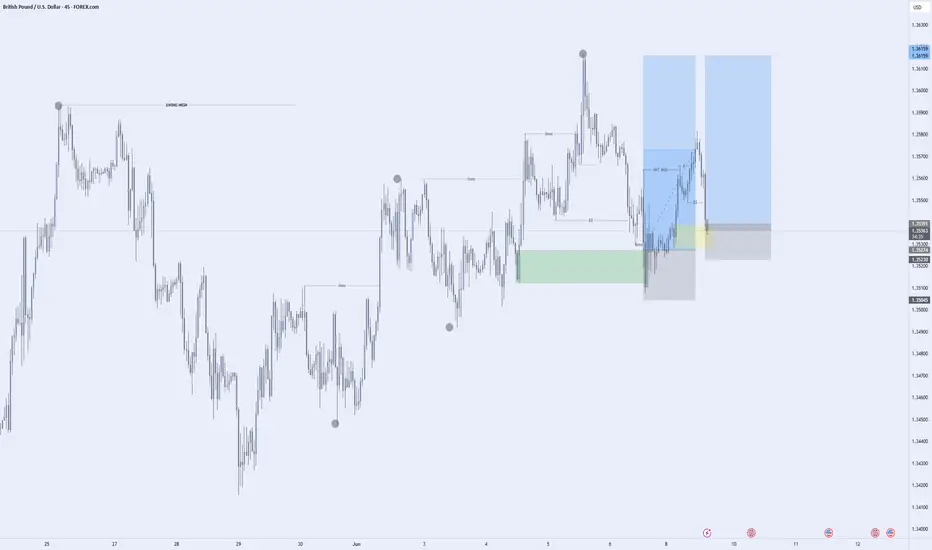
GBPUSD [Possible longsHere' how I'm watching GBPUSD for a potential buy trade. I reckon the buy would hold, although I'd be risking 0.5% of my equity because we didn't see the market take out previous high with deliberate candle closes, and that could mean that there are sellers lurking somewhere around.
However, until the sell is confirmed, the trend is our friend.
DYOR
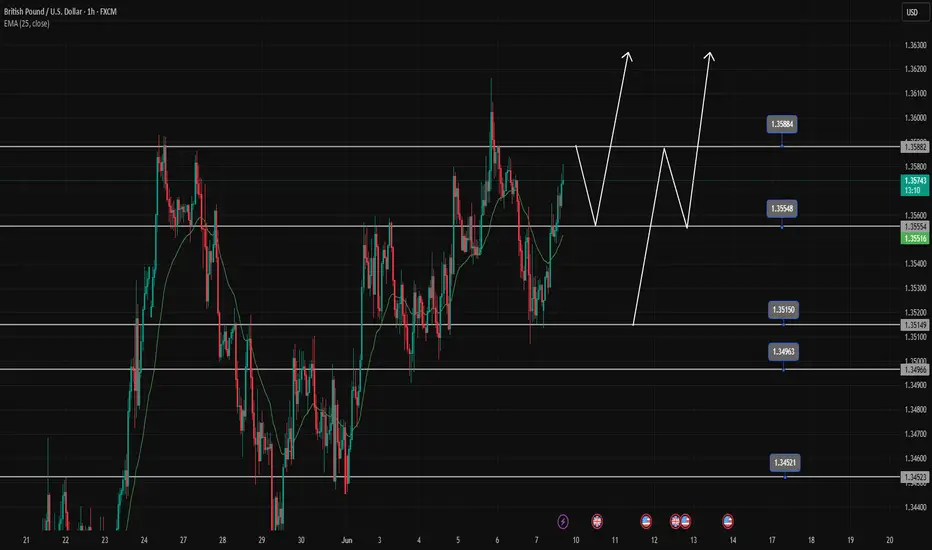
Buy opportunity when price retraces to break the topGBPUSD encounters resistance at 1.358, there is a high possibility that there will be a price reaction to 1.35500 to create a Dow break 1.358 towards higher levels.
GBPUSD is increasing very strongly again in the main trend, we wait for a retracement to the support zones, which is a strong buying opportunity.
1.358-1.355-1.351-1.345 are BUY zones when the price has a reaction of buying force at these price zones.
09.06.25 Morning ForecastPairs on Watch -
FX:USDJPY
FX:AUDNZD
FX:AUDJPY
FX:CHFJPY
A short overview of the instruments I am looking at for today, multi-timeframe analysis down to what I will be looking at for an entry. Enjoy!

#NIFTY Intraday Support and Resistance Levels - 09/06/2025Nifty is opening with a gap-up above the 25050 level, continuing the recent bullish momentum. The index has broken out of its previous range and is now hovering near a key breakout zone.
If Nifty sustains above 25050–25100, we could see further upside toward 25150, 25200, and 25250+. A clean breakout above 25250 may unlock extended targets at 25350, 25400, and 25450+.
However, if the index fails to hold above 25000 and slips back below 24950, it could lead to a short-term pullback. In that case, expect downside toward 24850, 24800, and 24750.
[INTRADAY] #BANKNIFTY PE & CE Levels(09/06/2025)Bank Nifty is opening with a gap-up near the 56900 level, right into a critical resistance zone. While momentum is strong, the index is now approaching a potential reversal area.
If Bank Nifty sustains above 57050, we could see a continuation of the bullish trend with upside targets at 57250, 57350, and 57450+. A strong breakout above this zone could trigger fresh buying.
However, if the index fails to hold above 56900–57000 and starts to reverse, it may signal short-term exhaustion. In that case, a pullback toward 56750, 56650, and 56550 is possible.
A breakdown below 56450 would suggest weakness, exposing downside targets at 56250, 56150, and 56050.

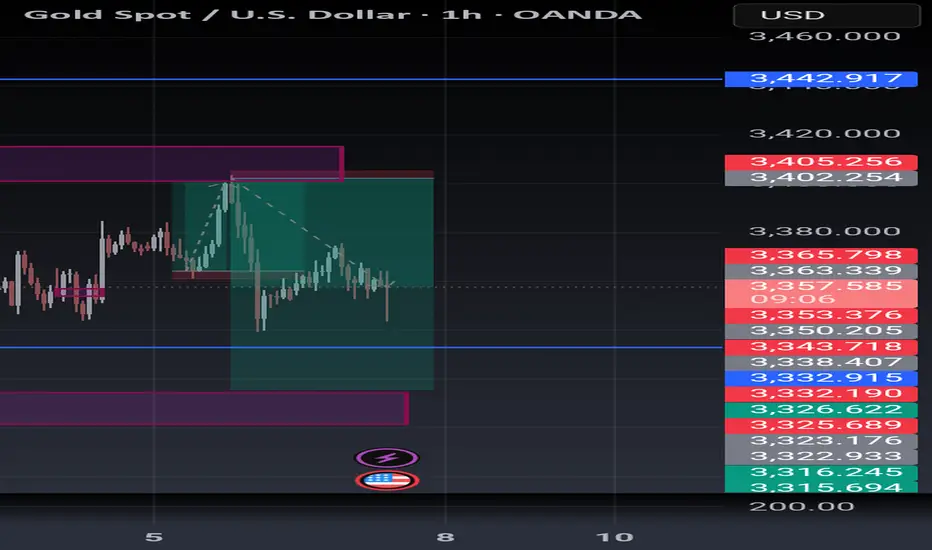
AJA's Gold view. The Bear is in charge for now.Just the start of the Bearish move.
Like I analysed. For now, we're selling till 3315.
Check my last analysis. What do you think?
06.06.25 Morning ForecastPairs on Watch -
FX:EURUSD
FX:AUDUSD
FX:USDJPY
FX:AUDCAD
A short overview of the instruments I am looking at for today, multi-timeframe analysis down to what I will be looking at for an entry. Enjoy!

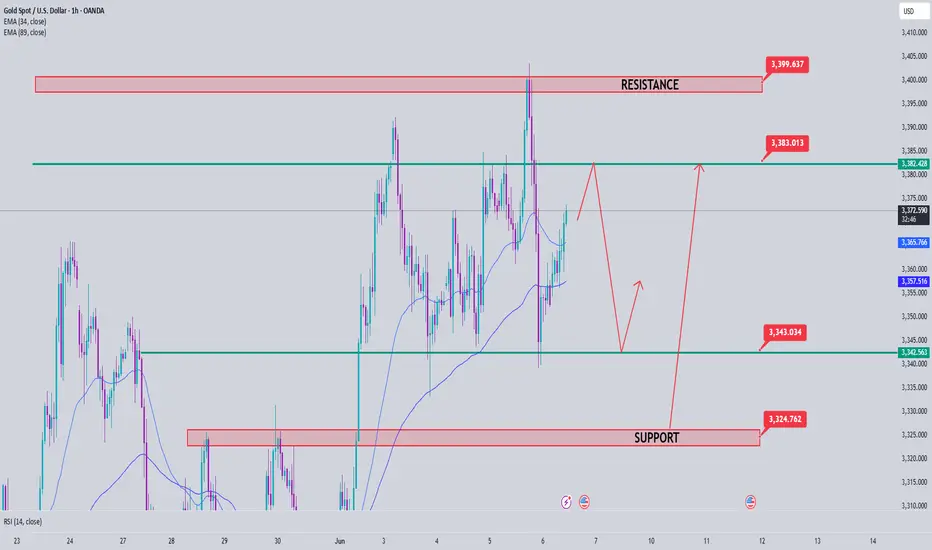
Gold Price Analysis June 63 D1 candles closed without breaking through 50% of the previous bullish main candle. Today's main view will be BUY up to 34xx
Today's resistance is around 3413 for the SELL strategy of the US Session. The Asian and European Session is looking for a BUY point. There was just a nice BUY beat around 3363 where the price swept liquidity to 3369.
3382 is the target for the BUY order and this area can SELL Scalp in today's Asian and European session because today's target is up to 3413.
In the direction of Gold Down, contrary to the analysis, the support zone 3341 and support 3324 will support the upward force of gold prices.
Breakout boundary zone 3382 and 3341. Note that the break out does not block the train
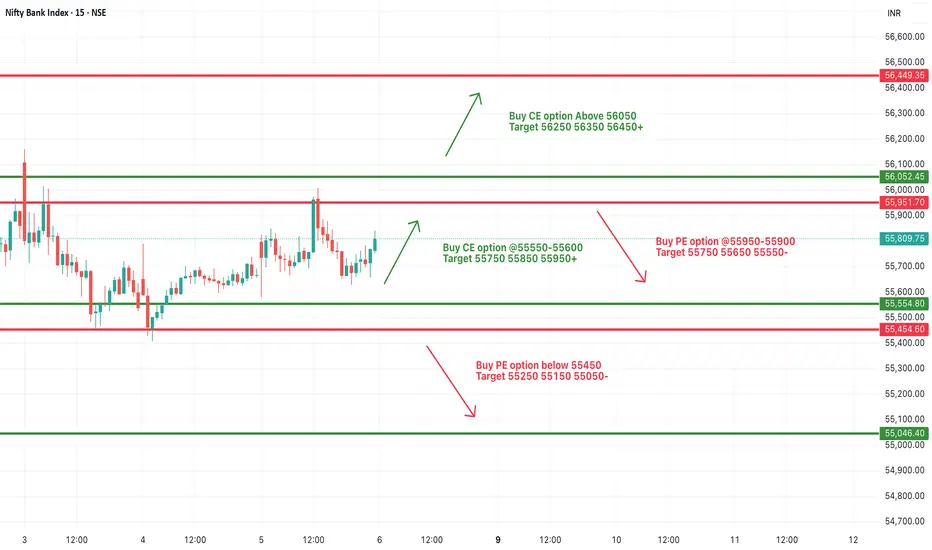
[INTRADAY] #BANKNIFTY PE & CE Levels(06/06/2025)Bank Nifty is opening with a slight gap-up around 55800, but continues to consolidate in the same range that has held for the past few sessions. Despite attempts, no significant breakout or breakdown has occurred, indicating indecision and a potential buildup for a larger move.
Upside continuation will only be confirmed if the index sustains above 56050, opening room for a move toward 56250, 56350, and 56450+.
On the other hand, if price starts slipping back below 55900–55850, the index may retrace toward 55750, 55650, and 55550. Breakdown below 55450 will be a clear sign of weakness, targeting 55250, 55150, and 55050.
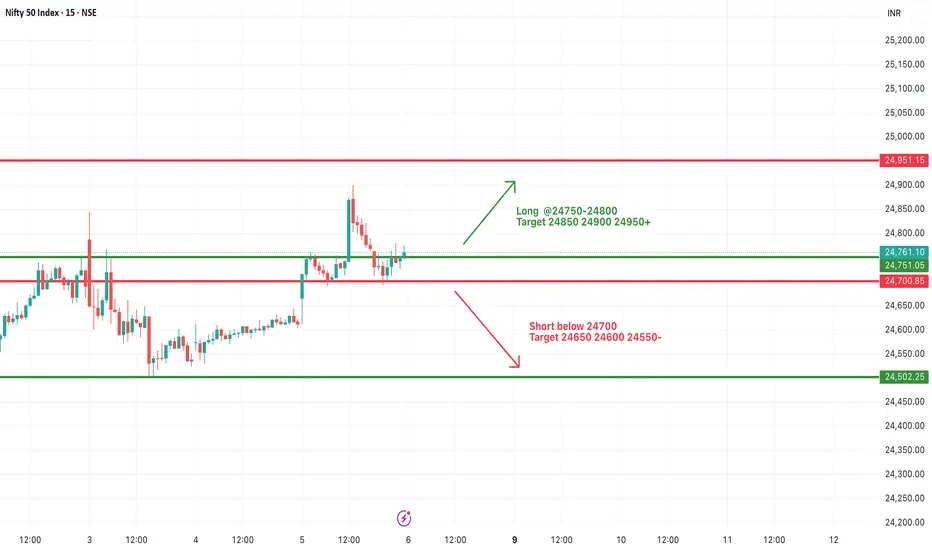
#NIFTY Intraday Support and Resistance Levels - 06/06/2025Nifty is opening with a slight gap-up around 24750–24760, placing it just above a key resistance-turned-support level. This setup suggests early optimism, but follow-through momentum is crucial for confirmation.
If Nifty sustains above 24800, it may pave the way for a smooth upside toward 24850, 24900, and 24950+. This range could act as a momentum zone for intraday buyers if volume supports the move.
On the flip side, a slip back below 24700 may signal weakness and open downside targets at 24650, 24600, and 24550, pulling Nifty back into a broader consolidation range.
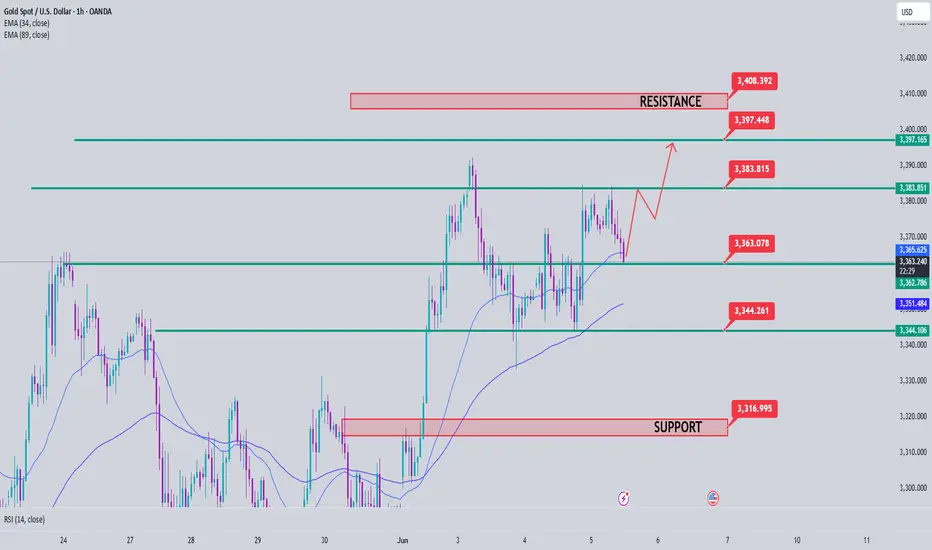
Gold Price Analysis May 6D1 Frame
It is not surprising that the price has increased again. If this momentum continues, the 3408 level can be reached today.
H1 Frame
The uptrend is clear, heading towards the area above 3400.
3363 is a good support zone, suitable for BUY orders in the Asia - Europe session.
3344 is an important level. If broken, the short-term uptrend will be broken and we need to wait for a new wave.
Resistance to watch
3382 is the nearest resistance zone in today's session.
3397 is an area prone to false breaks (old peaks). The price may react slightly here before reaching the 3408 level.
Trading strategy in US sessionGold price in the short term of the US session. The pulling of the h1 candle's wick creates an important liquidity zone of 3373. When h1 closes above this zone, it confirms that the US session will be a bullish session and can reach 3398 at the end of the session. If it closes below 3373, the BUY zone will be noticed at the support reaction in the European session around 3362.

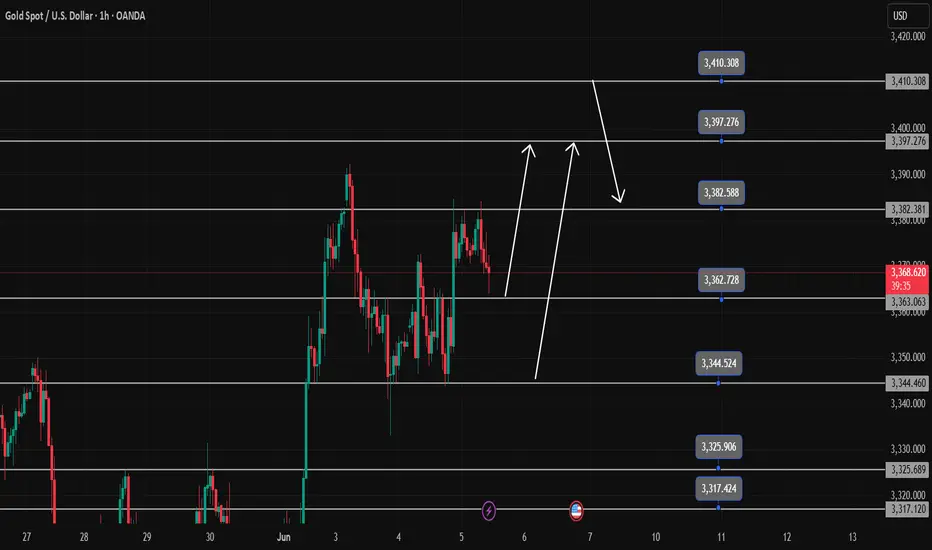
Gold Trading Strategy Overview June 5There is not much surprise with the D candlestick having increased again. The increase can completely reach 3408 today.
The H1 wave structure also shows that the trend is increasing strongly and heading towards above 3400. 3363 is considered the first BUY support zone in the Asian and European sessions today.
3344 is the most important boundary zone of the trend, breaking this zone will cause the uptrend to break to 3400 in the short term and must wait for new uptrend waves.
In the opposite direction, 3382 is the resistance zone of the Asian and European sessions today and is also the breakout zone, this zone will reach above 3400 but before that there will be a reaction around 3397, which is a very likely flash break zone of the previous peak.
Resistance: 3382-3397-3410
Support: 3363-3344-3325-3317
Pay attention to trading at support and resistance zones when there is confirmation
05.06.25 Morning ForecastPairs on Watch -
FX:AUDUSD
OANDA:XPTUSD
A short overview of the instruments I am looking at for today, multi-timeframe analysis down to what I will be looking at for an entry. Enjoy!

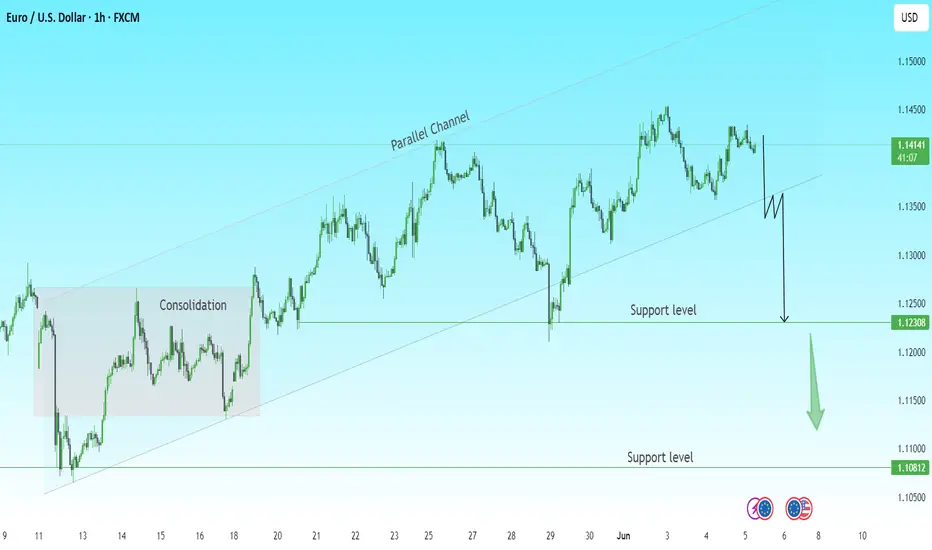
EURUSD Analysis | Potential Breakdown AheadHello Traders
The pair has been respecting a rising parallel channel after breaking out from a consolidation zone earlier this month.
🔹 Current Price: 1.1409
🔹 Trend: Uptrend within a rising channel
🔹 Key Observation: Price is testing the upper range but showing signs of weakness.
🔍 Technical Breakdown:
Price recently failed to make a new high, showing signs of exhaustion.
A break below the channel support could trigger a sharp move downward.
Two strong support levels are in focus:
1.12308 (short-term target)
1.10812 (major target)
📉 Bearish Scenario:
If we get a confirmed break below the channel, I’ll be looking for short opportunities with the first target at 1.1230, and if momentum continues, down to 1.1080.
⚠ Watch for rejection candles or a strong bearish close below the channel support to confirm the move.
💬 What’s your bias on EUR/USD? Are you trading this potential setup?
#EURUSD #Forex #TechnicalAnalysis #PriceAction #TradingView #ChartAnalysis