GBPAUD Bullish Break and RetestAfter weeks of consolidation, GBPAUD has broken out above key resistance at 2.0800–2.0830, flipping structure to bullish on the higher timeframes. Price is now retesting this zone.
Wait for bullish confirmation.
Priceactionanalysis

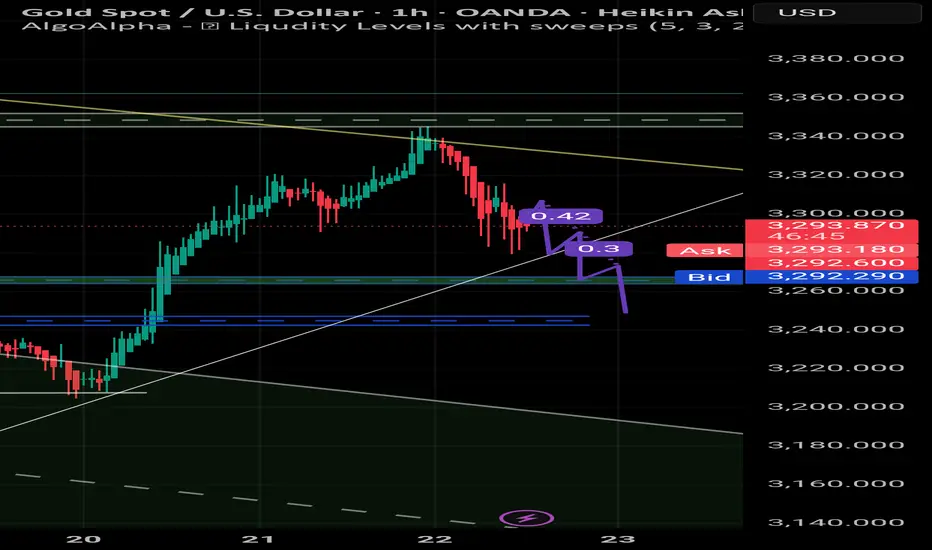
Gold Analysis – Key Sell Opportunity After Trendline Break | XAUGold has shown a significant rejection from the 3340–3350 resistance zone and broke below the ascending trendline. The price is currently retesting the breakout area around 3294, which may act as a new supply zone. Based on current market structure and liquidity behavior, a short position is now favorable.
Trade Plan:
Entry Zone: 3294 – 3300
Stop Loss: Above 3310
Take Profit 1: 3260
Take Profit 2: 3240
Market volatility remains high, and price may hunt liquidity toward the 3240 zone before a potential bounce. Monitor U.S. session volume and possible news catalysts.
22.05.25 Morning ForecastPairs on Watch -
FX:EURUSD
FX:EURGBP
FX:GBPJPY
A short overview of the instruments I am looking at for today, multi-timeframe analysis down to what I will be looking at for an entry. Enjoy!

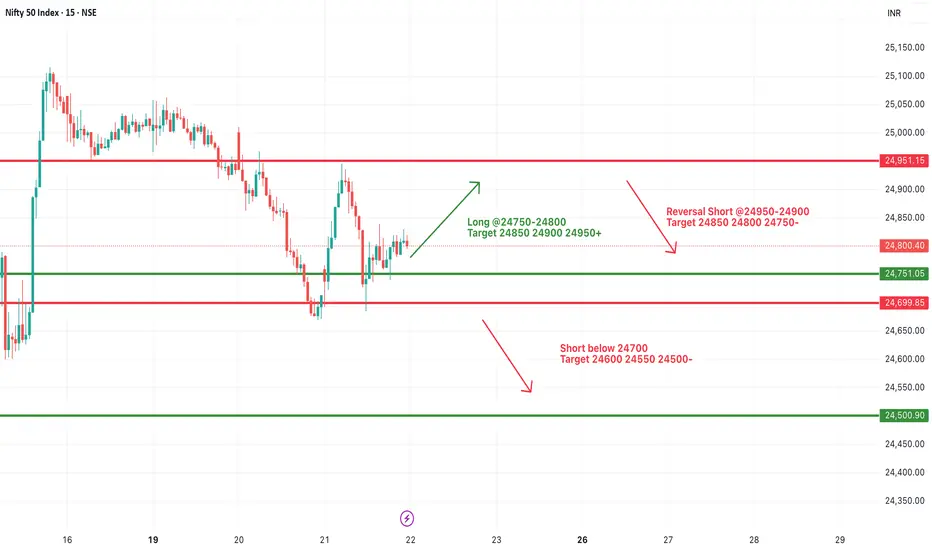
#NIFTY Intraday Support and Resistance Levels - 22/05/2025Today a flat opening is expected in Nifty. After opening, if Nifty sustains above the 24750–24800 level, an upside movement is likely towards 24850, 24900, and possibly up to 24950+, which will act as a strong resistance zone for today’s session. Any rally reaching this level may witness a reversal.
On the downside, if Nifty starts trading below 24700, a major downside movement is expected towards 24600, 24550, and potentially 24500– levels in today’s session.
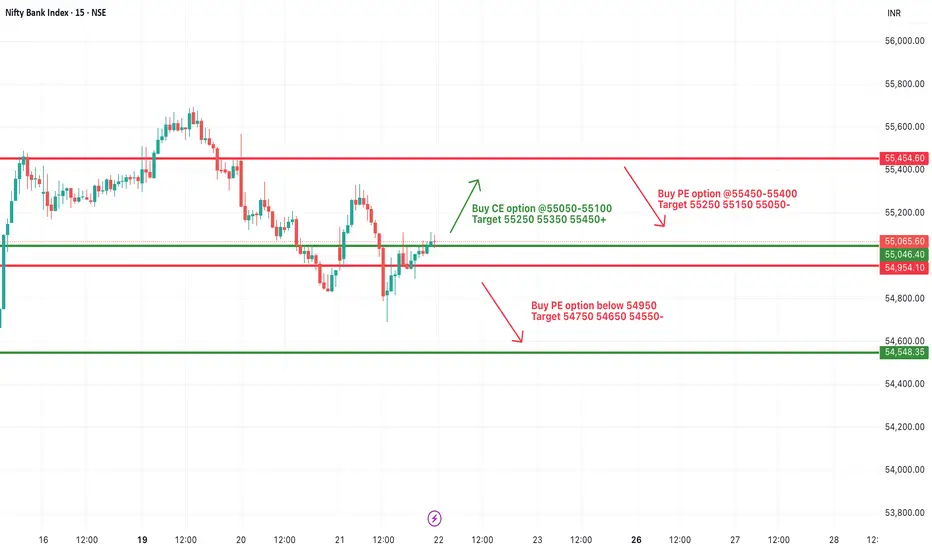
[INTRADAY] #BANKNIFTY PE & CE Levels(22/05/2025)Today, a flat opening is expected in Bank Nifty. After opening, if Bank Nifty starts trading below the 54950 level, a further downside movement is possible towards the 54750, 54650, and 54550 levels during the session.
On the upside, if Bank Nifty begins to trade and sustain above the 55050–55100 zone, it could trigger a bullish move toward 55250, 55350, and potentially 55450+.
However, 55450 will act as a strong resistance for today’s session — any upside rally may face rejection or reversal from this level.
Trade with strict stop loss and keep trailing profits as market can remain range-bound with spikes.
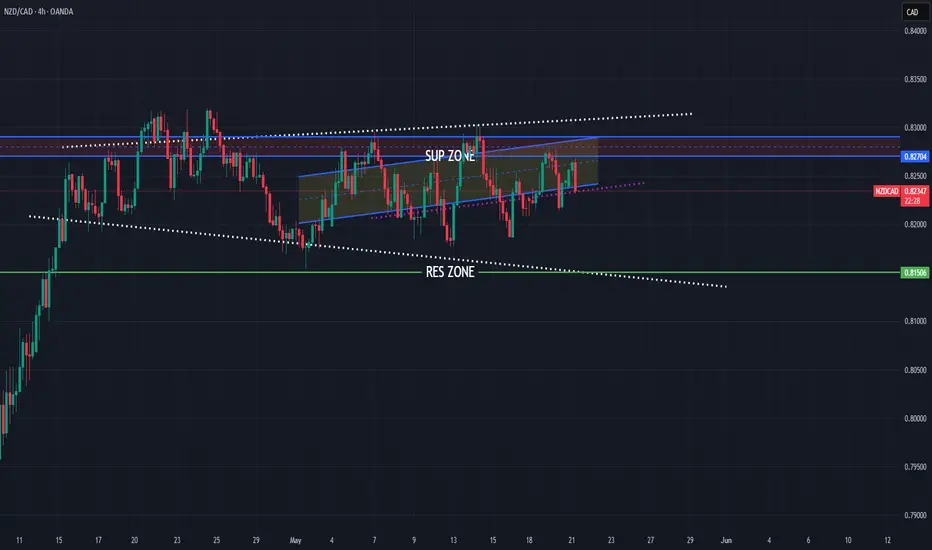
NZDCAD bearish expectations after RBA
OANDA:NZDCAD price action visible, price currently in ascending channel, moving zig-zag last two weeks, here after yesterday RBA, having bearish expectations.
Break of violet doted line can be taked for confirm.
SUP zone: 0.82700
RES zone: 0.81500
21.05.25 Morning ForecastPairs on Watch -
FX:GBPAUD
FX:EURNZD
FX:GBPJPY
A short overview of the instruments I am looking at for today, multi-timeframe analysis down to what I will be looking at for an entry. Enjoy!

$ARB time to fly $1 this bull run 2025 and it's Last Wave...AMEX:ARB Time to Fly and Touching $1 this Quarter. I guess it will be happened and gain bonuses $1+ and $2+ if big investor entry on this token.
My Magic Indicator Say ARB Price have touch Yellow line. Previous Day, Bounce back to above Yellow Line and It's Bull Run 2025 for ARB .
From News: ARB Eyes Trend Reversal With Breakout Signal Above $0.45 This Week
Arbitrum is trading at $0.41 inside a falling wedge and a breakout above $0.45 might confirm a wide shift from its yearlong downward trend.
Arbitrum has formed a falling wedge with lower highs and higher lows now compressing price at $0.41.
If the price moves above $0.45 with strong volume this could confirm a new bullish pattern for $ARB.
The wedge has been forming since 2024 and a breakout may signal the start of a strong trend reversal.
The descending wedge pattern forming on the Arbitrum chart spans nearly one year, beginning from its 2024 highs near $2.50. Several failed rallies marked by red arrows define the top boundary, while green arrows at the base represent support retests. This structure has now tightened into a narrow apex where breakout probability increases significantly.
#Write2Earn #BinanceSquareFamily #Binance #BTC☀ #SUBROOFFICIAL
Disclaimer: This article is for informational purposes only and does not constitute financial advice. Always conduct your own research before making any investment decisions. Digital asset prices are subject to high market risk and price volatility. The value of your investment may go down or up, and you may not get back the amount invested. You are solely responsible for your investment decisions and Binance is not available for any losses you may incur. Past performance is not a reliable predictor of future performance. You should only invest in products you are familiar with and where you understand the risks. You should carefully consider your investment experience, financial situation, investment objectives and risk tolerance and consult an independent financial adviser prior to making any investment.

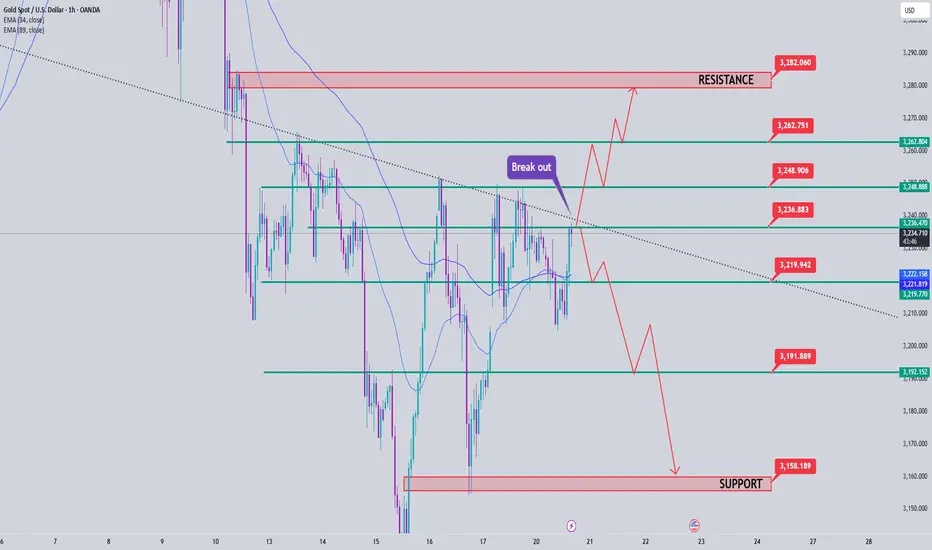
Gold Price Analysis May 20Yesterday's D candle is still in the sideways range of Gold, showing only a little bit of bullish force and the next developments are unclear.
Gold has broken out of 3218 and is heading towards resistance 3236 in the late European session. This is also an important breakout zone, if it breaks this zone, Gold will find 3282 in the US session, which is completely possible. The resistance zones around 3250 are really no longer valuable for the return of Gold's price increase. The resistance zone is considered for Scalping to pay attention to the price reaction to SELL around 3265.
After Gold decreases, the Break out zone 3218 acts as immediate support, the Break out zone 3192 is the Target for SELL entries and if the US session's strong selling force breaks this zone, then don't buy anymore and have to wait for support 3159.
Wish you a successful transaction
#NIFTY Intraday Support and Resistance Levels - 21/05/2025Today will be flat opening expected in nifty. After opening if nifty sustain above 24750 level then expected upside movement upto 24950 level. This level will act as a strong resistance for today's session. Any upside rally can reversal from this level. Major downside expected if nifty starts trading below 24700 level. Downside 24500+ level expected in today's session.

[INTRADAY] #BANKNIFTY PE & CE Levels(21/05/2025)Today will be flat opening expected in banknifty. After opening if banknifty starts trading below 54950 level then possible further downside upto 54550 level in today's session. Upside movement expected if banknifty starts trading and sustain above 55050 level. Upside 55450 level will act as a strong resistance for today's session. Any bullish side rally can be reversal from this level.

20.05.25 Morning ForecastPairs on Watch -
FOREXCOM:COFFEE
FX:EURUSD
FX:AUDJPY
A short overview of the instruments I am looking at for today, multi-timeframe analysis down to what I will be looking at for an entry. Enjoy!

EURNZD Bullish Reversal from Demand Zone (1H Chart)✅ 1. Market Context & Structure Analysis
The pair (EUR/NZD) was in a short-term downtrend before forming a higher low, indicating a potential bullish reversal.
A W-shaped structure is visible, suggesting a double bottom around the 1.8960–1.8970 zone.
The price has bounced multiple times from the demand zone (green box), confirming strong buying interest.
The recent price action shows the market respecting structure with a clean impulse–correction–impulse pattern, creating a potential continuation leg.
📍 2. Entry Criteria
Entry Price Range: 1.8960 – 1.8970
Why?
This area coincides with a tested support zone, from where price previously rallied.
The current pullback to this area presents a low-risk buying opportunity.
Candlestick confirmation (e.g., bullish engulfing or pin bar) would further validate the entry.
🔐 3. Stop Loss (Risk Management)
Stop Loss Placement: Below 1.8930
Reasoning:
Keeps SL below the structure low and the demand zone.
If price breaks this level, it invalidates the bullish setup and prevents deeper losses.
🎯 4. Take Profit Levels (Targets)
TP1 -1.9050 Minor resistance / partial booking
TP2 -1.9100 First key resistance zone
TP3 -1.9140 Swing high and strong supply area (red zone)
Risk-to-Reward (R:R): ~1:2.5 to 1:3+
You can trail your stop as price moves toward these levels.
📊 5. Technical Confluences
✅ Support Zone: Price bounced multiple times from 1.8960
✅ Bullish Market Structure: Higher highs and higher lows are forming
✅ Chart Pattern: Double bottom / W-pattern breakout potential
✅ Fibonacci (optional): The zone may also align with a 61.8% retracement (not shown but often observed)
⚙️ 6. Trade Management Strategy
🔄 Partial Exit: Book 50% profits at TP1
⏫ Trail SL: Move SL to entry after TP1 hit to make trade risk-free
🔚 Full Exit: At TP3 or if strong bearish reversal candle forms near resistance
⚠️ 7. Risk Disclaimer & Notes
Avoid overleveraging. Only risk 1–2% of your capital.
Reconfirm the trade setup during the London or early NY session for better volatility.
News events (like RBNZ or ECB speeches) could increase volatility — always check the economic calendar before entry.
========================================================
Disclosure: I am part of Trade Nation's Influencer program and receive a monthly fee for using their TradingView charts in my analysis.

#NIFTY Intraday Support and Resistance Levels - 20/05/2025Flat opening expected in nifty in consolidation zone of 24950-25050 level. No major changes in yesterday's levels. Any strong rally only expected after breakout or breakdown of this zone. Upside bullish rally expected if nifty starts trading and sustain above 25050 level this upside rally can goes upto 25250+ level in today's session. Any major downside rally possible below 24950. Downside 24750 level will act as a strong support for today's session.

[INTRADAY] #BANKNIFTY PE & CE Levels(20/05/2025)Today will be flat opening in index. Currently index trading in the consolidation zone. Upside movement can expected if banknifty sustain above 55550 level in today's session. Similarly, Downside expected below 55450 level. Downside 55050 will act as a strong support for today's session.

Balkrishna , 1W Looking very Good pattern , and it is at Support level now
so the Risk is Very low . So Prefer to take the Trade at Low Risk Place
Risk according to your capital and risk capacity
if you missed at Support level wait for Clear Breakout to happen
then Enter , if you Missed After Breakout Avoid it completely
Follow For More Ideas like This

19.05.25 Morning ForecastPairs on Watch -
FX:GBPJPY
FX:CADJPY
FOREXCOM:COFFEE
A short overview of the instruments I am looking at for today, multi-timeframe analysis down to what I will be looking at for an entry. Enjoy!

TATA Tech Breakout: Inverted Head & Shoulder Targets ₹856+A bullish reversal pattern forming in Tata Technologies Ltd (TATATECH) on the daily timeframe.
Pattern Identified:
📌 Inverse Head and Shoulders Pattern
Left Shoulder: Price dips and recovers
Head: A deeper dip followed by recovery
Right Shoulder: A higher low and bounce
Neckline: Resistance around ₹755 is tested multiple times
Key Technical Insights:
Breakout Above Neckline: Today's close above ₹755 confirms breakout
Target Projection:
Target = Neckline + Height (from Head to Neckline)
Projected Target = ₹856+
Volume Confirmation (optional): Typically, volume should rise during breakout for stronger confirmation
Sentiment:
Reversal from downtrend to possible uptrend
Bullish momentum expected to continue toward the ₹856+ zone
#NIFTY Intraday Support and Resistance Levels - 19/05/2025Flat opening expected in nifty in consolidation zone of 24950-25050 level. Any strong rally only expected after breakout or breakdown of this zone. Upside bullish rally expected if nifty starts trading and sustain above 25050 level this upside rally can goes upto 25250+ level in today's session. Any major downside rally possible below 24950. Downside 24750 level will act as a strong support for today's session.

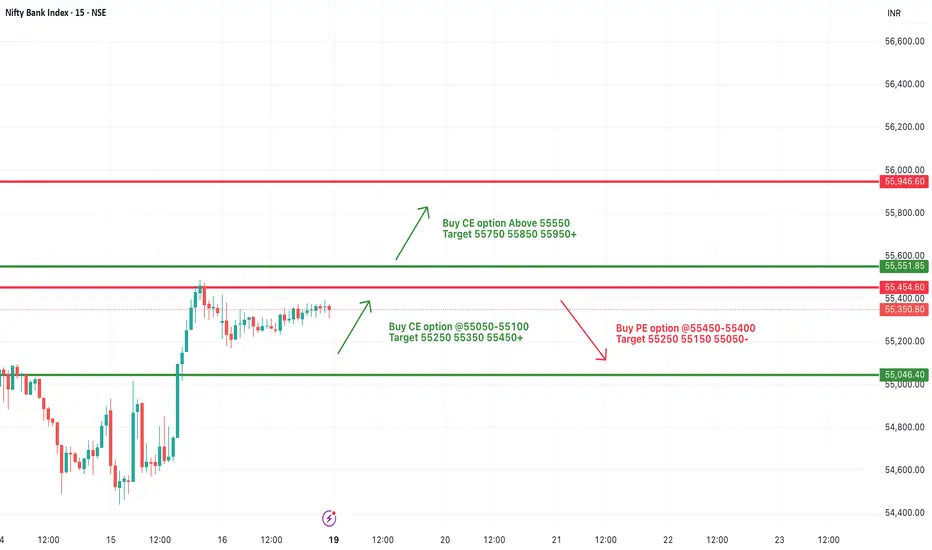
[INTRADAY] #BANKNIFTY PE & CE Levels(19/05/2025)Today will be flat opening expected in banknifty. After opening possible banknifty will consolidate in between 55050-55450 level in today's session. Strong upside rally expected if banknifty gives breakout and starts trading above 55550 level. This upside rally can goes upto 55950+ level after the breakout. Any major downside only expected below 54950 level.
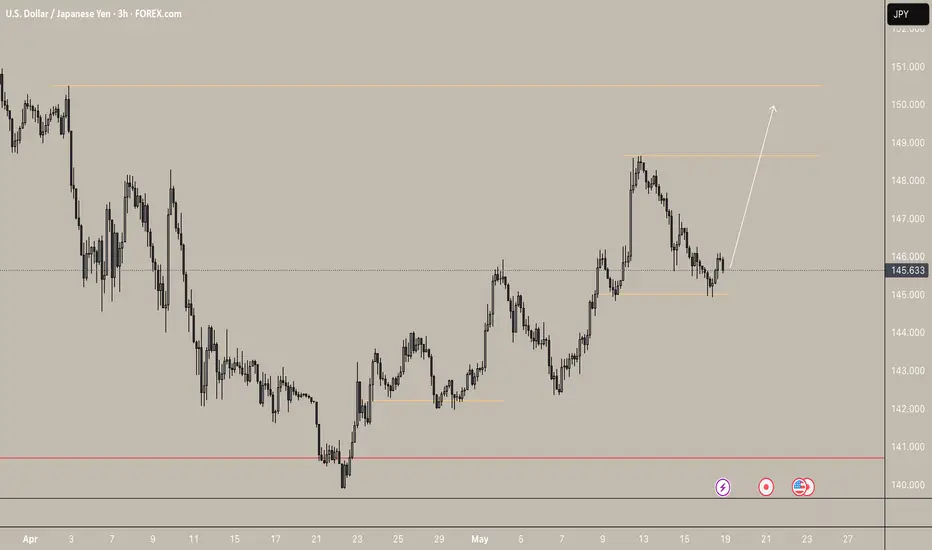
USDJPY Bullish Breakout Setup – Retest at Key Demand ZoneUSDJPY is respecting a clean bullish structure after rebounding from the 140.100 base. Price made a higher high near 148.650, followed by a pullback into the previous demand zone around 145.000.
Technical Breakdown:
Market Structure: Higher highs and higher lows indicate a strong uptrend.
Demand Zone: Clean reaction from the 145.000 zone, which previously acted as resistance-turned-support.
Target Zones:
First TP: 147.900 (previous swing high)
Final TP: 150.600 (key resistance level)
Invalidation Level : Close below 144.800 could invalidate this bullish scenario.
If price sustains above 145.000, the bullish trend is likely to continue.
As always, manage risk carefully.
Like & Follow for more clean, high-timeframe breakdowns!
Swing analysis on Gold of target achieving storyHow far accuracy goes in your analysis ??
swing analysis in Gold.
Follow for more simple and accurate analysis of INDEX |COMMODITIES| CURRENCY

USDJPY analysis week 21Fundamental Analysis
USD/JPY recovered slightly on Friday as the USD recovered and traded sideways around the DXY index level of 100.80.
The Japanese Yen (JPY) strengthened despite a decline in Japan's GDP, due to its safe-haven status and expectations that the BOJ will not raise interest rates soon.
The BOJ kept interest rates at 0.5%, lowered its 2025 GDP growth forecast to 0.5% and may pause interest rate hikes until September to monitor the impact of US tariffs.
The Fed kept interest rates unchanged, no plans to cut in the near term. The Fed Chairman warned that tariffs could increase inflation and reduce growth.
Technical Analysis
USDJPY is reacting at the 89 EMA. Overall, the uptrend is still maintained for this pair and pay attention to the immediate support level of 144,000, while the pair is still trading above this area, the uptrend is still continuing. The two resistance levels that the pair could reach next week are noted at 147.500 and 148.300. In case the 144.000 trend zone is broken, the pair's slide will be supported by the May low around 142.600.
