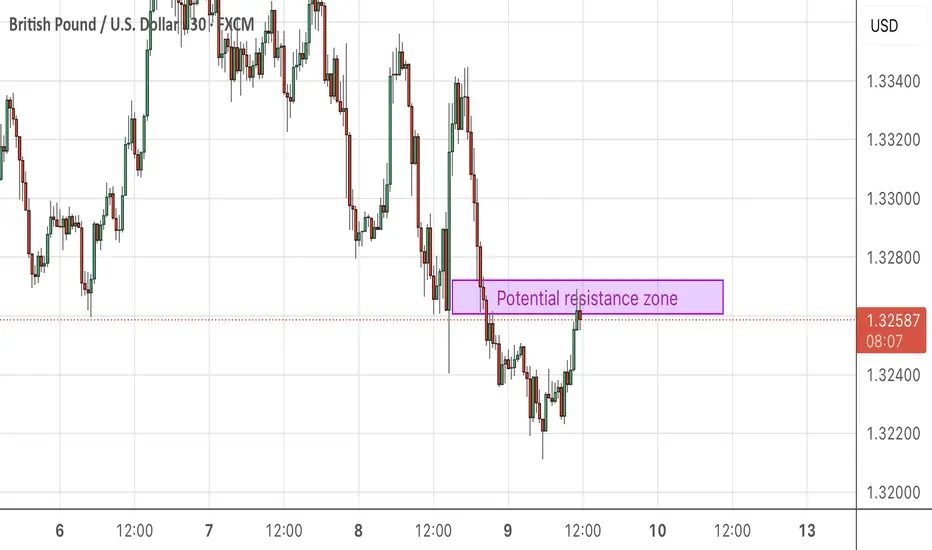
GBPUSD potential for dropping the priceHey guys,
To keep this analysis short and suitable for everyone, price has reached a good area with good potential to have a next drop.
This post will be updated soon.
Good luck and see you soon :)
Priceactionanalysis
09.05.25 Morning ForecastPairs on Watch -
FX:EURCAD
FX:USDCHF
FX:EURUSD
FOREXCOM:COFFEE
Heads up guys!! I will be heading to Greece today so next week my morning forecast videos may not be as consistent, due to internet and just not having my full equipment, so I will do my very best to get some forecasting posted for you all!
A short overview of the instruments I am looking at for today, multi-timeframe analysis down to what I will be looking at for an entry. Enjoy!

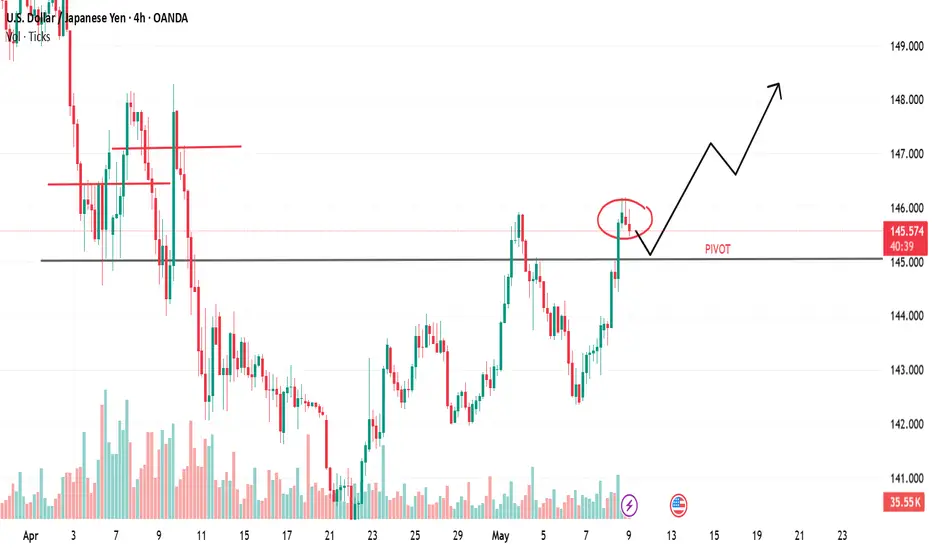
USDJPY with Price ActionPrice has broken above the key pivot zone around 145.00, which previously acted as resistance and may now flip into support. We’re currently seeing a minor pullback near the 145.60–146.00 zone after a strong bullish impulse. This red-circled area highlights hesitation, but as long as the price holds above the pivot, I’m maintaining a bullish bias.
The market structure remains clean with higher highs and higher lows. The volume spiked during the move up and has decreased on the pullback—exactly what I want to see in a healthy retracement. I'm watching for a bullish reaction at or slightly above 145.00 to confirm continuation.
If we get a strong bounce from the pivot zone, I’m targeting 147.00 as the first level and 148.50 as the extended target. However, if price breaks and closes below 145.00 with momentum, I’ll reassess—downside support could be around 143.50–144.00.
Next steps: Waiting for a confirmation entry signal (bullish engulfing or strong rejection wick) near the pivot. Key risk to this setup is upcoming USD news and any BoJ commentary that could trigger volatility.
Staying patient—will update if the pivot holds or fails.
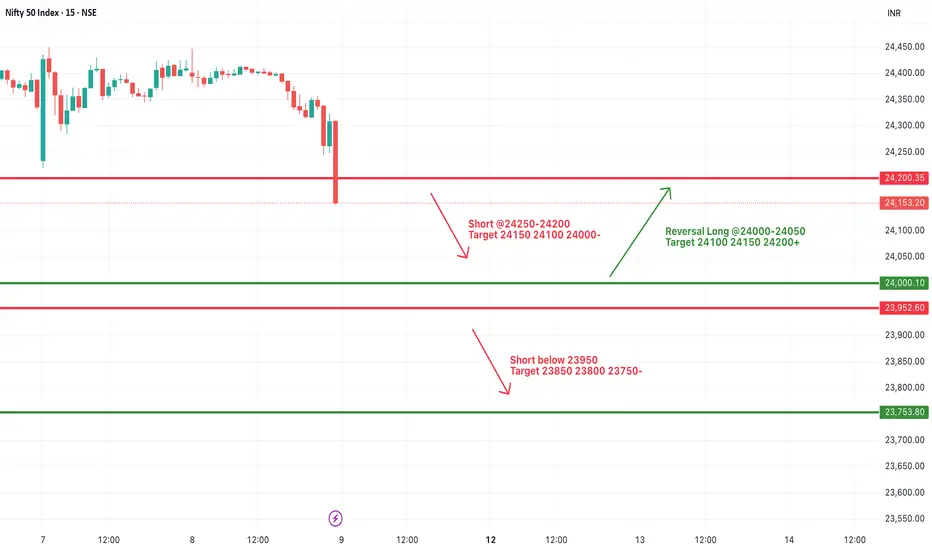
#NIFTY Intraday Support and Resistance Levels - 09/05/2025Gap down opening expected in nifty. After opening if nifty starts trading below 23950 level then possible further downside upto 23750. Any upside movement can possible if nifty sustain above 24000 level. Upside 24200-24250 zone act as a strong resistance for today's session. Any upside rally can reversal from this level.
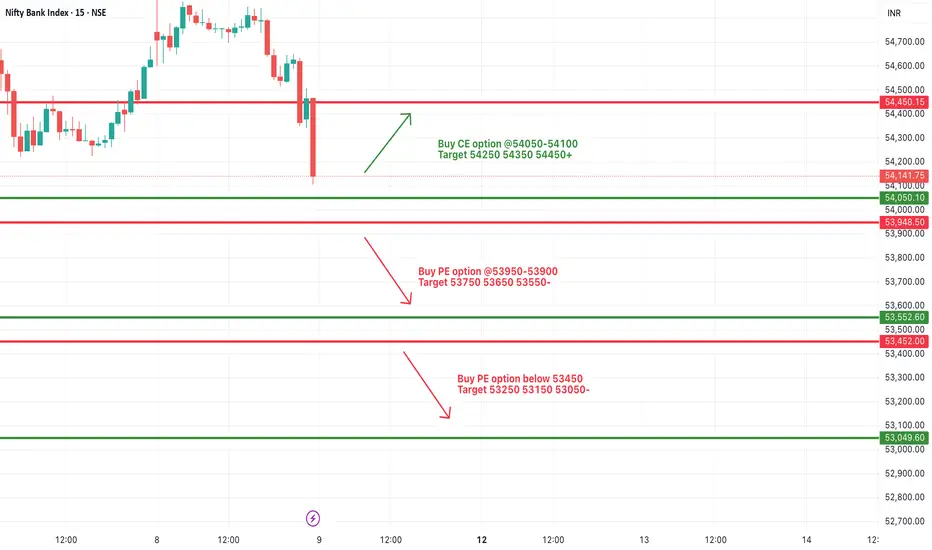
[INTRADAY] #BANKNIFTY PE & CE Levels(09/05/2025)Today will be gap down opening expected in banknifty. Expected opening near 54000 level. After opening if banknifty started trading below 53950 level then expected further downside rally upto 53550 level and this can be extend for further 400-500+ points if it gives breakdown of 53450 level. Any upside movement expected if banknifty sustain above 54050 level.
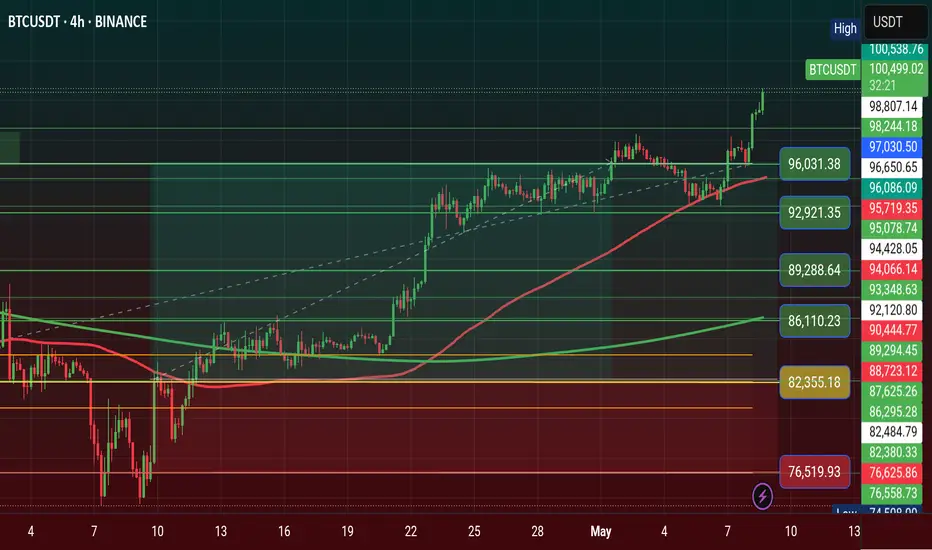
$BTC Finally $100K Surprised and Take Profit Done✨ CRYPTOCAP:BTC Surprise Finally Touch $100K Milestone again, All Take Profit and bonus Done.
💫 From Breaking News:
• Arizona Bitcoin Bill: Crucial SB 1373 Advances for State Bitcoin Reserve
• New Hampshire Becomes First to Approve Bitcoin Reserve—Will Other States Follow?
First introduced in January, HB 302, gives officials the ability to allocate state funds to both precious metals, and specific digital assets with a market capitalization of over $500 billion. That means Bitcoin, which, as of this writing, has a market cap of roughly $1.9 trillion per TradingView, is a prime candidate.
The newly enacted law states that any digital assets obtained must be kept using high security custody protocols. This can be done directly in a state managed multisignature wallet, via a qualified financial institution custody, or by investment in U.S. regulated exchange traded products (ETPs). Dennis Porter, CEO and Co-Founder of Satoshi Action, said:
“Satoshi Action drafted the model, New Hampshire engraved it into law, and now every treasurer nationwide can follow that roadmap. HB 302 proves you can protect taxpayer money, diversify reserves, and future-proof state treasuries all while embracing the most secure monetary network on Earth. New Hampshire didn’t just pass a bill; it sparked a movement.”
#Write2Earn #BTC #BinanceSquareFamily #MarketRebound #SUBROOFFICIAL
Disclaimer: This article is for informational purposes only and does not constitute financial advice. Always conduct your own research before making any investment decisions. Digital asset prices are subject to high market risk and price volatility. The value of your investment may go down or up, and you may not get back the amount invested.
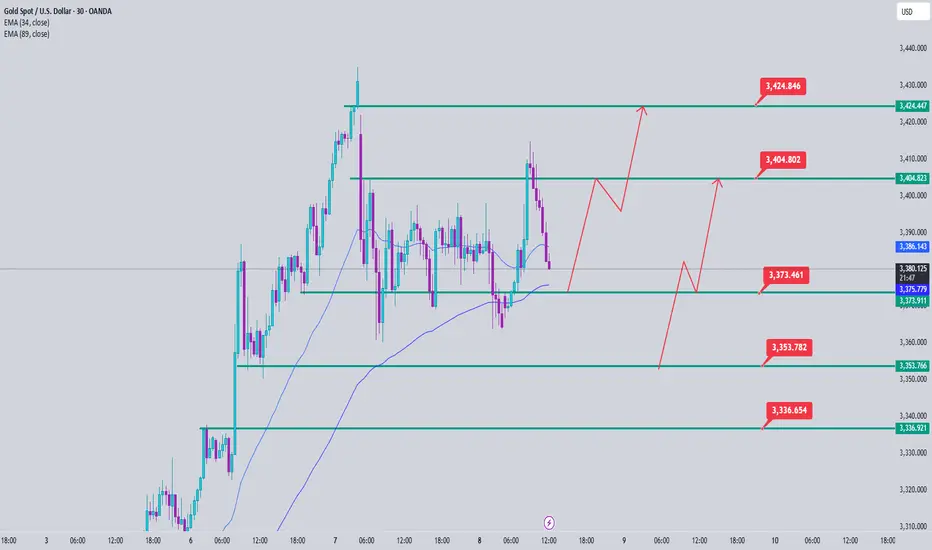
Gold Price Analysis May 8D1 candlesticks started to show some selling pressure but were still pushed back by buyers at the beginning of today's Asian session
Gold is falling at the end of the Asian session towards 3373. BUY zones are noted at the support zones that buyers are waiting for first 3373-3353-3338
On the opposite side, the sell borders 3405 and 3424 are considered for scalping when the price pushes up. These are data analyzing price zones with strong buying and selling pressure in the past, paying more attention to the current price reaction to have the best trading strategy.
08.05.25 Morning ForecastPairs on Watch -
FX:AUDCAD
FX:EURCAD
FX:USDCHF
FOREXCOM:COFFEE
A short overview of the instruments I am looking at for today, multi-timeframe analysis down to what I will be looking at for an entry. Enjoy!

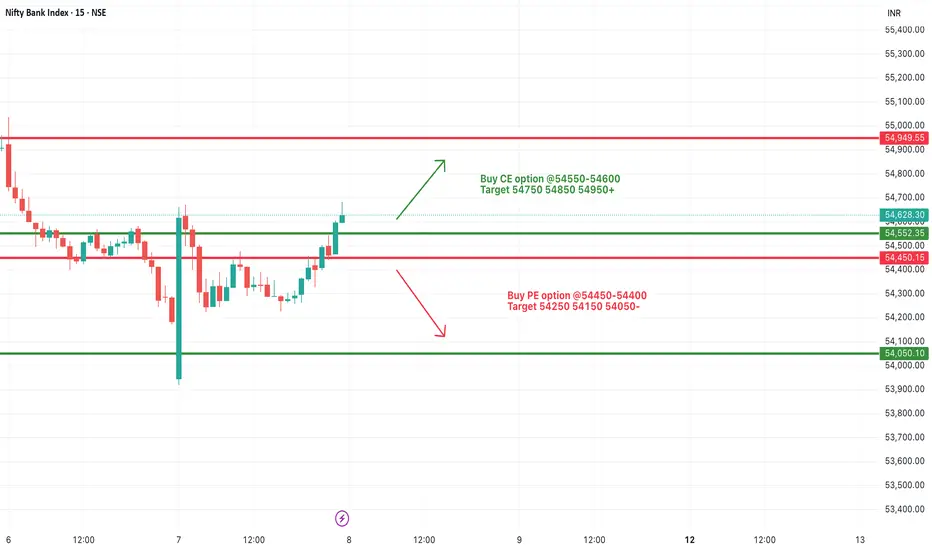
[INTRADAY] #BANKNIFTY PE & CE Levels(08/05/2025)Flat opening in banknifty. After opening if banknifty sustain above 54550 level then expected upside movement upto 54950+ level in opening session. Downside movement expected if banknifty starts trading below 54450 level. Downside 54050 level will act as an important support for today's session. Any major downside only expected below this support level.
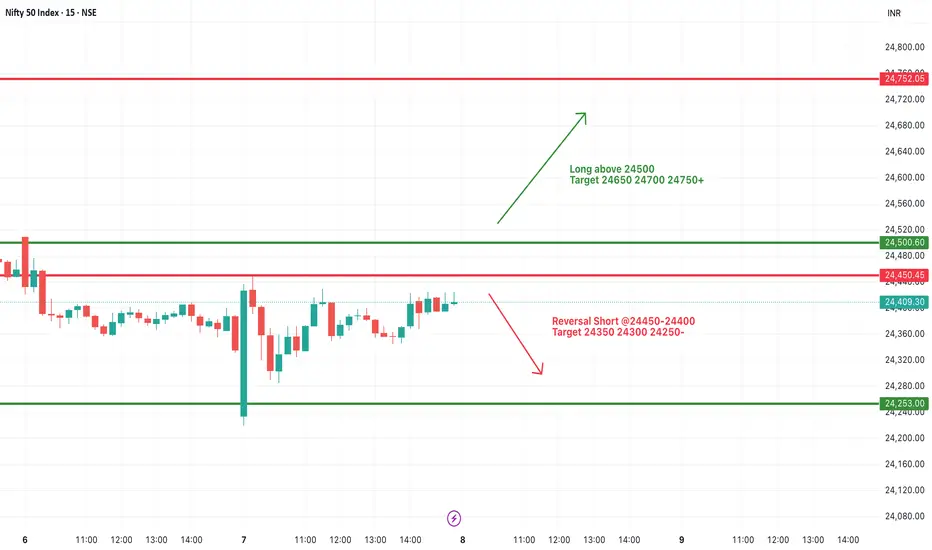
#NIFTY Intraday Support and Resistance Levels - 08/05/2025Flat opening expected in index. After opening it will face major resistance at 24500 level. If reversal from this level can give downside movement upto 24250 support level. Strong upside rally only expected if nifty starts trading and sustain above 24500 level. Currently nifty consolidating in between range of 24250-24450 levels.
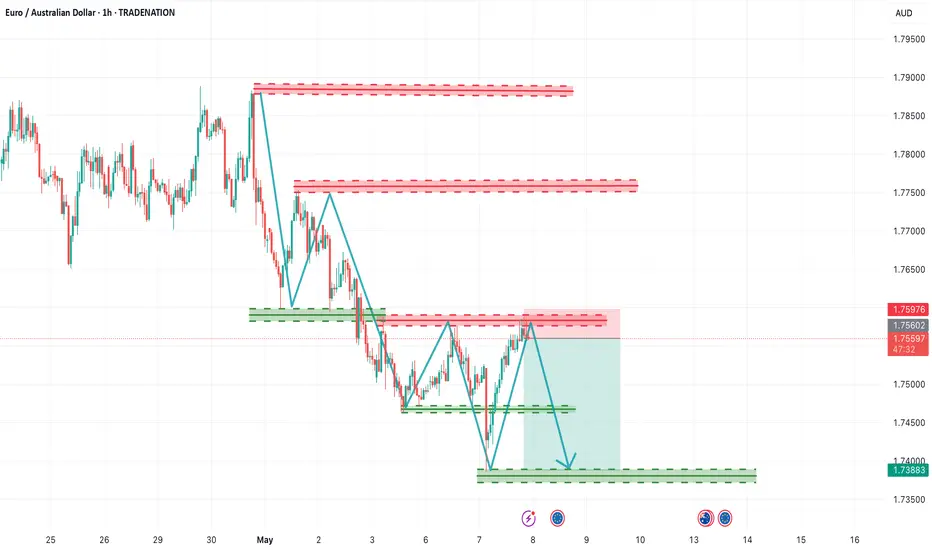
EUR/AUD Forms Bearish Lower High for Next Leg Down!Timeframe: 1-Hour (H1)
Ideal for swing or position-based intraday trades.
Entry Area (Supply Zone):
Price is reacting from 1.75850 – 1.75970 — strong resistance from prior structure.
Bearish Pattern:
Clear lower highs and supply test failure with rejection — confirms sellers' control.
Stop Loss:
Placed just above the resistance zone near 1.75976.
Target Zone (Demand):
Final green demand zone around 1.73880 – 1.74000 — key support and recent low.
Bearish Wave Projection:
Marked by consistent lower lows and tight bearish continuation structure.
Risk-to-Reward:
Very healthy setup with approx. 1:3+ RRR (ideal for professional entries).
==================================================================
Disclosure: I am part of Trade Nation's Influencer program and receive a monthly fee for using their TradingView charts in my analysis.
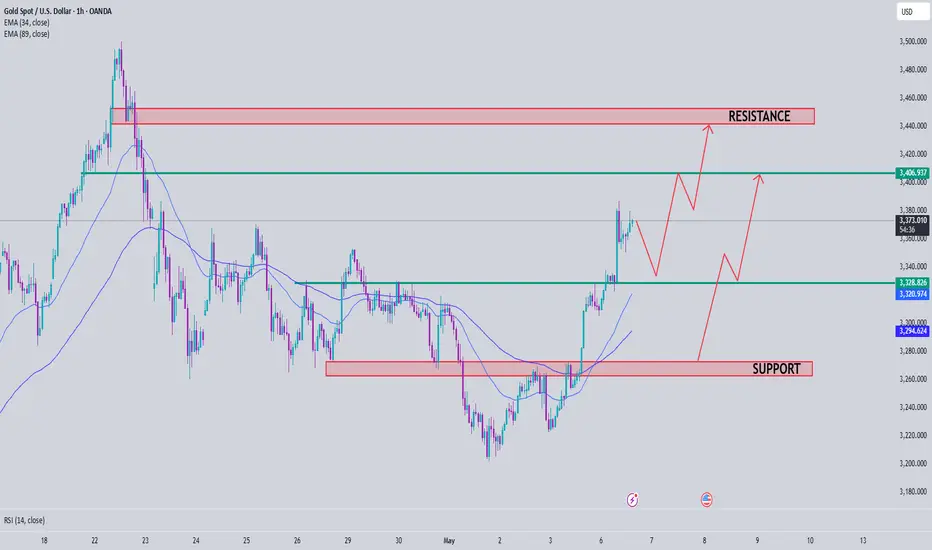
Gold price analysis May 6Due to the impact of world economic and political tensions. The gold candle has reversed to increase again with the D1 candle increasing by nearly 100 prices.
The gold uptrend has formed and it is easier to trade to find entry zones. Today's beautiful Buy zone is noticed in the price retests to the Break out zone. 3328 is considered a buying opportunity today. Currently, gold is sideways in the 3372 and 3354 range. Watch for a breakout to trade the breakout and wait for the main entry zone. When gold increases, it will encounter barriers or targets for buy orders at 3410. Today is a day without much important news, so the 3410 and 3328 ranges are considered strong. If it breaks through this range, pay attention to the quite far range around 3445 and 3270
07.05.25 Morning ForecastPairs on Watch -
FOREXCOM:COFFEE
FX:EURCAD
FX:USDCHF
A short overview of the instruments I am looking at for today, multi-timeframe analysis down to what I will be looking at for an entry. Enjoy!

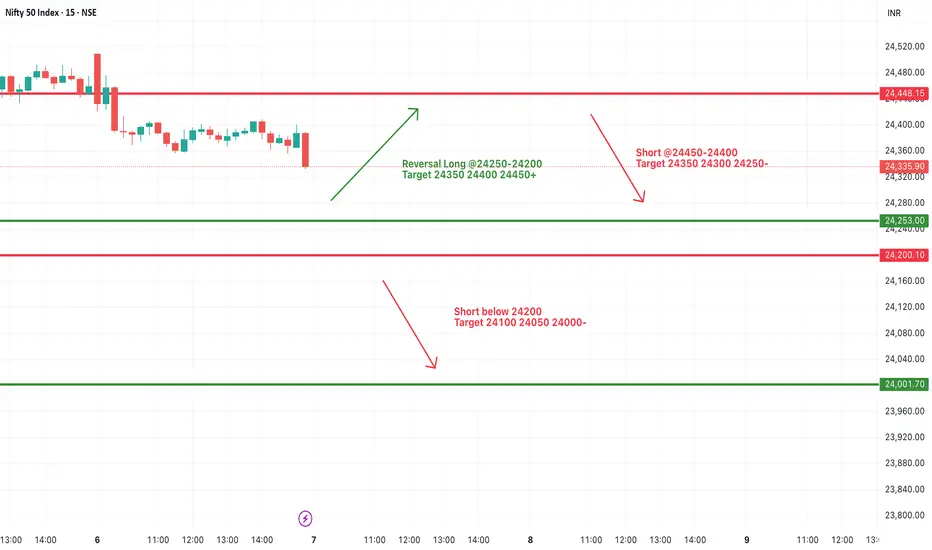
#NIFTY Intraday Support and Resistance Levels - 07/05/2025Today will be slightly gap down opening expected in nifty. After opening if nifty sustain above 24250 level then expected consolidated movements in index in between 24250-24450 level. Major downside expected in case nifty gives breakdown of support level and starts trading below 24200. This downside rally can goes upto 24000 level.
[INTRADAY] #BANKNIFTY PE & CE Levels(07/05/2025)Today will be slightly gap down opening expected in index. Expected opening near 54000 level. After opening if banknifty starts trading below 53950 level then possible strong downside movement in index upto 53550 level. Any bullish side movement expected if banknifty starts trading and sustain above 54550 level.

-1% GBPAUD & +2.5% GBPCHF Trade RecapsTwo positions I took over the last 10 trading days, both 4H entries, one long and one short.
FX:GBPAUD Short -1%
FX:GBPCHF Long +2.5%
Top down analysis explained in the video and also my thought processes behind playing both entries as limit orders to maximise R:R and protect stops much better.

06.05.25 Morning ForecastPairs on Watch -
FOREXCOM:COFFEE
FX:AUDJPY
FX:GBPUSD
FX:USDCHF
A short overview of the instruments I am looking at for today, multi-timeframe analysis down to what I will be looking at for an entry. Enjoy!

EUR/USD Rejected at Resistance – Bearish Setup in Motion!Timeframe: 15-Minute (M15)
Designed for short-term or intraday trades.
Entry Zone (Short):
Price is reacting to a fresh supply zone around 1.13260–1.13280.
Stop Loss:
Just above the supply zone, near 1.13280 (tight SL setup).
Bearish Reaction:
Price rejected resistance with a wick and bearish body — strong confirmation of selling pressure.
Target Zone (Demand):
A wide green demand area is marked at 1.12810–1.12830, providing a solid take-profit level.
Structure Bias:
Current formation shows lower highs and clear resistance respect — indicating bearish momentum.
Risk-to-Reward Ratio:
Strong RRR (more than 2:1) – minimal risk for decent reward.

#NIFTY Intraday Support and Resistance Levels - 06/05/2025Flat opening in nifty in consolidation zone of 24450-24500 level. After opening any side breakout can gives strong rally in nifty. If nifty starts trading and sustain above 24500 level then expected upside rally upto 24750+ level in today's session. Downside below 24450 level there will be further downside possible upto the 24250 support level.

[INTRADAY] #BANKNIFTY PE & CE Levels(06/05/2025)Today will be flat opening in index. After opening if banknifty starts trading and sustain above 55050 level then expected upside movement upto 55450+ level in opening session. Major downside expected if banknifty not sustain above level and starts trading below 54950 then possible downside upto 54550 support level.

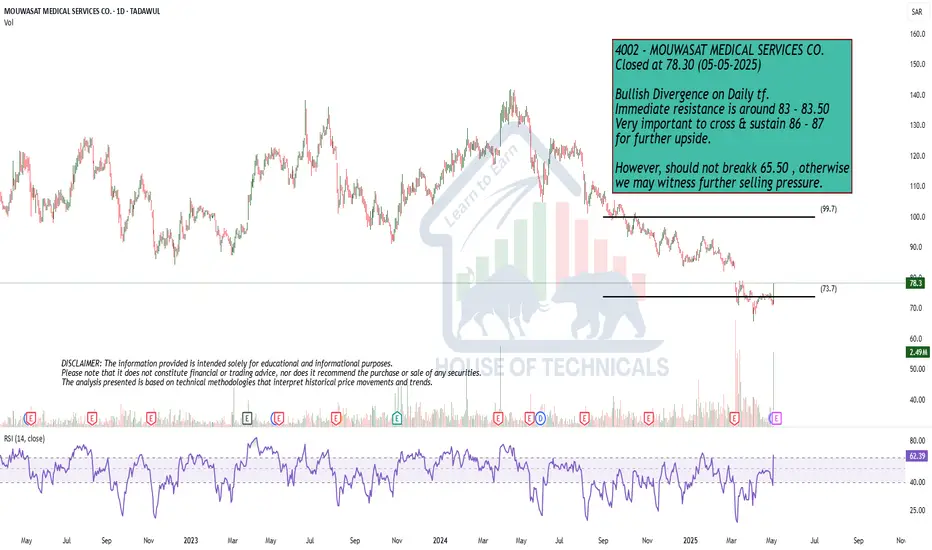
Bullish
Bullish Divergence on Daily tf.
Immediate resistance is around 83 - 83.50
Very important to cross & sustain 86 - 87
for further upside.
However, should not breakk 65.50 , otherwise
we may witness further selling pressure.
05.05.25 Morning ForecastPairs on Watch -
FX:USDCHF
FX:AUDUSD
FX:AUDCAD
FOREXCOM:COFFEE
A short overview of the instruments I am looking at for today, multi-timeframe analysis down to what I will be looking at for an entry. Enjoy!
