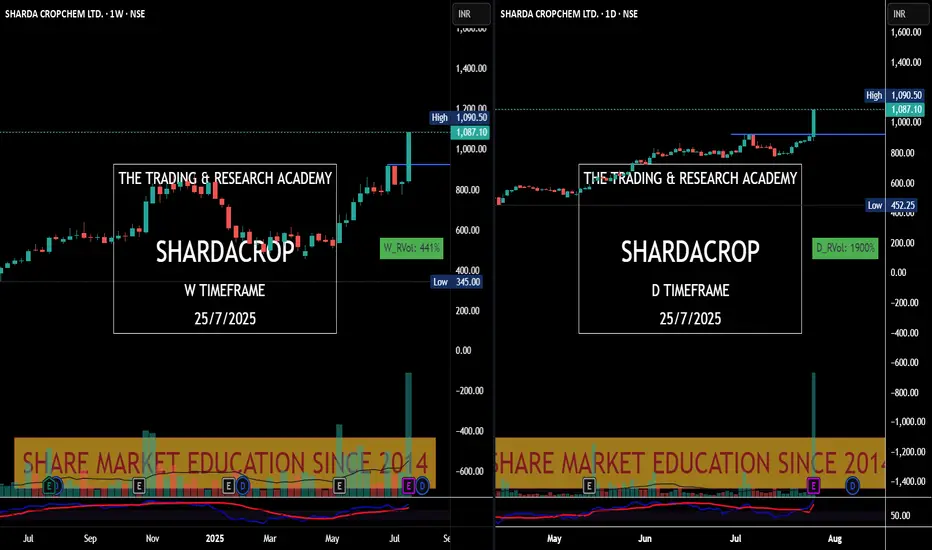
Charts Speak #Sharada Cropchem
Sharada Cropchem
Charts always lead the News! This is yet another example where price was leading & News came later.
Stock was under accumulation since June with higher qty. In fact since May 25, it was getting bought in average 2-3M qty weekly. What a planned buying..
28th May, 4 June, 18th July were nice buying alarms for us. Today it was just a final nail in the coffin.
Priceactionanalysis
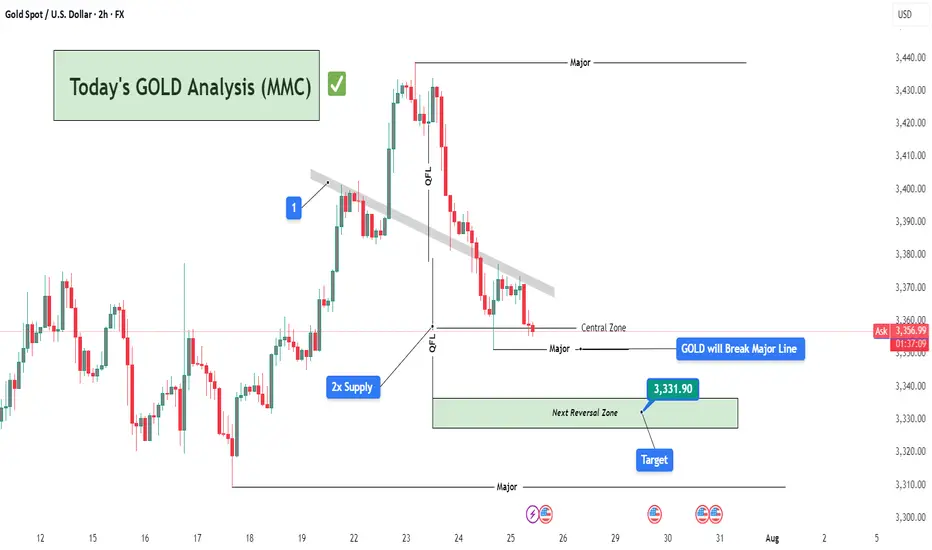
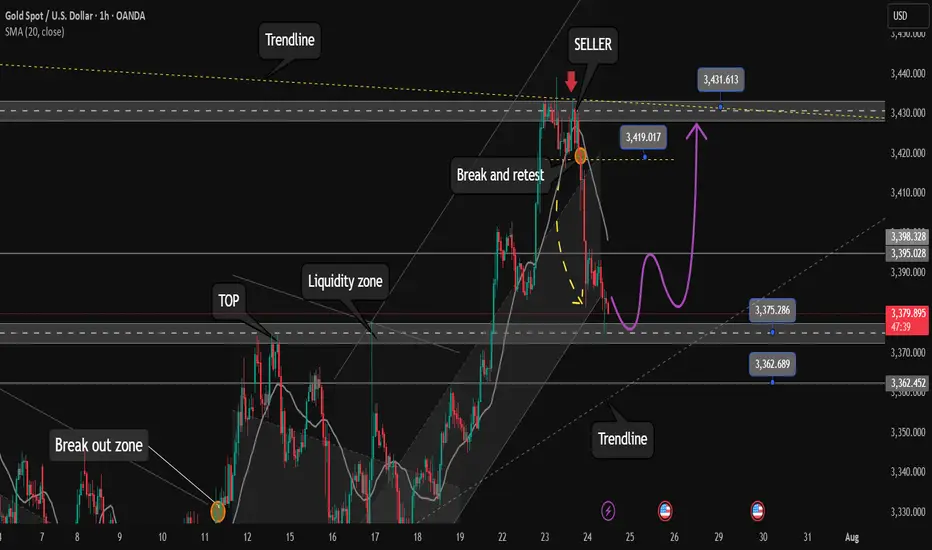
Today's GOLD Analysis (MMC) – Sell Bias Continues To Next TargetChart Overview:
This 2-hour GOLD (XAU/USD) chart showcases a clear bearish structure in line with the Mirror Market Concepts (MMC) methodology. Price action is respecting key supply zones and continues to reject significant levels, confirming the dominance of sellers in the short-term structure.
🔍 Key Technical Elements:
1️⃣ Break of Trendline (MMC QFL Entry Model)
The descending grey trendline marks consistent lower highs, showing clear bearish pressure. The breakout and rejections around this trendline zone (annotated “1”) confirm it as a strong supply area. This breakdown set the stage for a QFL (Quick Flip Liquidity) drop.
🧊 2x Supply Zone (High Confidence Rejection)
The 2x supply label highlights an area where price rapidly reversed with aggressive bearish momentum. This zone was tested and respected again, leading to further downside pressure, reinforcing the idea of institutional selling interest from that level.
📉 QFL Levels & Central Zone
Two major QFL drops are evident, where price broke previous demand structures and created new supply imbalance. The Central Zone currently acts as short-term support, but price is hovering just above it with weak bullish reaction, indicating potential for further breakdown.
🎯 Target & Reversal Zone – 3,331.90
The green zone below marks the Next Reversal Zone, with a highlighted price target at 3,331.90. This is where:
Previous liquidity was absorbed.
Demand imbalance may attract buyers again.
MMC reversal structures might be anticipated.
This zone aligns perfectly with the broader MMC concept of flipping between major zones and reversal blocks.
🧠 Trade Idea & Strategy (MMC Traders’ Minds)
Current Bias: Bearish
Entry Trigger: After rejection from trendline & 2x supply area.
Stop-Loss Suggestion: Above the trendline or recent supply wick (~3,375-3,380).
Take-Profit Zone: Primary TP at 3,331.90, with eyes on lower reversal targets if momentum persists.
Market Behavior: Controlled by sellers, liquidity sweeps seen, weak demand below Central Zone.
📌 Key Events to Watch
As marked at the bottom, major US news events are scheduled between July 30th and 31st, which could act as catalysts for price acceleration toward the reversal zone or cause sharp volatility. Plan accordingly.
🧭 Conclusion:
Gold is respecting bearish market structure under the MMC model. With clear QFL breakouts, rejection from 2x Supply, and weak bullish attempts near the Central Zone, this chart favors short setups targeting the 3,331.90 zone. MMC traders should monitor price action closely within the Reversal Zone for potential buy signals or trend continuation if sellers remain aggressive.
25.07.25 Morning ForecastPairs on Watch -
FX:USDJPY
CAPITALCOM:DE40
FX:GBPUSD
FX:AUDUSD
A short overview of the instruments I am looking at for today, multi-timeframe analysis down to what I will be looking at for an entry. Enjoy!

Gold price analysis July 25Gold Analysis – D1 Uptrend Still Maintains, But Needs New Momentum
Yesterday’s trading session recorded a D1 candle closing above the Breakout 3363 zone, indicating that buying power in the US session is still dominant. This implies that the uptrend is still being maintained, although the market may need a short-term technical correction.
In today’s Tokyo and London sessions, there is a possibility of liquidity sweeps to the support zone below before Gold recovers and increases again in the New York session.
Important to note:
The uptrend will only be broken if Gold closes below the 3345 zone on the D1 chart.
In this case, the 3320 level will be the next support zone to observe the price reaction and consider buying points.
For the bullish wave to continue expanding towards the historical peak (ATH) at 3500, the market needs stronger supporting factors, which can come from economic data or geopolitical developments.
📌 Support zone: 3345 – 3320
📌 Resistance zone: 3373 – 3418
🎯 Potential buy zone:
3345 (prioritize price reaction in this zone)
3320 (in case of breaking through 3345)
🎯 Target: 3417

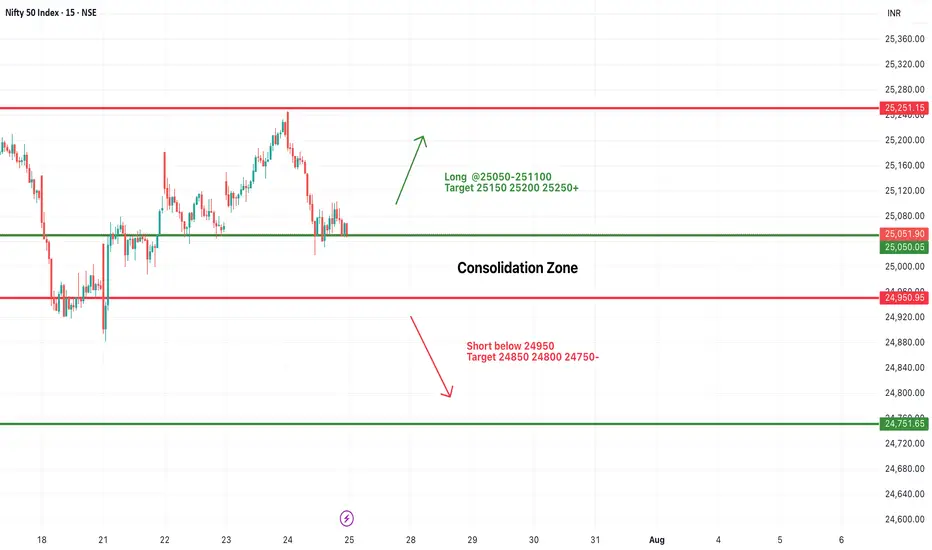
#NIFTY Intraday Support and Resistance Levels - 25/07/2025Nifty is expected to open with a slight gap-down and is currently trading within a tight consolidation zone between 24,950 and 25,050. This narrow 100-point range has acted as a critical zone over the past sessions, indicating indecision and low conviction among traders.
A sustained move above 25,050–25,100 may provide a long opportunity with potential upside targets of 25,150, 25,200, and 25,250+. Strong bullish momentum will only be confirmed if Nifty manages to close above 25,250, which may push the index further toward 25,350–25,400 in the coming days.
On the other hand, a breakdown below 24,950 will shift the bias toward bearishness. A short setup could then target 24,850, 24,800, and 24,750- levels.
Until then, expect sideways price action between 24,950 and 25,050. Traders should wait for a breakout or breakdown before entering fresh trades. Avoid aggressive entries inside this tight band.
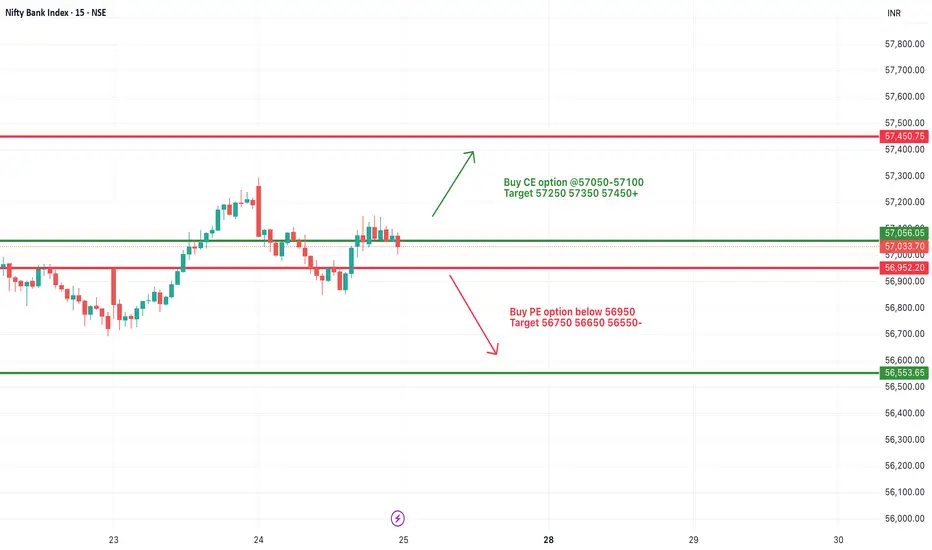
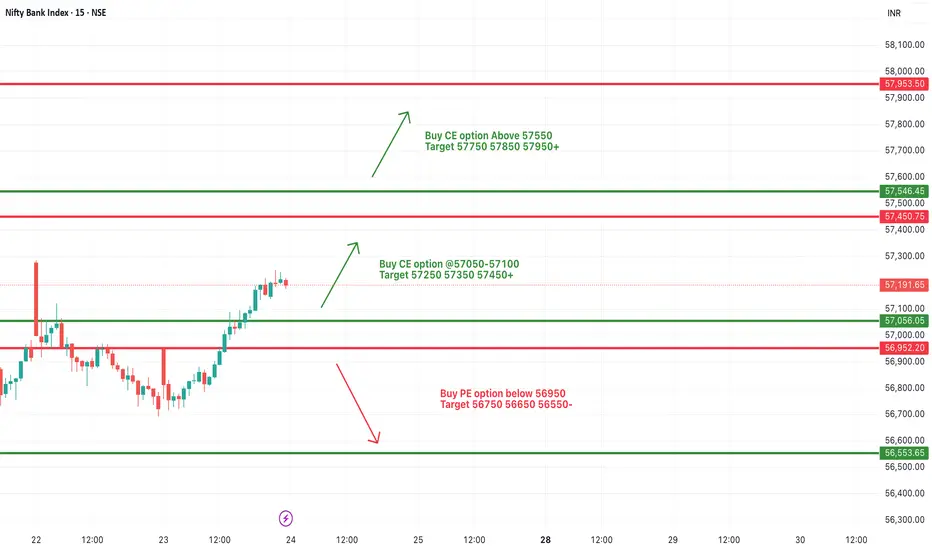
[INTRADAY] #BANKNIFTY PE & CE Levels(25/07/2025)Bank Nifty is likely to start the session with a slight gap-down, hovering just below the 57,050–57,100 resistance zone. This zone has been acting as a critical barrier over the past sessions, and until it's breached, upside momentum may remain capped.
A strong bullish move can be anticipated above 57,050, where call option buying is favored. If Bank Nifty sustains this breakout, we can expect a continuation rally toward 57,250, 57,350, and 57,450+ levels. This would mark a short-term trend reversal and signal fresh bullish interest.
On the downside, weakness may resume if the index breaks below the 56,950 mark. A sustained move below this could trigger a quick correction targeting 56,750, 56,650, and 56,550- levels, offering good opportunities for put option buyers.
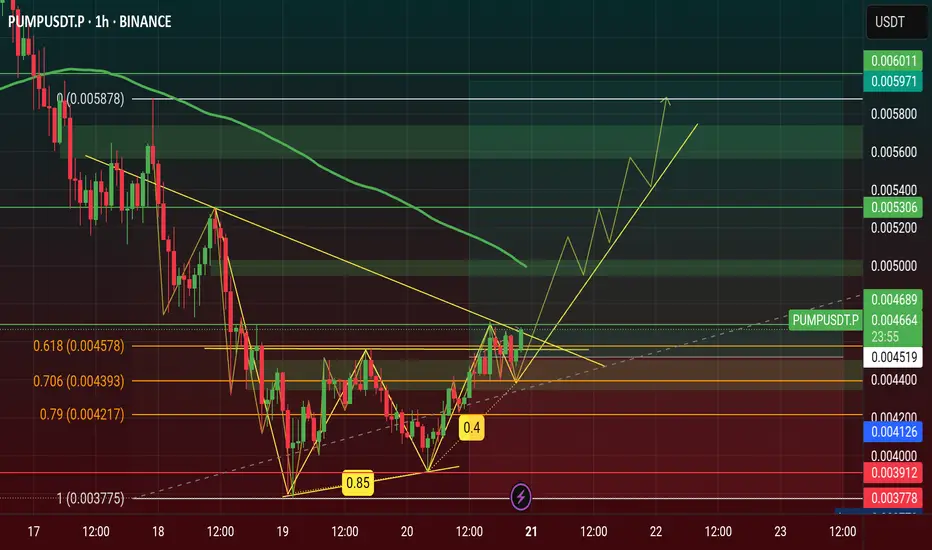
$PUMP Price Will Hit $0.006 this July 2025 see on Chart...🚀 NYSE:PUMP Price Will Hit $0.006 this July 2025, NYSE:PUMP is Showing a Double Bottom Pattern Looking on Chart now.
Double Bottom Pattern is a Reversal Pattern and It's will Manipulation Price of Pump. I'm Find a Three White Shoulders Candle in bottom price area on 4h Chart & It is a Bullish Candle. Now Price Retest and If it's Breakout it will be happened this month.
#Write2Earn #TrendingPredictions #AltcoinSeasonLoading #pump #SUBROOFFICIAL
Disclaimer: This article is for informational purposes only and does not constitute financial advice. Always conduct your own research before making any investment decisions. Digital asset prices are subject to high market risk and price volatility. The value of your investment may go down or up, and you may not get back the amount invested. You are solely responsible for your investment decisions and Binance is not available for any losses you may incur. Past performance is not a reliable predictor of future performance.
SELL ETH 25.7.2025Reversal trade order: SELL at H1~M15
Type of entry: Limit order
Reason:
- Candle creates reverse number 1 model
- The bottom hasn't touched any peak yet (meaning it hasn't reached a strong reversal zone)
Note:
- Management of money carefully at the price of bottom of M5 (3,716)
Set up entry:
- Entry sell at 3,751
- SL at 3,776
- TP1: 3,716
- TP2: 3,670
Trading Method: Price action (No indicator, only trend and candles)

Some investors take profits. Opportunity to buy gold to 3500?✏️ OANDA:XAUUSD price correction of 50 appeared yesterday. This is obvious to happen in a sustainable uptrend. Today's strategy will look for liquidity sweeps to support to BUY to ATH 3500. Gold's current border zone is limited by the upper and lower trendlines. Be careful not to trade against the trend when breaking the trend zone.
📉 Key Levels
Support: 3375 -3363
Resistance: 3418-3431-3490
Buy trigger: Buyers react at 3375
Buy zone: 3363
Target: 3430; level higher at 3490
Leave your comments on the idea. I am happy to read your views.
Gold Price Analysis July 24After a correction of about 50 prices in yesterday's session, gold is showing a necessary "breathing" in the long-term uptrend. This is a positive signal, showing that the market is accumulating before continuing its journey towards a new ATH around the 3500 area.
Currently, gold prices are fluctuating within the boundary zone limited by two upper/lower trendlines - creating a clear structure of support and resistance. Avoid trading against the trend if this boundary zone is broken.
📌 Trading plan:
Strategy: Prioritize BUY when price sweeps to support zone
Active buy zone: 3375 (reaction price)
Potential buy zone: 3363 (deep support)
Target: 3431 in the immediate future → further towards 3490
Support: 3375 – 3363
Resistance: 3418 – 3431 – 3490
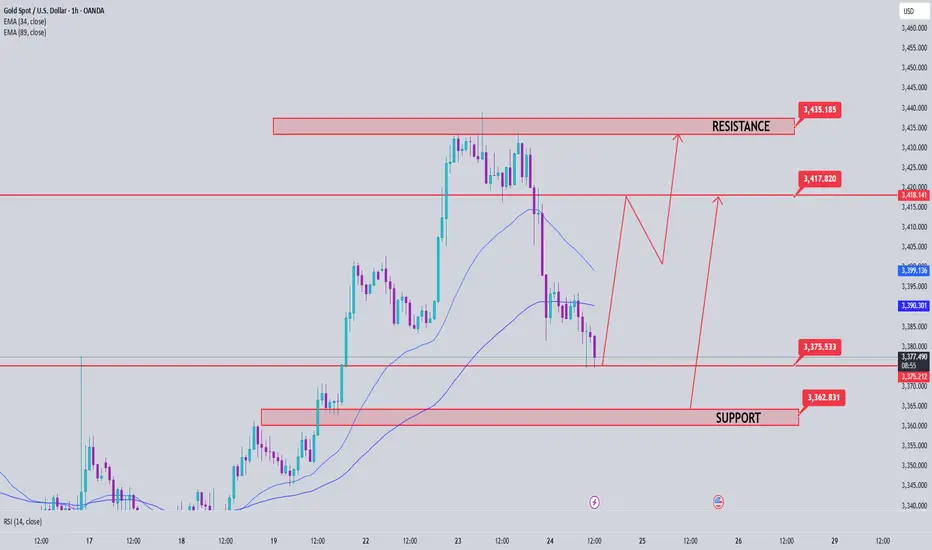
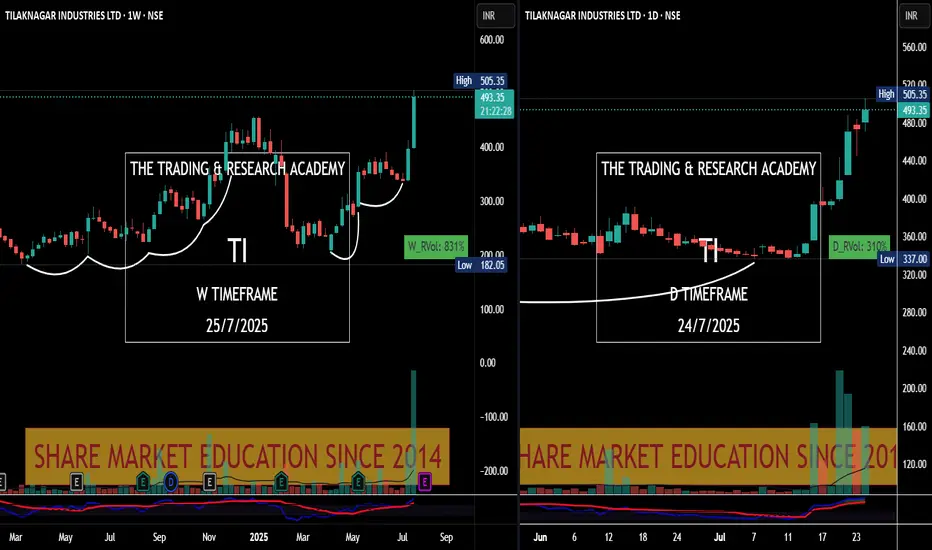
Chart Speaks- Tilak Nagar Ind
#Price leads the #News! Tilak Nagar Ind #tilaknagar see the chart v/s News.
News came yesterday, have a look at chart. Someone was accumulating it since long.
Chart Speaks
24.07.25 Morning ForecastPairs on Watch -
FX:GBPCAD
FX:GBPUSD
FX:AUDNZD
A short overview of the instruments I am looking at for today, multi-timeframe analysis down to what I will be looking at for an entry. Enjoy!

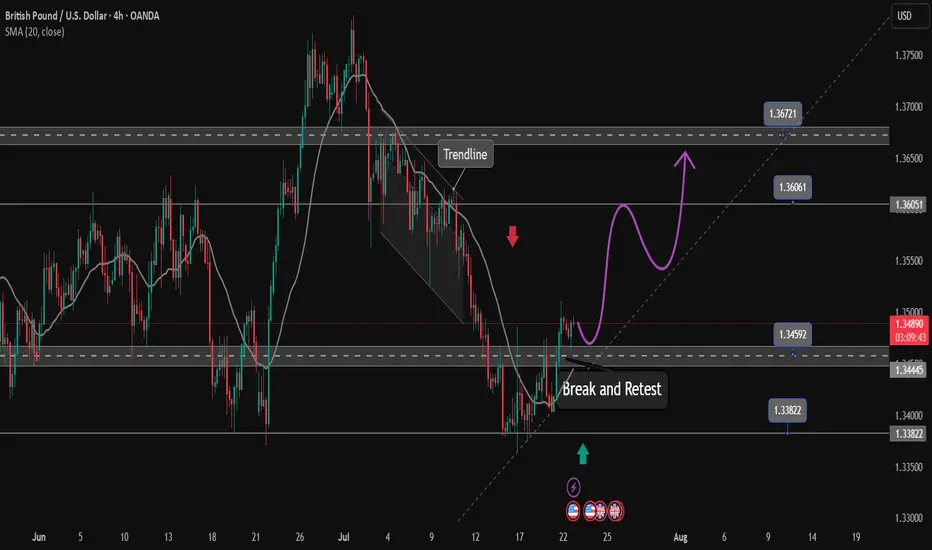
The bearish wave recovery ends and a new bullish wave begins✏️ OANDA:GBPUSD After a long downtrend that touched the important support zone of 1.138 GBPUSD has recovered to the upside. The h4 candle has just closed above the accumulation zone of 1.345 to continue the upward momentum towards the peak of 1.367. The price line also created a trendline supporting the main uptrend of the pair, and the price line can follow the uptrend to the Target.
📉 Key Levels
Support: 1.345 - 1.338
Resistance: 1.360-1.367
Buy Trigger: Rejects above 1.345
Buy zone: 1.348-1.345
Target 1.367
Leave your comments on the idea. I am happy to read your views.
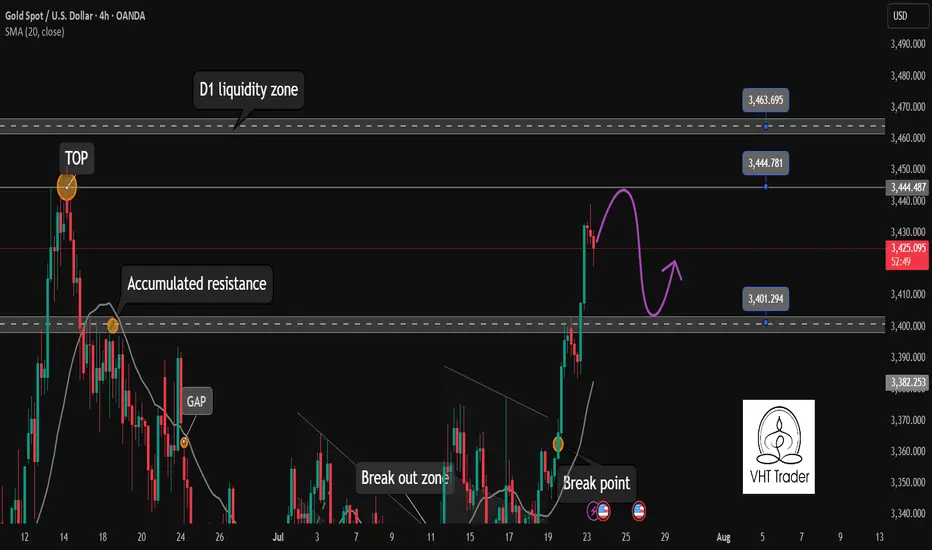
Gold will pause its rally today. Be cautious✏️ OANDA:XAUUSD continues to hit new highs this week. As the daily candle closes above the 3430 area, gold is creating a wide trading range of about 50 prices today. The uptrend may face a slight slowdown due to profit-taking psychology of some investors.
📉 Key Levels
Sell trigger: Rejection from 3445
Sell zone: 3463
Target: 3405
BUY trigger: 3402 (Price retests breakout zone and buyers react)
Leave your comments on the idea. I am happy to read your views.
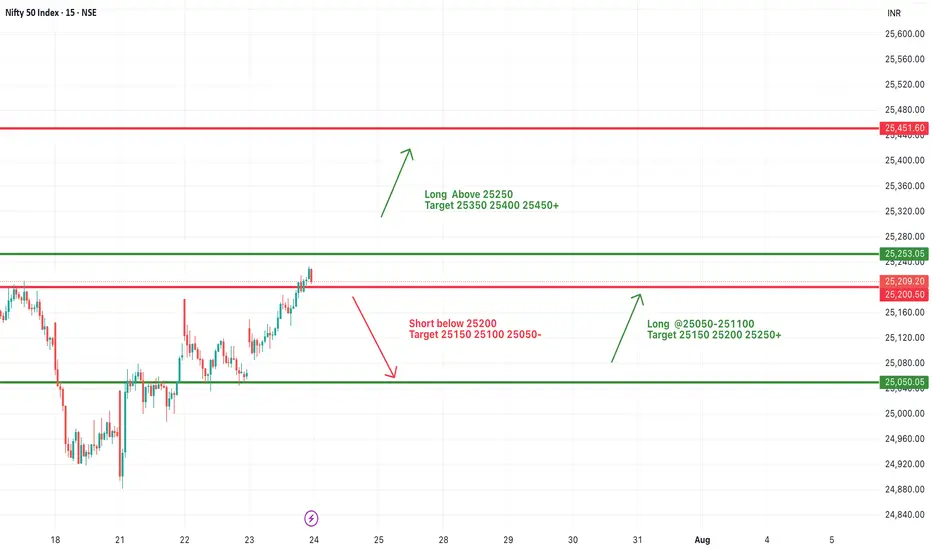
#NIFTY Intraday Support and Resistance Levels - 24/07/2025Nifty is expected to open with a bullish gap-up today, breaching the 25,250 resistance zone. This level has been acting as a consolidation ceiling in recent sessions, and today’s opening above it indicates strong buying momentum in the market.
If Nifty sustains above 25,250, we may witness a fresh upside rally towards the immediate targets of 25,350, 25,400, and 25,450+. A decisive breakout above this zone would mark the continuation of the upward trend and may attract aggressive long-side participation.
On the downside, if Nifty slips and sustains below 25,200–25,250, weakness could resume. A break below 25,200 may lead to a correction toward 25,150, 25,100, and possibly even 25,050-, which will now act as a crucial support zone.
Overall, today's session may remain bullish above 25,250 with momentum trades favored on the long side.
[INTRADAY] #BANKNIFTY PE & CE Levels(24/07/2025)Bank Nifty is likely to open with a slight gap-up, continuing its recent upward trajectory. The index has shown strength by reclaiming key resistance zones and now trades above 57,100, indicating bullish sentiment in the market. Today’s price action will be crucial near immediate supply and resistance zones.
On the upside, if Bank Nifty sustains above 57,050–57,100, a continuation move may unfold toward 57,250, 57,350, and 57,450+ levels. A decisive breakout above 57,550 will open up further upside possibilities with targets near 57,750, 57,850, and 57,950+, where the next key resistance lies.
On the downside, weakness will only emerge if the index breaks below 56,950, which could trigger a sell-off with downside targets of 56,750, 56,650, and 56,550-. This zone also marks the base of the recent rally, and breaching it could suggest exhaustion of momentum.
Overall, the trend remains positive with momentum favoring the bulls as long as the index remains above 57,000. Traders are advised to wait for confirmation near the mentioned levels before initiating trades and maintain strict risk management with trailing stop-losses.
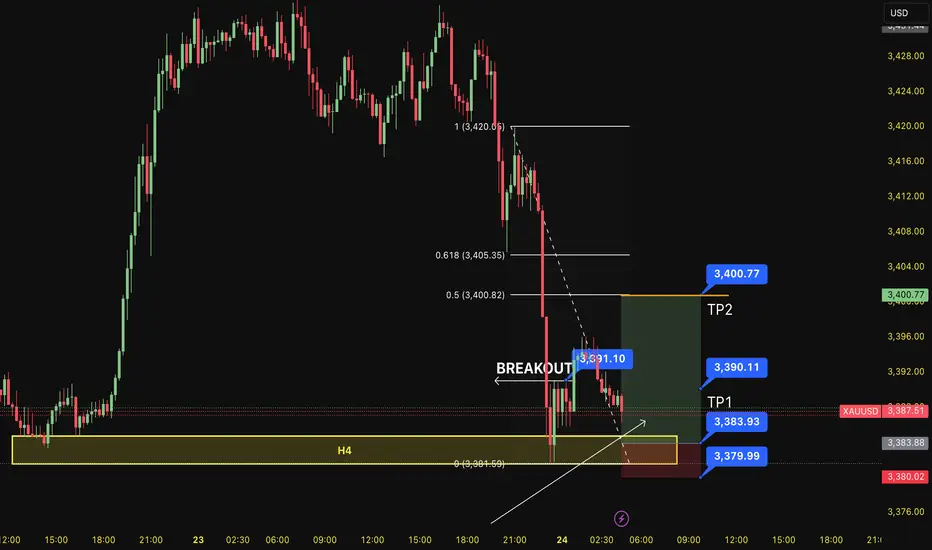
BUY XAUUSD 24.7.2025Counter-trend trade order: SELL at H4~H1~M15
Type of entry: Limit order
Reason:
- If the price breakout at 3,391 confirming the uptrend.
Note:
- Management of money carefully at the price of last top (3,390)
Set up entry:
- Entry sell at 3,383
- SL at 3,379
- TP1: 3,390
- TP2: 3,400
Trading Method: Price action (No indicator, only trend and candles)
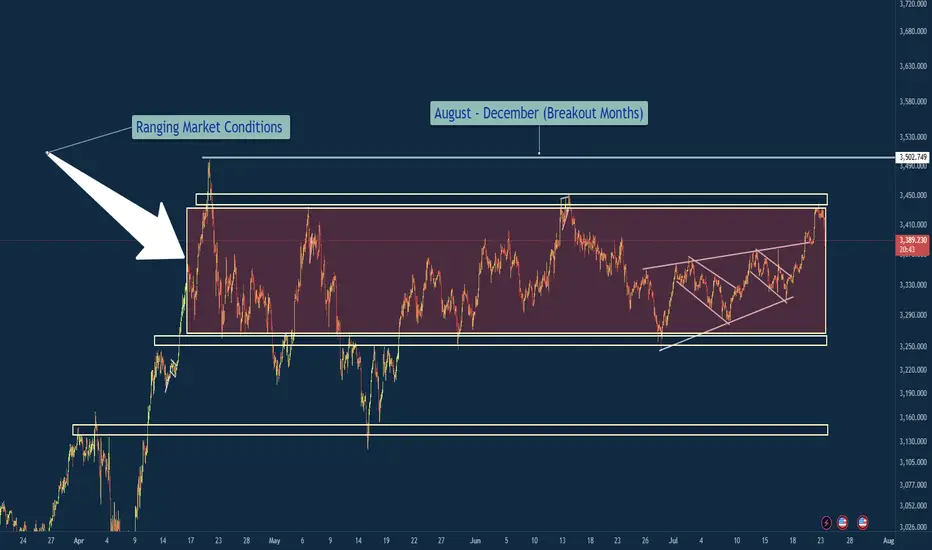
XAU/USD – Ranging Market Prepping for Breakout?Gold has been ranging for the next couple months and usually I am out of the market during the months of April Through July because historically these are not my best months trading XAU/USD. However you will see me posting a lot more in the coming months because my best months historically are August - December where the market really cranks up with some bigger moves.
So in a summarized version below you will find what it is that i am looking at with gold.
Gold (XAU/USD) has remained locked in a defined consolidation range between 3,250 (support) and 3,450–3,502 (resistance) since early April. Price has printed multiple internal falling wedge formations within this zone, indicating compression before potential expansion.
🔍 Technical Overview
Range Duration: ~3.5 months
Key Range:
Support: 3,250
Resistance: 3,450–3,502
Compression Patterns: Multiple falling wedges breaking upwards inside the range, hinting at bullish pressure.
Touch Confirmations: Both range boundaries have been tested multiple times, reinforcing validity (per Multi-Touch Confirmation).
Contextual Bias: Seasonally, August–December tends to be a high-volatility trending period for Gold.
🎯 Trade Plan
Inside Range:
Maintain neutral bias.
Execute range-to-range scalps/swing setups with clear invalidation zones.
Avoid trading mid-range.
Breakout Scenario (Bullish):
A clean close above 3,502 triggers breakout watch.
Ideal setup: Retest + 15-min flag → long continuation.
Potential upside target: ~3,700 (range height extension).
Breakdown Scenario (Bearish):
Loss of 3,250 opens door to bearish continuation.
Look for clean liquidity sweep or structure flip before committing.
Initial downside target: 3,100 zone.
🛡️ Risk Notes
Avoid third-touch entries in aggressive momentum unless followed by flag formation.
Remain disciplined with the 80/20 confluence rule — don't let perfectionism delay entries.
Always execute with pre-trade checklist and defined R:R profile.
✅ Summary
Gold is at a pivotal point. The confluence of a tight multi-month range, internal compression patterns, historical breakout timing, and validated levels builds a compelling case for an imminent expansion move. Remain patient, avoid anticipation, and react to confirmed structure and price behavior.
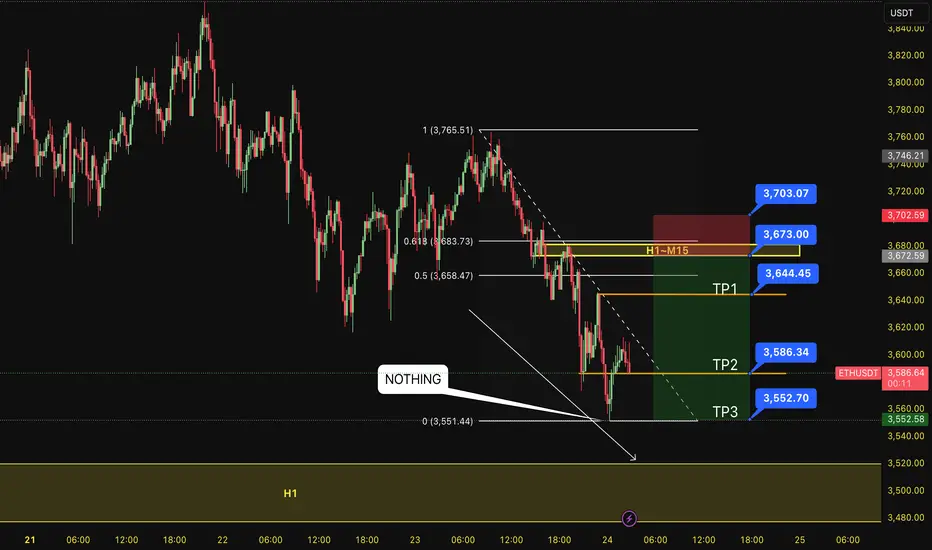
SELL ETH 24.7.2025Confluence trade order: SELL at H1~M15
Type of entry: Limit order
Reason:
- The bottom doesn't touch anything. It is expected to continue to decline into H1.
- Keylevel H1~M15~FIB 0,5-0,618
Note:
- Management of money carefully at the price of bottom (3,644)
Set up entry:
- Entry sell at 3,673
- SL at 3,703
- TP1: 3,644
- TP2: 3,586
- TP3: 3,552
Trading Method: Price action (No indicator, only trend and candles)
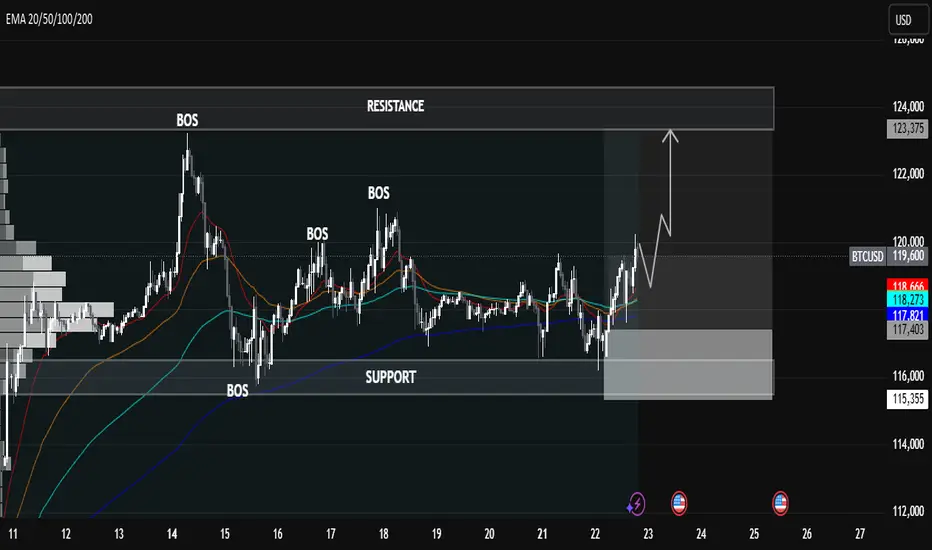
BTC/USD Technical Analysis — Educational BreakdownBTC/USD Technical Analysis — Educational Breakdown
🧠 Key Observations:
🔹 Market Structure: Break of Structure (BOS) Confirmations
The chart highlights multiple BOS points, showing clear transitions in market structure – a strong indication of bullish momentum building up after prior consolidation and retracements.
🔹 Support Zone (Demand Area): 115,355 – 117,403
This area has acted as a liquidity pool where buyers previously stepped in, forming the base for new BOS formations. A retest of this level could offer a high-probability long entry.
🔹 Resistance Zone (Supply Area): 123,375 Region
This marked level is a prior high and expected profit-taking or potential short-trigger zone. Price is likely to target this level if bullish momentum continues.
⸻
📈 EMA Analysis (20/50/100/200)
• Stacked Bullishly: EMAs are layered with the shorter-term EMAs (20/50) above the longer-term ones (100/200), suggesting trend continuation to the upside.
• Price reclaiming above all EMAs signals momentum is shifting from accumulation to expansion.
⸻
🔮 Potential Scenario:
1. Bullish Retest Play
A pullback toward the demand/support zone (116k–117.4k) can present a high-RR entry.
2. Continuation Toward Resistance
If price holds above the EMAs and structure, we could see a push toward 123,375, where profit booking may occur.
⸻
📌 Market Sentiment Bias: Bullish
• Structure: Bullish BOS
• Momentum: Above all EMAs
• Volume Profile: High acceptance near
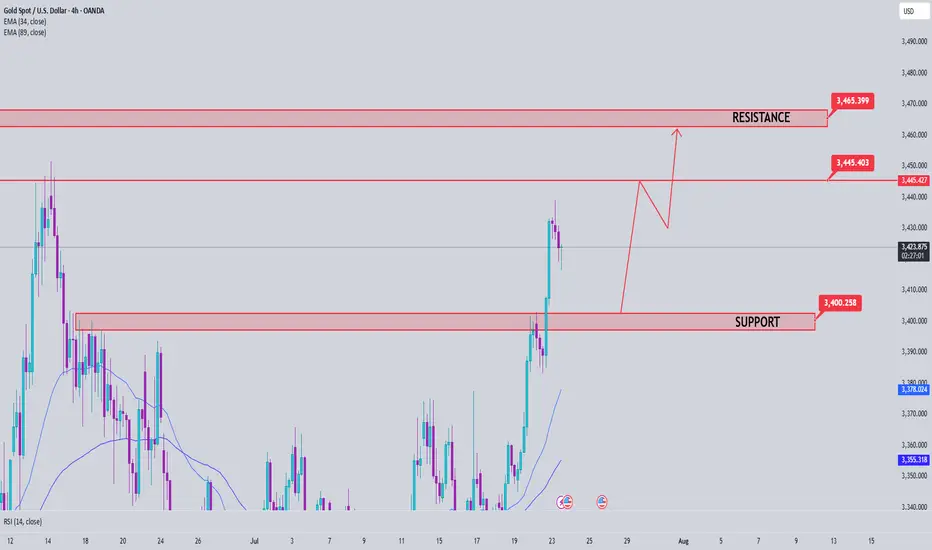
Gold Price Analysis July 23📈 Gold Trend Analysis – Strong Uptrend but Signs of Slowdown
Gold continued to set a new peak for the week when closing the day above 3430 – confirming that the uptrend is still dominant. However, buying power is starting to slow down as the market formed a fairly wide range, around 50 prices in today's session.
Profit-taking pressure at high prices can create a short-term correction, opening up two-way trading opportunities for flexible investors.
🔑 Important technical levels (Key Levels):
🔻 Resistance zone & Sell zone:
3445: Price rejection zone – can consider selling if price fails to break through.
3463: Strong Sell zone – expect increased supply here.
🎯 Sell target:
3405: Nearest support, target for short-term sell orders.
🟢 Buy Setup:
3402: Breakout zone in US session – if price breaks strongly through this support with good volume, consider buying on the next uptrend.
Continuation of downtrend. Waiting for confirmation SELL USDJPY✏️ OANDA:USDJPY is starting a corrective downtrend. Yesterday's New York session's selling pressure surpassed the buying liquidity zone around 147,000. This further confirms the possibility of the pair continuing its downward correction. Some recovery waves in today's Asia-Europe session are considered a good opportunity to SELL towards the target of 144,300 (trailline zone of the h4 frame). Pay attention to the important breakout price zone of 145,900.
📉 Key Levels
Support: 145,900-144,300
Resitance: 147,000-147,800
SELL trigger: Rejection from 147,000
SELL 147,700 (Strong resistance + SMA 20)
Target 144,400
SELL DCA: Break 145,900
Leave your comments on the idea. I am happy to read your views.

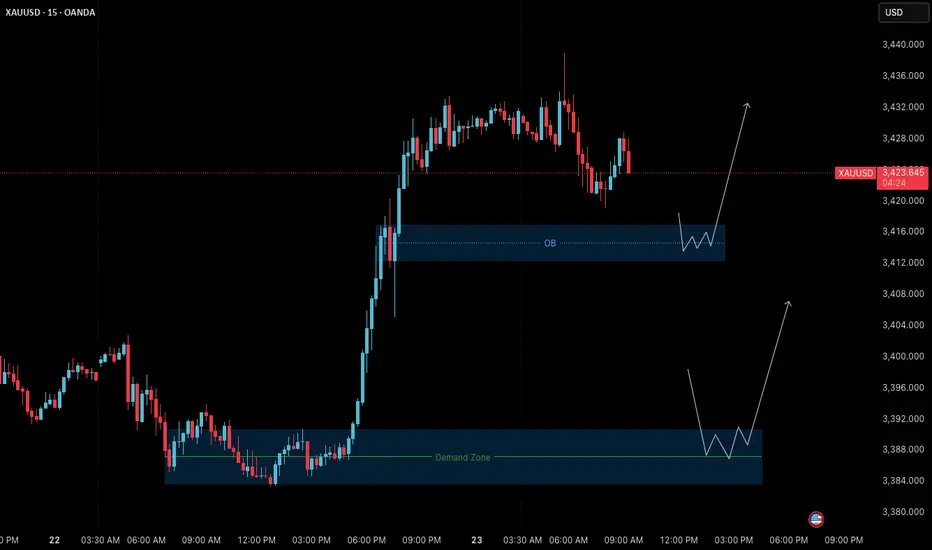
Gold Outlook (23 July): Bullish Structure Retesting Key ZonesGold (XAUUSD) – 23 July Analysis
Structure, patience, and precision define today's opportunity
The market remains in a clear uptrend , and the current M15 structure is undergoing a healthy pullback phase following yesterday’s strong bullish breakout. This retracement brings the price into key zones where continuation setups may form — if confirmed.
📊 Market Structure Overview
• Bullish Breakout: On July 22, price made a strong impulsive move upward from the demand base at 3384–3390 , confirming bullish strength and shifting short-term structure to the upside.
• Current Pullback: After printing a local high around 3439 , the market is retracing toward lower support zones. The pullback is expected and may offer long entries if price respects key areas and confirms.
🔑 Key Reversal Zones to Watch
1. Order Block (OB) Zone
Range: 3417 – 3412
– This zone is the origin of the last bullish impulse.
– Price is nearing this key zone.
– If M1 confirms with internal structure shift + BoS , we may have a valid long setup.
– Target: Previous high at 3438–3440
2. Deeper Demand Zone
Range: 3390 – 3384
– This is the base of the prior impulsive leg.
– If price breaks below the OB with momentum, this deeper zone may act as stronger support.
– Potential swing entry zone with better R:R
📌 Trade Scenarios for Today
🔹 Scenario 1: Rejection from OB Zone (Likely Intraday Setup)
– Wait for M1 to confirm via micro ChoCh + BoS inside 3417–3412 zone.
– If confirmed, plan for long entry with SL below zone.
– Target: 3438–3440
🔹 Scenario 2: Break Below OB → Retest at Deeper Demand Zone
– If OB zone fails, wait for price to drop into 3390–3384.
– Look for M1 confirmation before executing any long position.
– This setup may offer a higher-quality entry with improved R:R.
📈 Trade Plan:
– Wait for confirmation before entry (e.g., M1 structure shift + BoS)
– SL: 40 pips | TP: 120 pips
– Risk-Reward: Always 1:3 minimum
– No confirmation = No trade
🎯 Summary
• Primary Bias: Bullish — monitoring OB zone (3417–3412) for long setup
• Alternative Setup: Buy from 3390–3384 demand if deeper retracement unfolds
• Discipline: Let the market validate your plan. Never force a trade.
📘 Shared by @ChartIsMirror