IOTA is getting ready for the next bull run!Hey guys, Based on the chart a bullish channel has been identified and currently price have reached to the bottom line which can act as a supporting level. Also a bullish wedge is on the chart that can confirm our bias.
So with risk/reward of 1/3, it can be another good and low risk opportunity to buy.
Priceactionanalysis

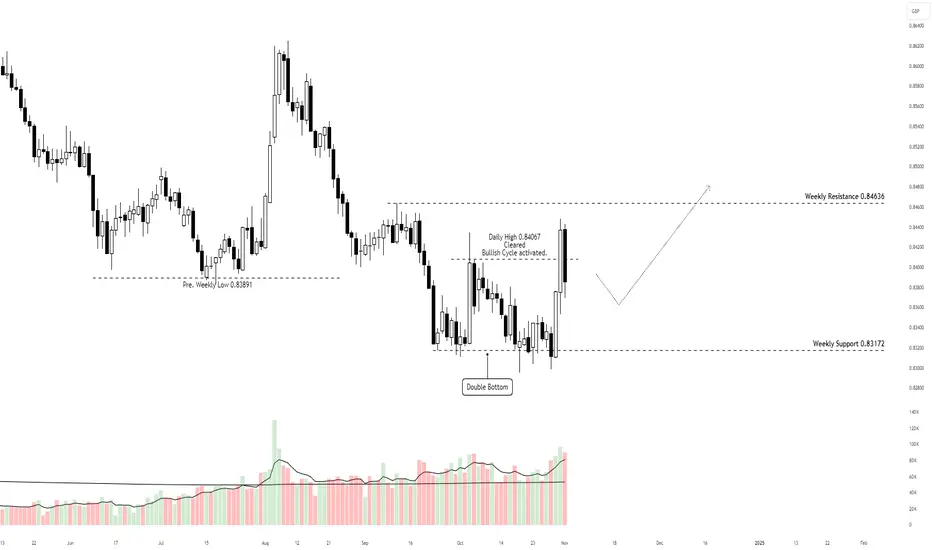
EUR/GBP: PAT + VPA 11/2/2024Good morning,
I will be closely observing the EUR/GBP currency pair on a daily basis, as I expect a bullish pullback or reversal to materialize in the forthcoming weeks.
- 1W / Weekly Analysis: The market has recently dipped to a low of 0.839, with current support established at 0.832. The price has tested the 0.832 level multiple times without breaching it, suggesting a diminished appetite for selling at this juncture. Additionally, the presence of significant wicks accompanied by relatively smaller bodies may indicate a potential selling climax.
- 1D / Daily Analysis: The daily time frame reveals the formation of a double bottom pattern at the weekly support level of 0.0832. Presently, the price is retesting the recent swing high of 0.84, which represents the latest peak. The price has demonstrated its capacity to remain above the 0.84 threshold, and I anticipate a continued upward movement towards 0.846 in the upcoming weeks.
OANDA:EURGBP
XETR:DAX
TVC:BXY
ThePipAssassin
-1% NZDJPY & +3.4% USDJPY Trade RecapsTwo short positions I took in the last trading week.
FX:NZDJPY | -1% Loss
FX:USDJPY | +3.4% Win
Top down analysis explained in the video and also my reasons for the weighted timeframe entry in combination with the management decision.

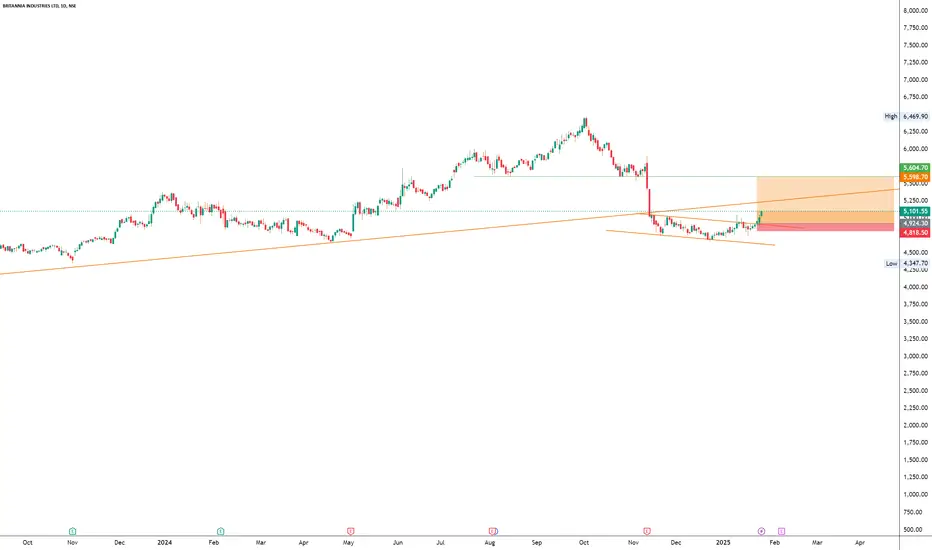
BRITANNIANSE:BRITANNIA
Note :
1. One should go long with a Stop Loss, below the Trendline or the Previous Swing Low.
2. Risk :Reward ratio should be minimum 1:2.
3. Plan your trade as per the Money Mangement and Risk Appetite.
Disclamier : You are responsible for your profits and loss.
The idea shared here is purely for Educational purpose.
Follow back, for more ideas and their notifications on your email.
Support and Like incase the idea works for you.
XRP/USDT Is This the Perfect Entry for a Big Move ?This chart of XRP/USDT, showcases a long position setup with a detailed entry, target levels, and stop-loss placement. The price action is currently positioned within a key support zone, defined between $3.05 and $3.15, where significant buying interest has been observed. Historical price movements indicate multiple bounces from this region, reinforcing its role as a strong demand area.
The outlined trading plan leverages technical analysis to project potential price levels and manage risk effectively. A stop-loss at $2.96 is strategically placed just below the buy zone to minimize downside exposure. The initial resistance level is $3.18, marking the first potential profit-taking zone. This is followed by subsequent targets at $3.22, $3.26, $3.30, and $3.35, which align with prior highs and areas of selling pressure. These targets provide incremental profit opportunities as the trade progresses.
The chart also indicates a bullish breakout from a consolidation phase, with increased buying momentum evident in recent candle formations. This momentum is expected to drive the price towards the resistance levels, provided there is no significant selling pressure. The risk-to-reward ratio improves considerably with each higher target, making the trade favorable for disciplined execution.
This setup is designed for leveraged trading. The approach amplifies potential returns while ensuring risk remains controlled through a predefined stop-loss. The $3.18 and $3.22 levels are critical for determining the strength of the bullish move, as price reactions at these points will dictate the likelihood of reaching higher targets.
This trade balances calculated risk with substantial profit potential, leveraging technical patterns and key support-resistance dynamics to optimize the long position strategy.

24.01.25 Morning ForecastPairs on Watch -
FX:EURGBP
FX:USDJPY
A short overview of the instruments I am looking at for today, multi-timeframe analysis down to what I will be looking at for an entry. Enjoy!

#NIFTY Intraday Support and Resistance Levels - 24/01/2025Today will be slightly gap up opening expected in nifty. Expected opening above 23250 level. After opening if it's sustain above this level then possible upside rally upto 23450+ in today's session. Any further downside movement expected below 23200 level.

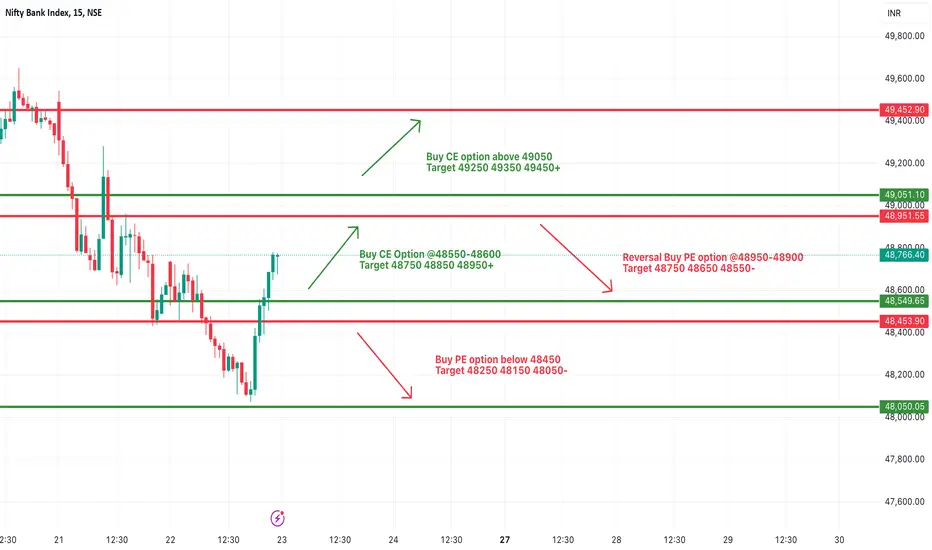
[INTRADAY] #BANKNIFTY PE & CE Levels(24/01/2025)Today will be gap up opening expected in banknifty. After opening if it's sustain above 48550 level then upside move possible upto 48950 level. In case banknifty starts trading above 49050 level then possible strong upside move of 400-500+ points in index. Any downside movement only expected below 48450 level.

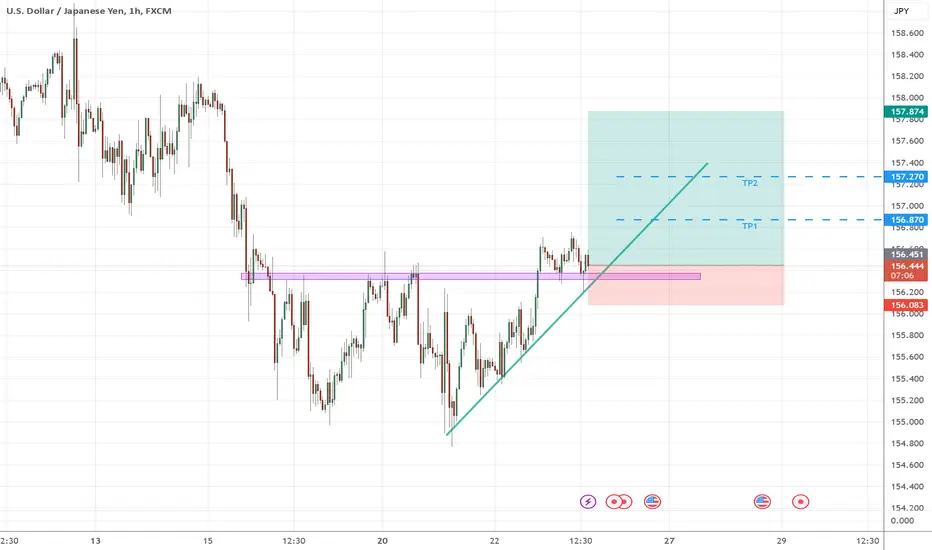
USDJPY is getting ready for next big movement!Hey guys,
Based on the chart, a major resistance area is broken and currently we are in a range market that I consider it as a simple correction for the next movement of price.
I've defined 3 levels of take profit and with consideration of risk/reward 1/3.7, it be a good trading opportunity.
Good luck!
XAU/USD: Waiting for the Perfect Reversal After Accumulation!Gold (XAU/USD) is currently in a crucial accumulation phase, where price is trapped in a narrow range (highlighted in red). With the market looking poised for a potential reversal, watch closely for a drop towards the distribution zone (green area) before a potential bounce. This setup could offer a strong entry for those looking to ride the next wave. Patience is key as we await the market’s next move!”

23.01.25 Morning ForecastPairs on Watch -
FX:GBPJPY
FX:USDJPY
A short overview of the instruments I am looking at for today, multi-timeframe analysis down to what I will be looking at for an entry. Enjoy!

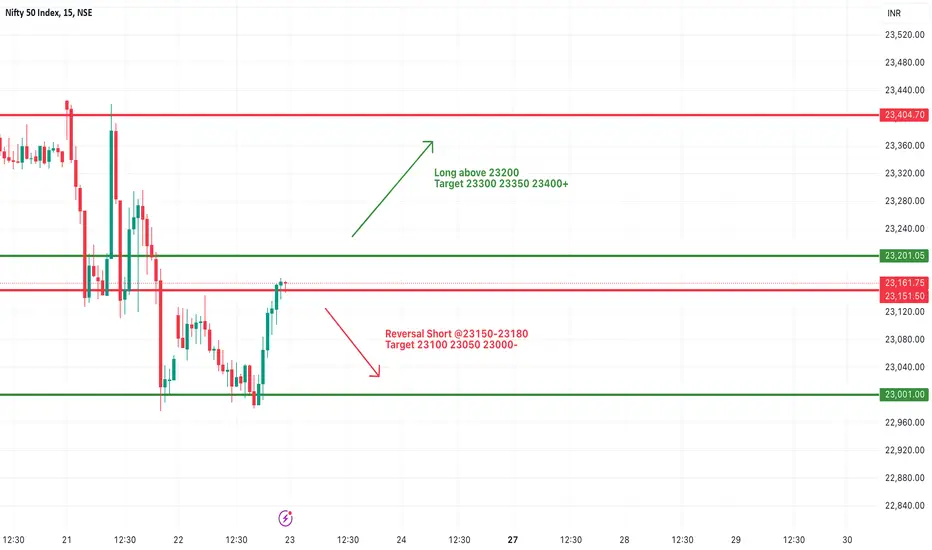
#NIFTY Intraday Support and Resistance Levels - 23/01/2025Flat or slightly gap down opening expected in nifty. After opening if nifty gives reversal from 23150 level then possible downside movement upto 23000 level in today's session. Further upside rally only expected if nifty starts trading and sustain above the 23200 level in today's session.
[INTRADAY] #BANKNIFTY PE & CE Levels(23/01/2025)Today will be gap down opening expected in banknifty. After opening if it's sustain above 48550 level then upside movement expected upto 48950 level. At this level banknifty will fail resistance and chances of reversal from this level. Strong upside rally expected if banknifty starts trading and sustain above 49050 level. Major downside only expected if banknifty gives break of 48450 level.
22.01.25 Morning ForecastPairs on Watch -
FX:GBPJPY
FX:GBPAUD
A short overview of the instruments I am looking at for today, multi-timeframe analysis down to what I will be looking at for an entry. Enjoy!

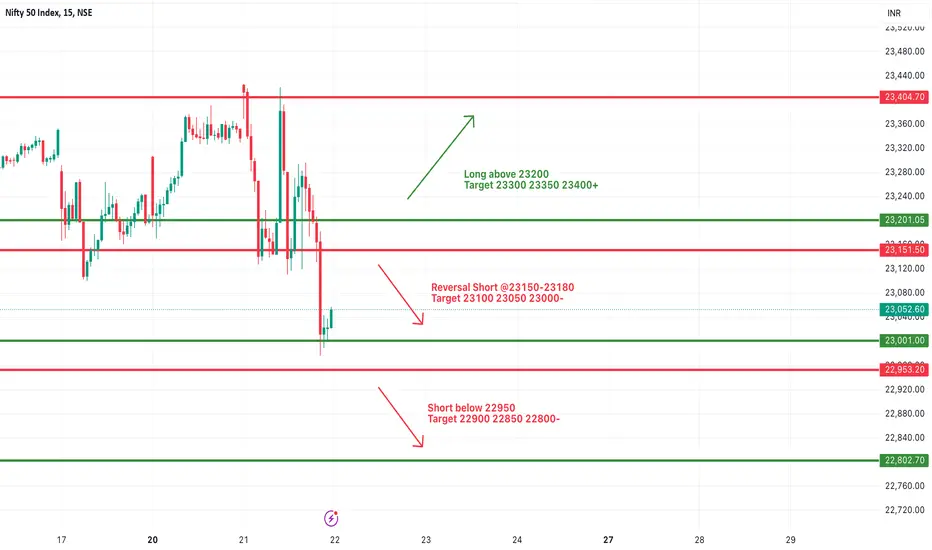
#NIFTY Intraday Support and Resistance Levels - 22/01/2025Gap up opening expected in nifty near 23150 level. After opening if it's give reversal from this level then expected downside upto 23000 and this can be extend for further 100-150+ points in case nifty starts trading below 22950 level. Any upside rally only expected if it is starts trading and sustain above 23200 level.
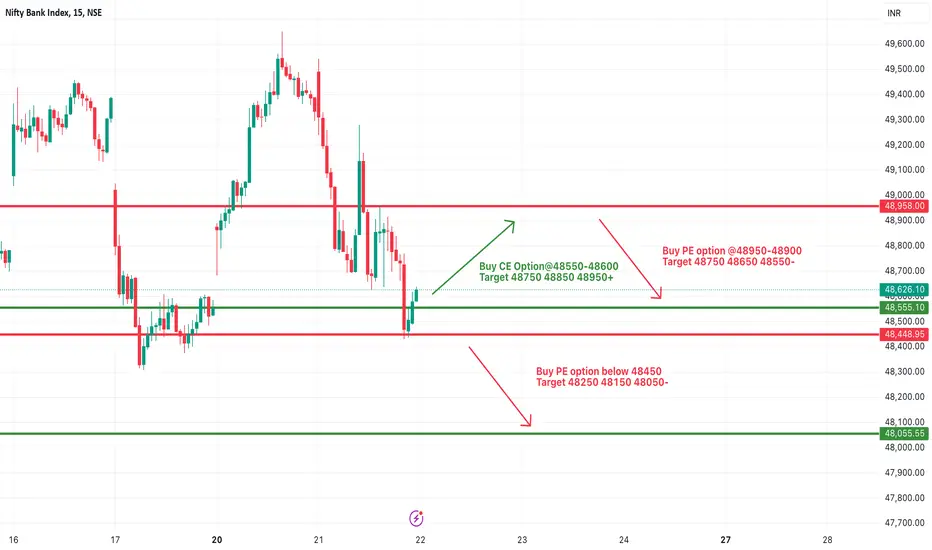
[INTRADAY] #BANKNIFTY PE & CE Levels(22/01/2025)Today will be flat opening expected in banknifty. After opening important level for index is 48500 level. If banknifty starts trading below 48450 then expected strong downside fall upto 48050 level. Any upside rally only expected if it's sustain above 48550 level. Upside 48950 level will act as a strong resistance for today's session.
AWLNSE:AWL
Note :
1. One should go long with a Stop Loss, below the Trendline or the Previous Swing Low.
2. Risk :Reward ratio should be minimum 1:2.
3. Plan your trade as per the Money Mangement and Risk Appetite.
Disclamier : You are responsible for your profits and loss.
The idea shared here is purely for Educational purpose.
Follow back, for more ideas and their notifications on your email.
Support and Like incase the idea works for you.

21.01.25 Morning ForecastPairs on Watch -
FX:GBPJPY
FX:USDJPY
FX:GBPUSD
FX:EURUSD
A short overview of the instruments I am looking at for today, multi-timeframe analysis down to what I will be looking at for an entry. Enjoy!

#NIFTY Intraday Support and Resistance Levels - 21/01/2025Gap up opening expected in nifty. Expected opening near 23350 level. After opening possible nifty will consolidated in between 23300-23400 zone. If nifty starts trading and sustain above 23400 then expected sharp upside rally upto 23600+ level. Any major downside only expected below 23300 level.

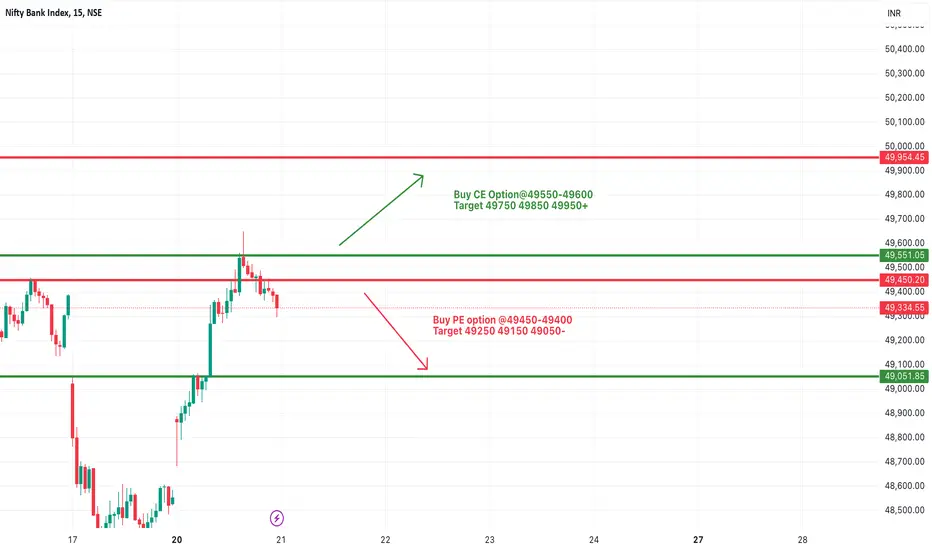
[INTRADAY] #BANKNIFTY PE & CE Levels(21/01/2025)Today will be gap up opening expected in banknifty. After opening if banknifty starts trading and sustain above the 49550 level then expected upside rally upto the 49950+ level. Upside 49950 level will act as a resistance for today's session. Any downside rally expected below 49450 level this downside can goes upto 49050 level.
Bullish on XAUEUR XAUEUR has resisted on the price around 2,605 and due to the news it will be bullish throughout the week.

SHIBAINU
The $0.000032 resistance zone is a critical supply area; we anticipate price action will react upon reaching this level and expect a bearish trend to emerge from here.
If the uptrend to the $0.000032 price level is exhausted before the well-established support at $0.0000175 is reached, we could see a decline towards lower price levels.
This is just my opinion and I would be happy to hear yours(;

Gold Price Analysis: Key Insights for Next Week Trading DecisionThe market is buzzing with mixed feelings as we approach Donald Trump's inauguration as US President-elect. Gold prices have retreated from a one-month peak, with some investors jumping on the opportunity to buy the US Dollar at perceived dips. Despite this, gold remains heavily influenced by the geopolitical and domestic political climate in the US. Recent inflation data, combined with comments from Fed Governor Waller, have put pressure on the Dollar, with traders betting on an earlier rate cut. Waller hinted at the possibility of a rate cut as soon as the March meeting, noting that inflation is nearing the Fed's 2% target. In this video, we explore how these developments could shape the gold market moving forward.
#GoldAnalysis #XAUUSD #GoldPrice #TrumpInauguration #USDIndex #InflationData #FedRateCuts #GoldTrading #ForexAnalysis #MarketTrends
Disclaimer Notice:
Trading in the foreign exchange market and other instruments carries a high risk and may not be suitable for all investors. The content provided here is for educational purposes only. Evaluate your financial situation and consult with a financial advisor before making any investment decisions. Past performance is not indicative of future results.
