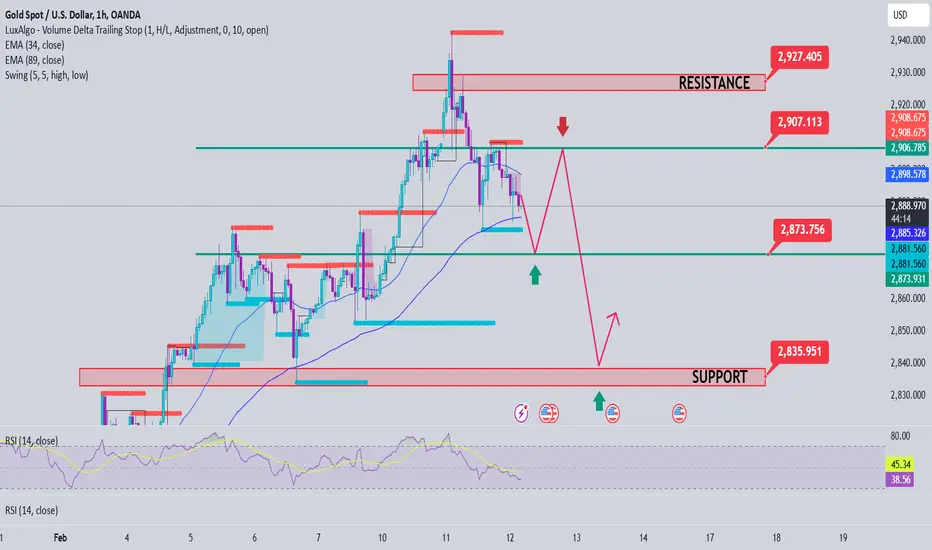
Gold Price Analysis February 12⭐️Fundamental Analysis
Asian and European traders were cautious ahead of Fed Chairman Jerome Powell's remarks to Congress. Powell said he was in no rush to adjust monetary policy and wanted to see more progress on inflation, saying the economy was in a "pretty good place." His remarks helped stabilize financial markets, helping Wall Street trim losses and the dollar recover.
Powell will continue his testimony on Wednesday, and investors are also awaiting January CPI data, which is forecast to have risen 2.9% year-on-year, with core annual growth of around 3.1%.
⭐️Technical Analysis
Gold is accepting the 2941 area as a top, and the decline has created quite clear structures. 2873-2871 is an important support zone in pushing gold prices to increase again. If gold prices cannot close the h4 candle above 2890, it will be considered a confirmation of a dow breakout and a downtrend wave that can extend to 2833. In the direction of gold going up again, 2807 and 2827 will be the zones that the SELL side will pay attention to in order to participate in the market.
Priceactionanalysis
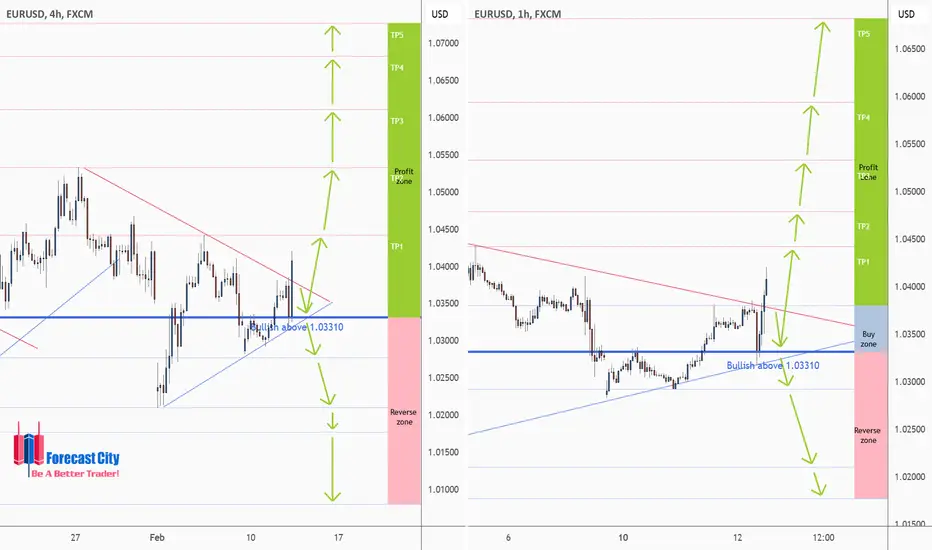
EURUSD - H4, H1 forecasts, Technical Analysis & Trading IdeasIntraday forecast
The downtrend is broken, and the price is in an impulse wave.
Forecast:
1- Correction wave toward the Buy Zone
2- Another Upward Impulse wave toward Higher TPs
SL: Below 1.0331
________________________________
❤️ If you find this helpful and want more FREE forecasts in TradingView,
. . . . . Please show your support back,
. . . . . . . . Hit the 👍 BOOST button,
. . . . . . . . . . . Drop some feedback below in the comment!
🙏 Your Support is appreciated!
Let us know how you see this opportunity and forecast.
Have a successful week,
ForecastCity Support Team
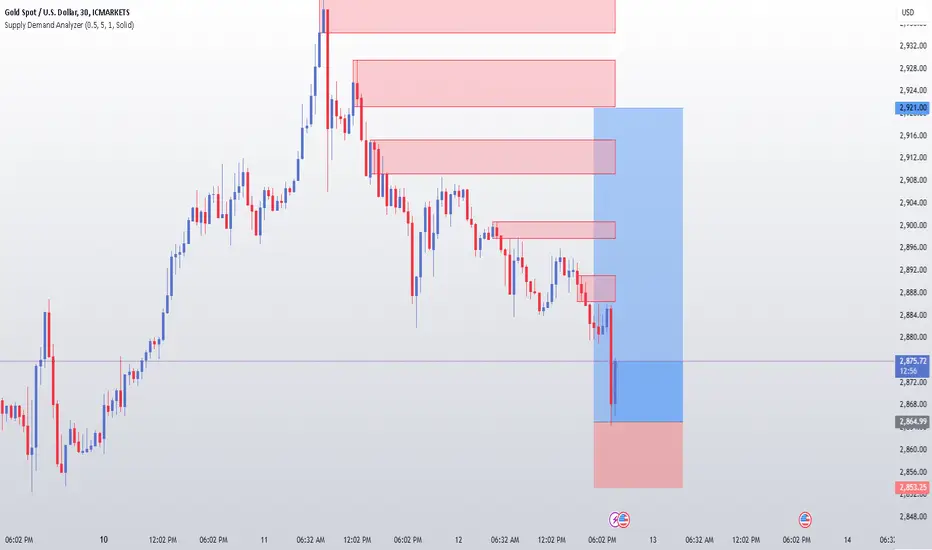
Gold Price ActionHello Traders!
Let’s break this down in a simple and friendly way. If you’ve noticed, gold is dropping even though the overall market is in an uptrend. Here’s what you can do:
1. Switch to the 2-hour timeframe and use my Supply and Demand Analyzer Indicator. You’ll see that the price has reversed from a fresh demand zone, which is a good sign.
2. Now, check the 30-minute timeframe. You’ll notice liquidity at the top, along with fresh supply zones. If the price continues to follow the overall trend, there’s a high chance it could move upward.
3. Always manage your risk! Even if your win rate is around 30-40%, solid risk management can keep you ahead in this business. Remember, protecting your capital is key to long-term success.
Wishing you all the best and happy trading! Stay disciplined and trade smart. 😊
USDJPY → Fake Breakdown Gives Bulls a Chance!FX:USDJPY The price dips into support and creates a false breakdown below the lower boundary of the current trend. Meanwhile, the dollar is gaining strength, which could provide an opportunity for the currency pair to rise.
The price has paused near a strong support zone, as the fundamental backdrop has been increasingly unstable and heavily influenced by developments in the USA. Attention has shifted away from Japan's interest rate hikes, with market participants now closely monitoring economic data from the West.
From a technical perspective, the chart presents two potential triggers—one for buying and one for selling. However, given that both the global and local trends are upward, the bias leans toward buying. If the currency pair manages to sustain above the 151.9 - 151.95 level, short- to medium-term growth toward the targets marked on the chart is likely.
Resistance levels: 151.94, 153.7, 153.97
Support levels: 150.95, 149.52
That said, if the dollar's correction persists and buyers fail to capitalize on the false breakdown of support, a drop back to 150.95 could trigger a breakdown, potentially leading to a decline toward 148.64.

12.02.25 Morning ForecastPairs on Watch -
FX:GBPAUD
FX:USDJPY
A short overview of the instruments I am looking at for today, multi-timeframe analysis down to what I will be looking at for an entry. Enjoy!

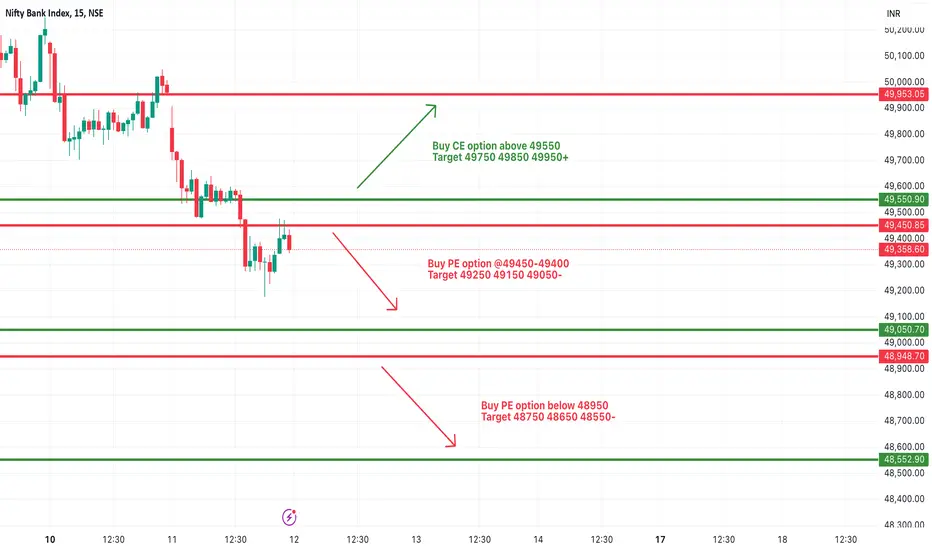
[INTRADAY] #BANKNIFTY PE & CE Levels(12/02/2025)Today will be slightly gap up opening expected in banknifty. Any bullish rally only expected if banknifty starts trading and sustain above 49550 level. Further downside expected below 49450 level this downside rally can be continue upto 49050 level in today's session. If banknifty banknifty starts trading below 48950 in today's session then possible strong downside rally of 400-500+ points upto 48550 level.
#NIFTY Intraday Support and Resistance Levels - 12/02/2025Today will be slightly gap up opening expected in nifty. After opening if it's sustain above 23050 level then expected reversal upto the 23250 level. 23250 level will act a strong resistance for today's session. Possible nifty will goes further downside from this level. Important support for today's session is 23000-23050 zone. Sharp downside expected below the 23000 level.

Still in Bullish trendI see impulse wave in XAU, it's gonna up to the tip or over the highest price I guess.

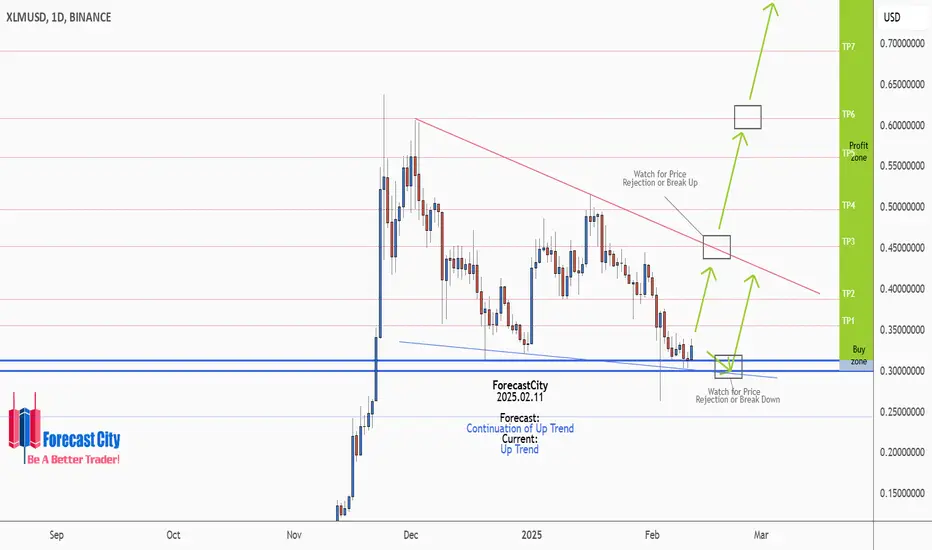
XLMUSD - Weekly forecast, Technical Analysis & Trading IdeasMidterm forecast:
0.1625 is a major support, while this level is not broken, the Midterm wave will be uptrend.
Technical analysis:
A trough is formed in daily chart at 0.3030 on 02/09/2025, so more gains to resistance(s) 0.3552, 0.3875, 0.4521 and more heights is expected.
Take Profits:
0.3552
0.3875
0.4521
0.4965
0.5602
0.6080
0.6905
0.7975
__________________________________________
❤️ If you find this helpful and want more FREE forecasts in TradingView,
. . . . . Please show your support back,
. . . . . . . . Hit the 👍 BOOST button,
. . . . . . . . . . . Drop some feedback below in the comment!
🙏 Your Support is appreciated!
Let us know how you see this opportunity and forecast.
Have a successful week,
ForecastCity Support Team
11.02.25 Morning ForecastPairs on Watch -
FX:AUDUSD
FX:EURUSD
FX:GBPAUD
A short overview of the instruments I am looking at for today, multi-timeframe analysis down to what I will be looking at for an entry. Enjoy!

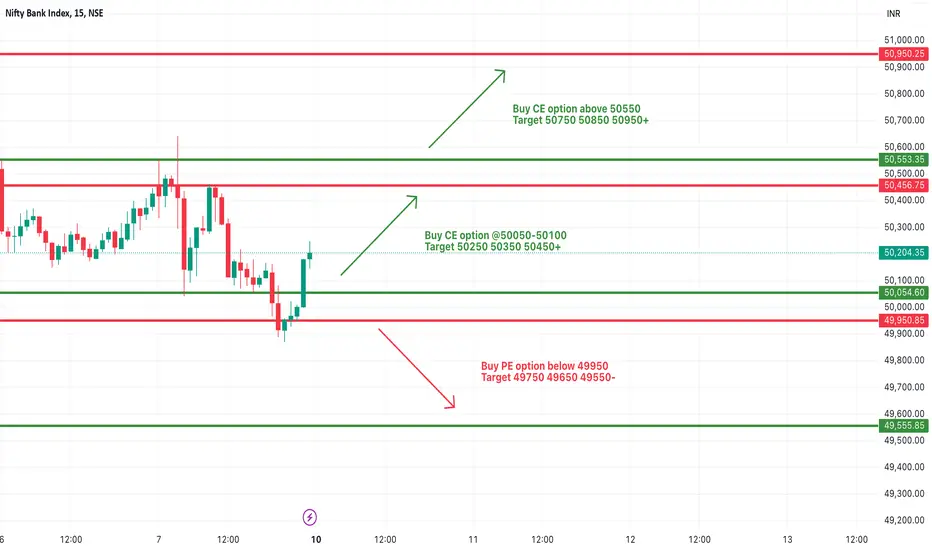
[INTRADAY] #BANKNIFTY PE & CE Levels(11/02/2025)Slightly gap up opening expected in banknifty near 50000 level. After opening if banknifty starts trading and sustain above 50050 level then expected upside rally upto the 50450 level in opening session. Downside movement possible if banknifty not sustain above level and starts trading below 49950. This downside can goes upto the 49550 level in today's session.

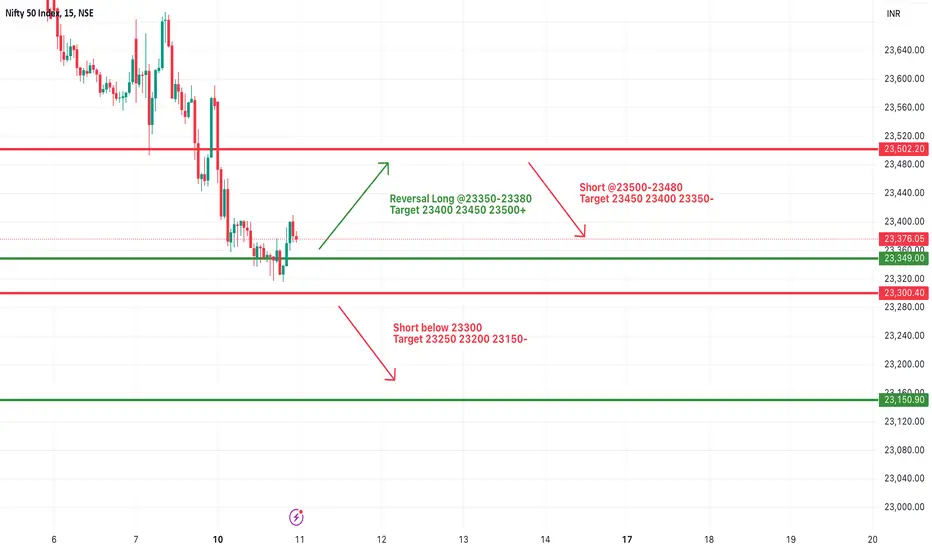
#NIFTY Intraday Support and Resistance Levels - 11/02/2025Today will be gap up opening expected in nifty near 23400 level. After opening if nifty sustain above 23350 level then possible upside rally upto 23500 level. 23500 will act as an immediate resistance for today's session. Expected downside from this level. Major downside expected in nifty below 23300 level.
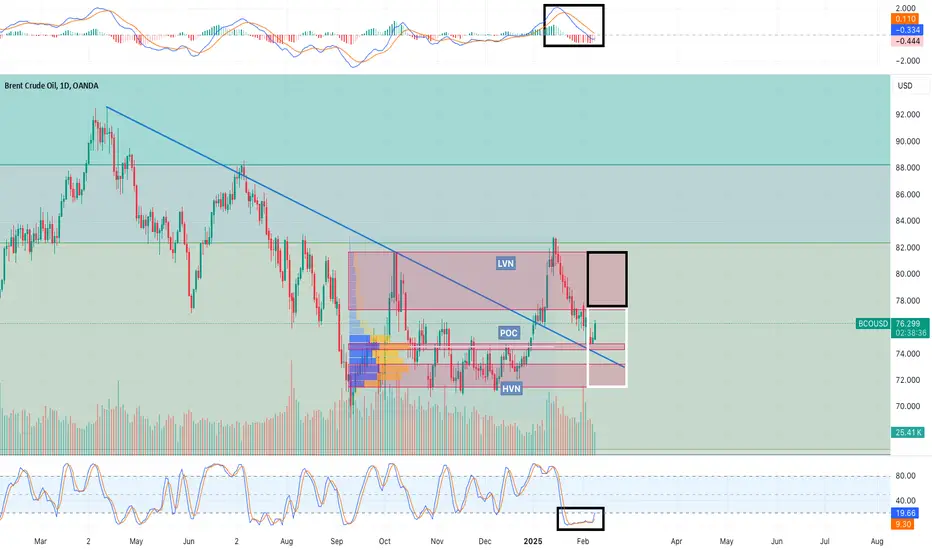
Weekly price prediction: $71.49 (Min) and $77.37 (Max).Projected Price Range
The anticipated weekly price range for Brent Crude Oil is expected to fluctuate between $71.49 (Min) and $77.37 (Max).
Contended Price Levels
$74.50 – Point of Control (POC) – potential support
$73.22 - $71.49 – High Volume Node (HVN) – potential support
$77.32 - $81.62 – Low Volume Node (LVN) – potential resistance
Technical Analysis
Fibonacci Retracement & Price Movement:
The price reached the 0.5 Fibonacci retracement level in mid-January before retracing.
This level has demonstrated consistent horizontal price movement over the past six months, indicating it as a key reference point.
Volume Profile Analysis:
High Volume Node (HVN): Found between $73.22 and $71.49, indicating strong liquidity and potential support.
Low Volume Node (LVN): Between $77.32 and $81.62, which could lead to rapid price spikes if the price enters this zone.
MACD and Stochastic RSI:
Stochastic RSI (Bottom Indicator): Has shown low bearish momentum over the last two weeks and appears poised for an upward crossover, signalling potential price growth.
MACD (Top Indicator): Remains in the negative region, with a few weeks left before a possible crossover, implying continued caution for bullish sentiment.
Additional Factors
Support & Resistance Considerations:
Point of Control (POC) and HVN are close to the current price, reinforcing these as key support zones.
The price is currently resting on a previous resistance level that has now turned into support.
The black rectangle above the price highlights the LVN region, where rapid price movements could occur.
The white rectangle represents a large support zone, which may contribute to horizontal price movement.
Geopolitical & Market Sentiment:
As always, geopolitical events could significantly impact price fluctuations, and traders should remain alert to any market-moving developments.
Conclusion
Brent Crude Oil prices for the upcoming week are likely to remain within the projected range, given the strong support levels in the current price zone. However, any breakout downward could be swift, while an upward breakout could be accelerated due to the LVN region.
LTCUSD - Weekly forecast, Technical Analysis & Trading IdeasMidterm forecast:
While the price is above the support 89.65, resumption of uptrend is expected.
We make sure when the resistance at 147.05 breaks.
If the support at 89.65 is broken, the short-term forecast -resumption of uptrend- will be invalid.
We will close our open trades, if the Midterm level 89.65 is broken.
Technical analysis:
A trough is formed in daily chart at 80.05 on 02/03/2025, so more gains to resistance(s) 117.47, 125.06, 133.99 and maximum to Major Resistance (147.05) is expected.
Take Profits:
117.47
125.06
133.99
147.05
167.24
189.79
232.63
281.63
334.75
388.93
413.50
__________________________________________
❤️ If you find this helpful and want more FREE forecasts in TradingView,
. . . . . Please show your support back,
. . . . . . . . Hit the 👍 BOOST button,
. . . . . . . . . . . Drop some feedback below in the comment!
🙏 Your Support is appreciated!
Let us know how you see this opportunity and forecast.
Have a successful week,
ForecastCity Support Team

10.02.25 Morning ForecastPairs on Watch -
FX:NZDUSD
FX:AUDUSD
FX:USDCAD
A short overview of the instruments I am looking at for today, multi-timeframe analysis down to what I will be looking at for an entry. Enjoy!

#NIFTY Intraday Support and Resistance Levels - 10/02/2025Flat opening expected in nifty. After opening if nifty starts trading and sustain above 23600 level then expected upside rally upto 23800+ level in opening session. Major downside rally expected below 23550 level. This downside can goes upto the 23400 level.

[INTRADAY] #BANKNIFTY PE & CE Levels(10/02/2025)Today will be flat or slightly gap down opening expected in banknifty. After opening if it's sustain above 50050 level then expected upside movement upto 50450 level in opening session. Major downside expected if banknifty starts trading below 49950 level. This downside can goes upto 49550 level after the breakdown. Strong upside rally possible above the 50550 level.
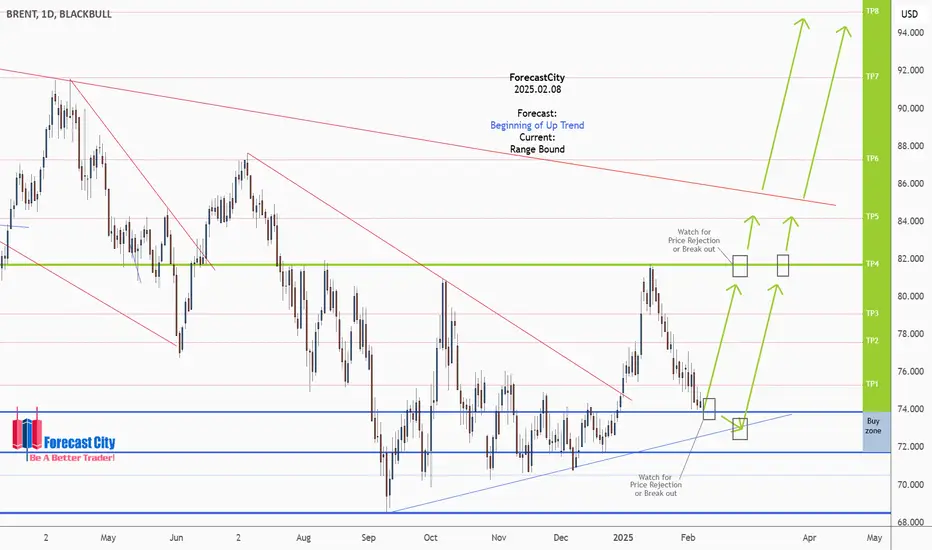
BRENT - Intraday forecast, Technical Analysis & Trading IdeasMidterm forecast:
While the price is above the support 68.485, beginning of uptrend is expected.
We make sure when the resistance at 81.651 breaks.
If the support at 68.485 is broken, the short-term forecast -beginning of uptrend- will be invalid.
Technical analysis:
A peak is formed in daily chart at 81.735 on 01/15/2025, so more losses to support(s) 73.868, 71.698, 70.505 and minimum to Major Support (68.485) is expected.
Take Profits:
75.270
77.558
79.049
81.651
84.161
87.271
91.613
95.108
98.908
103.260
106.431
115.785
123.265
131.000
__________________________________________
❤️ If you find this helpful and want more FREE forecasts in TradingView,
. . . . . Please show your support back,
. . . . . . . . Hit the 👍 BOOST button,
. . . . . . . . . . . Drop some feedback below in the comment!
🙏 Your Support is appreciated!
Let us know how you see this opportunity and forecast.
Have a successful week,
ForecastCity Support Team
Gold price analysis February 7⭐️Fundamental Analysis
Gold prices maintained a slight upward trend in today's European trading session, hovering near the all-time high reached earlier. Safe-haven demand for gold continued to increase due to concerns about US-China trade tensions and the negative impact of the Trump administration's hawkish policies.
Meanwhile, the USD struggled as the market bet that the Fed would cut interest rates twice this year. US Treasury yields plunged, further strengthening the appeal of non-yielding gold. Investors are now focused on the US NFP employment report to determine the next trend of the market.
⭐️Technical Analysis
Gold prices continue to head towards all-time highs. The 2873 area has attracted a lot of attention from sellers before the ATH. resistance zone above note around 2898. more predicted downtrend for gold specifically a sharp fall to 2811 or deeper to 2786. pay attention to noted resistance zones for best trading strategy.

BECTORFOOD : Going long for about 0.625% of the net capitalTechnical Overview :
Took a position for about 0.625% of the net capital from a level closer to the lower trendline of the descending channel. Will be targeting the high of the descending channel for a potential move of about 43% from the current average entry price.
Fundamental Overview :
Mrs. Bectors Food Specialities Limited, a prominent player in India's fast-moving consumer goods (FMCG) sector, has exhibited notable financial performance in recent quarters.
For the fiscal year ending March 31, 2024, Mrs. Bectors reported a revenue from operations of ₹16,239.45 million, marking a 19.22% increase from ₹13,621.39 million in the previous year. The net profit for the year stood at ₹1,403.61 million, reflecting a 55.78% growth compared to ₹900.74 million in FY23.
The company's operating profit margin for FY24 was 15%, with a net profit of ₹145 crore, indicating robust operational efficiency.
Mrs. Bectors Food Specialities Limited has demonstrated strong financial growth, driven by strategic initiatives in product development and market expansion. The significant increases in both revenue and net profit across its key segments underscore the company's solid market position and effective operational strategies.
📢📢📢
If my perspective changes or if I gather additional fundamental data that influences my views, I will provide updates accordingly.
Thank you for following along with this journey, and I remain committed to sharing insights and updates as my trading strategy evolves. As always, please feel free to reach out with any questions or comments.
Other posts related to this particular position and scrip, if any, will be attached underneath. Do check those out too.
Disclaimer : The analysis shared here is for informational purposes only and should not be considered as financial advice. Trading in all markets carries inherent risks, and past performance is not indicative of future results. It’s essential to conduct your own research and assess your risk tolerance before making any investment decisions. The views expressed in this analysis are solely mine. It’s important to note that I am not a SEBI registered analyst, so the analysis provided does not constitute formal investment advice under SEBI regulations.

Market in Consolidation, The Calm Before the Next Big MoveThe market is currently in a sideways consolidation phase, showing a lack of significant movement across altcoins. This is a natural occurrence following an impulsive move, where price action stabilizes before the next major breakout. Such phases often lead to a period of uncertainty as traders wait for a clear directional move.
After a strong price movement, it is common for the market to go into sideways consolidation before deciding its next direction. Right now, almost every altcoin is forming a symmetrical triangle pattern, which suggests that buying and selling pressures are balancing out. This pattern typically acts as a precursor to a major breakout, either upward or downward, depending on market sentiment and external factors.
During this phase, it is crucial to exercise patience and avoid making impulsive trades. The best strategy is to wait for confirmation of a breakout before entering the market. A decisive break above or below the current range will provide clarity on the next significant move. Traders should closely monitor key support and resistance levels to position themselves effectively.
Historically, prolonged periods of consolidation lead to strong moves in either direction. The longer the market remains in this phase, the more powerful the eventual breakout is likely to be. Being prepared and having a well-defined trading plan will be essential in capitalizing on the next market movement.

3MINDIA : Going long for about 0.625% of the net capitalTechnical Overview :
Took a position for about 0.625% of the net capital from the lower trendline of the parallel channel targeting the highs for a potential move of about 39%.
Fundamental Overview :
3M India Limited, a subsidiary of the U.S.-based 3M Company, has demonstrated a mixed financial performance over recent quarters, influenced by various market dynamics.
For the fiscal year ending March 31, 2024, 3M India reported a 29% increase in net profit, totaling ₹5.83 billion, compared to ₹4.51 billion in the previous year. Revenue rose by 5.8% to ₹41.89 billion from ₹39.59 billion. The profit margin improved to 14% from 11% in FY23, driven by higher revenue. Earnings per share also increased to ₹518 from ₹400 in the prior year.
Segment-wise Performance:
Healthcare: This segment has shown consistent growth, with a notable 19% increase in revenue during Q2 FY25.
Safety and Industrial: Experienced growth of approximately 8-9% in Q2 FY25 but faced a 1.4% decline in Q3 FY25.
Transportation and Electronics: While there was a 10% revenue increase in Q3 FY25, this segment saw a slight decline of 1.4% in Q2 FY25 and a 4% decrease in Q1 FY25.
Profitability and Margins:
The company's profitability has been impacted by rising raw material and freight costs, leading to margin contractions in certain quarters. For instance, in Q3 FY25, EBITDA margins contracted by 12% year-over-year due to increased expenses.
Strategic Actions:
To mitigate inflationary pressures, 3M India has implemented price increases across its product range. This strategy contributed to revenue growth in several segments, despite the challenges posed by higher input costs.
Conclusion:
3M India's financial performance reflects resilience amid economic challenges, with strategic pricing actions and segmental growth contributing to overall stability. However, rising costs have posed challenges to profitability, indicating the need for ongoing cost management and strategic initiatives to sustain growth.
📢📢📢
If my perspective changes or if I gather additional fundamental data that influences my views, I will provide updates accordingly.
Thank you for following along with this journey, and I remain committed to sharing insights and updates as my trading strategy evolves. As always, please feel free to reach out with any questions or comments.
Other posts related to this particular position and scrip, if any, will be attached underneath. Do check those out too.
Disclaimer : The analysis shared here is for informational purposes only and should not be considered as financial advice. Trading in all markets carries inherent risks, and past performance is not indicative of future results. It’s essential to conduct your own research and assess your risk tolerance before making any investment decisions. The views expressed in this analysis are solely mine. It’s important to note that I am not a SEBI registered analyst, so the analysis provided does not constitute formal investment advice under SEBI regulations.

Bitcoin Dominance Pumping , Is the Altcoin Market in Trouble ?Bitcoin dominance has broken a significant resistance level, signaling a shift in market dynamics. The previous double top formation has completely failed, and dominance is now sustaining above the prior highs. This development has bearish implications for altcoins, as Bitcoin's growing market share typically leads to capital outflows from the altcoin sector.
Key Points on the Chart
Double Top Failure & Breakout Confirmation
The market was previously forming a double top pattern, a classic reversal setup that often signals a potential decline.
However, BTC dominance not only broke the double top resistance but has held above it for multiple days, confirming bullish continuation.
A failed double top often results in a strong move upward, as short-sellers covering their positions add to the momentum.
Ascending Channel Structure
The chart shows BTC dominance moving within a rising wedge/ascending channel formation.
The breakout above the mid-channel resistance suggests an acceleration in trend strength, increasing the likelihood of BTC dominance rising further. As long as dominance stays within this structure, Bitcoin will likely outperform the altcoin market.
Key Support & Resistance Levels
56.44% level was a major resistance in the past and is now a confirmed support zone.
61.91% (current level) marks the breakout region, now acting as new support.
If dominance continues its uptrend, the next potential resistance area could be 66%–68%, marking the upper boundary of the trend.
Impact on Altcoins
Altcoin Weakness Likely to Continue
Historically, when BTC dominance increases, altcoins tend to bleed as capital rotates toward Bitcoin. Many altcoins may struggle to gain momentum unless BTC dominance reverses from this region.
Conditions for Altcoin Recovery
For altcoins to regain strength, BTC dominance must decline from this breakout zone.
A rejection from the upper trendline (~64%–66%) could create a temporary relief rally in altcoins.
Altcoin Seasonal Trends
Typically, altcoins start recovering once BTC dominance peaks and shows weakness.
Until then, Bitcoin remains the safer bet, while altcoins carry higher risk.
Trading Considerations & Strategy
For BTC holders: The breakout suggests strong dominance continuation, meaning Bitcoin may remain the best-performing asset in the short term.
For altcoin traders: Monitor Bitcoin dominance closely a drop back below 60% would be the first sign of relief for altcoins.
For market timing: If BTC dominance approaches 64%–66%, a potential rejection could provide entry points for altcoins.
Bitcoin dominance has broken a crucial structure, signaling altcoin weakness and Bitcoin strength. Until BTC dominance reverses or consolidates, altcoins may struggle to gain momentum. Watch the 64%–66% zone for signs of exhaustion if BTC dominance starts rejecting from there, it could mark the beginning of an altcoin resurgence.
