23.07.25 Morning ForecastPairs on Watch -
FX:GBPUSD
CAPITALCOM:DE40
FX:NZDUSD
A short overview of the instruments I am looking at for today, multi-timeframe analysis down to what I will be looking at for an entry. Enjoy!
Priceactionanalysis

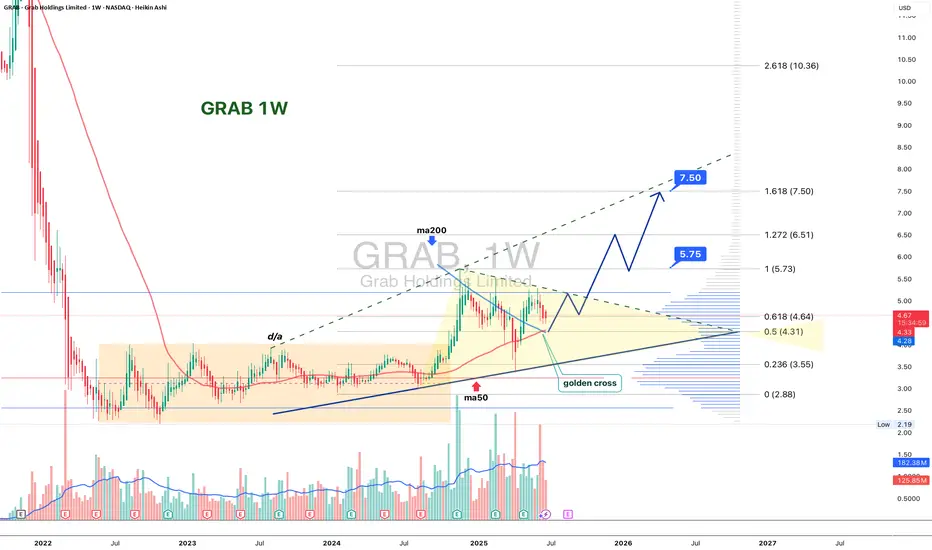
GRAB 1W: Two Years of Silence — One Loud BreakoutGRAB 1W: When stocks go quiet for two years just to slap bears across both cheeks
The weekly chart of GRAB shows a textbook long-term accumulation. After spending nearly two years in a range between $2.88 and $4.64, the price is finally compressing into a symmetrical triangle. We’ve already seen a breakout of the descending trendline, a bullish retest, and the golden cross between MA50 and MA200. Volume is rising, and the visible profile shows clear demand with little resistance overhead.
The $4.31–$4.64 zone is key. Holding this level opens the path to $5.73 (1.0 Fibo), $6.51 (1.272), and $7.50 (1.618). The structure is clean, momentum is building, and this accumulation doesn’t smell like retail — it smells institutional.
Fundamentally, GRAB is a leading Southeast Asian tech platform combining ride-hailing, delivery, fintech, and financial services. Yes, it’s still unprofitable (–$485M net loss in 2024), but revenue is growing fast, recently crossing $2.3B. Adjusted EBITDA has been improving steadily, and the company holds $5.5B in cash equivalents with minimal debt — giving it excellent liquidity and expansion flexibility.
Valued at ~$18B, GRAB operates in the world’s fastest-growing digital market, with increasing institutional exposure from players like SoftBank and BlackRock. The 2-year base hints at smart money preparing for the next big move.
Tactical plan:
— Entry: by market
— Targets: $5.73 → $6.51 → $7.50
— Stop: below $4.00 or trendline
If a stock sleeps for 2 years and forms a golden cross — it’s not snoring, it’s preparing for liftoff. The only thing left? Don’t blink when it moves.
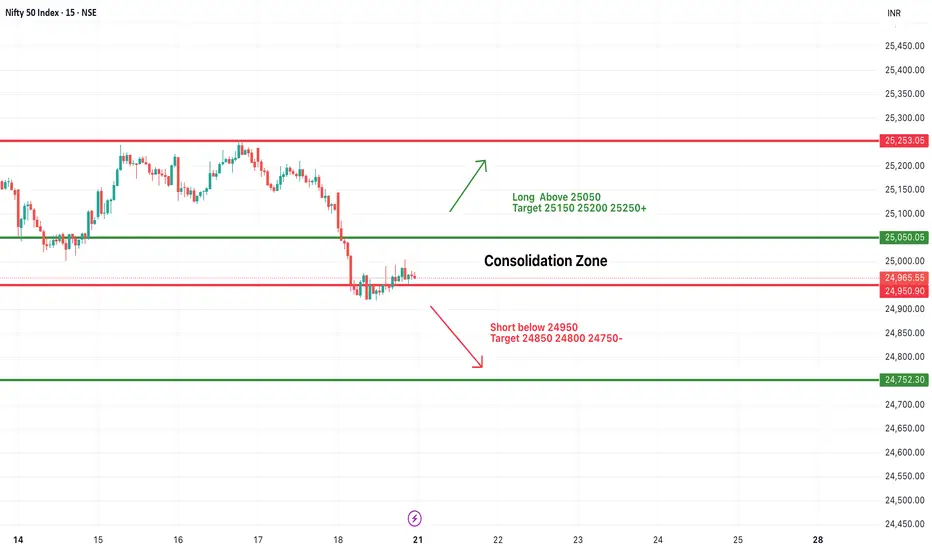
#NIFTY Intraday Support and Resistance Levels - 23/07/2025Nifty is expected to open with a gap-up today, continuing its sideways movement within a tight range. There are no significant changes in key levels from the previous session, indicating a consolidative phase in the market. Price action near these levels will be crucial for intraday direction.
On the upside, a bullish continuation can be expected if Nifty sustains above 25,050–25,100. This zone has been acting as a breakout point, and a sustained move above can lead to an intraday rally toward 25,150, 25,200, and 25,250+. Further strength will be confirmed if Nifty crosses 25,250, opening the possibility to test 25,350, 25,400, and even 25,450+ levels.
On the downside, if Nifty breaks below 24,950, it may trigger a short setup with potential downside targets of 24,850, 24,800, and 24,750-. This breakdown would indicate weakness, especially if it comes with volume.

[INTRADAY] #BANKNIFTY PE & CE Levels(23/07/2025)Bank Nifty is likely to open with a gap-up today, continuing its recent volatility and range-bound behavior. There are no major changes from yesterday’s levels, and the index remains in a crucial zone near short-term resistance and support bands. A breakout or breakdown from this zone could decide the next directional move.
Upside continuation may resume if Bank Nifty breaks above 57,050, which can trigger a momentum rally toward 57,250, 57,350, and possibly 57,450+. Traders can consider long positions in this case once confirmation and volume support the breakout.
On the downside, if the index trades and sustains below 56,950, further weakness may be seen. A bearish move below 56,950 can lead to a drop toward 56,750, 56,650, and 56,550-. This level becomes important support, and a breach could invite selling pressure.
Additionally, if Bank Nifty takes support near the 56,550–56,600 zone again, reversal buying can be considered. A bounce from this area could offer targets of 56,750, 56,850, and 56,950+.

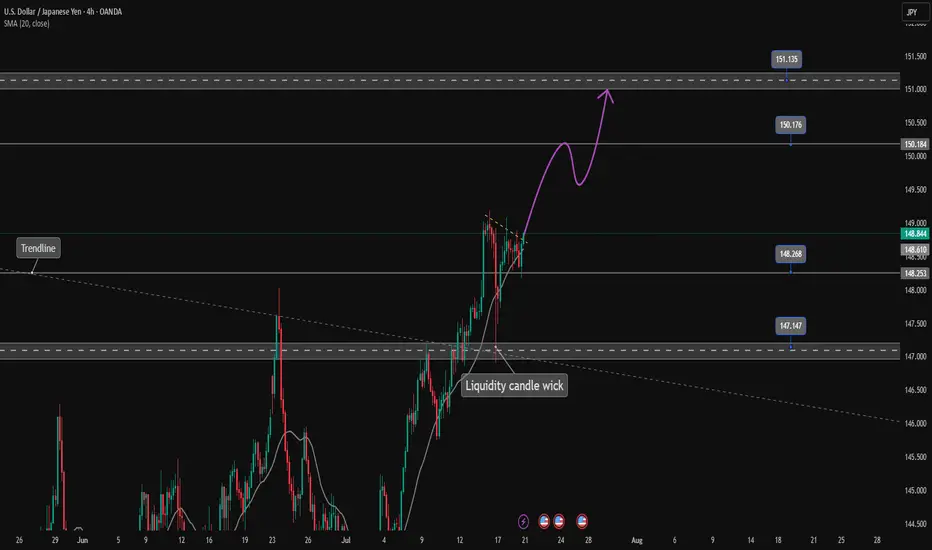
USDJPY is continuing its uptrend, let's BUY✏️ OANDA:USDJPY broke the price channel and continued its uptrend at 151,000. The previous h4 candle wick had a liquidity sweep to 147,000, showing that the buyers are dominating the market. The USDJPY trading strategy will mainly BUY to the old peak around 151,000. When the price breaks 147,000, a corrective downtrend will begin to form.
📉 Key Levels
Support: 148.200 - 147.200
Resistance: 150.100 - 151.100
Buy trigger: Breakout above 148,800
BUY 147,200 (buyer liquidity zone)
Target: 145,000
Leave your comments on the idea. I am happy to read your views.
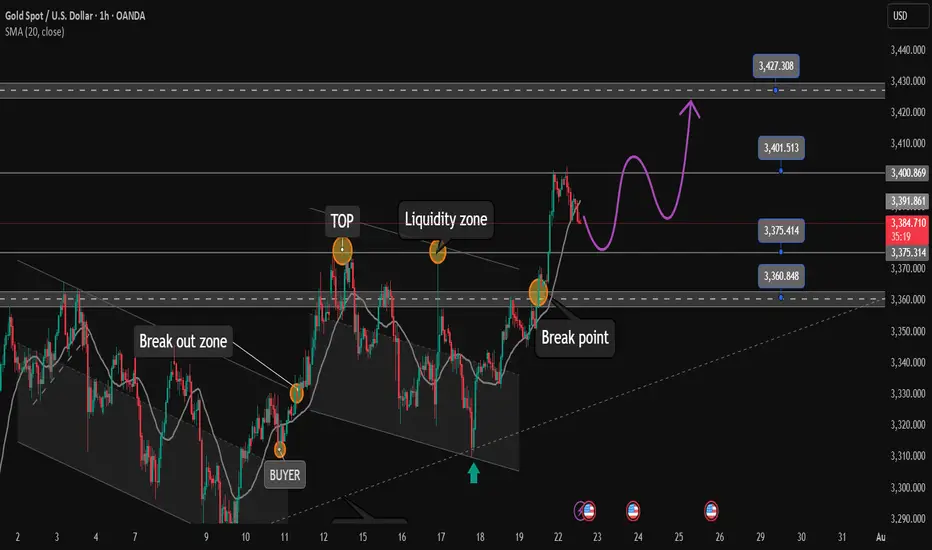
After reaching FULL TP. Relax and wait for strong support zone✏️Continuing yesterday's bullish wave structure, Gold has reached the Target level of 3400. In the European session, there is a possibility of a correction to some important support zones. And the US session will continue to aim for a level higher than 3400. Today's strategy is still quite similar to yesterday's strategy when waiting for the areas where buyers confirm to enter the market to FOMO according to the main trend.
📉 Key Levels
Support: 3375 - 3363
Resistance: 3400-3427
Buy Trigger: Rejects the support zone 3375 and reacts to the upside
Buy Trigger: Rebound from 3363
BUY DCA: Break and trading above 3400
Target 3427
Leave your comments on the idea. I am happy to read your views.
Price channel break. Will the downtrend take place?✏️USDCAD broke the price channel and started forming a bearish wave. The resistance zone of 1.370 played an important role in starting the bearish wave. 1.365 is the immediate support zone that the pair faces. If it wants to extend the decline, it needs to close the h1 candle below this price zone. The convergence between the trendline and the resistance of the Asian session will be a reliable support point for a downtrend to take place.
📉 Key Levels
Support: 1.365-1.356
Resistance: 1.370
SELL Trigger: Rejects bellow 1.370
SELL DCA Trigger: Break support 1.365
Target 1.356
BUY Trigger: Break and trading above resistance 1.370
Leave your comments on the idea. I am happy to read your views.

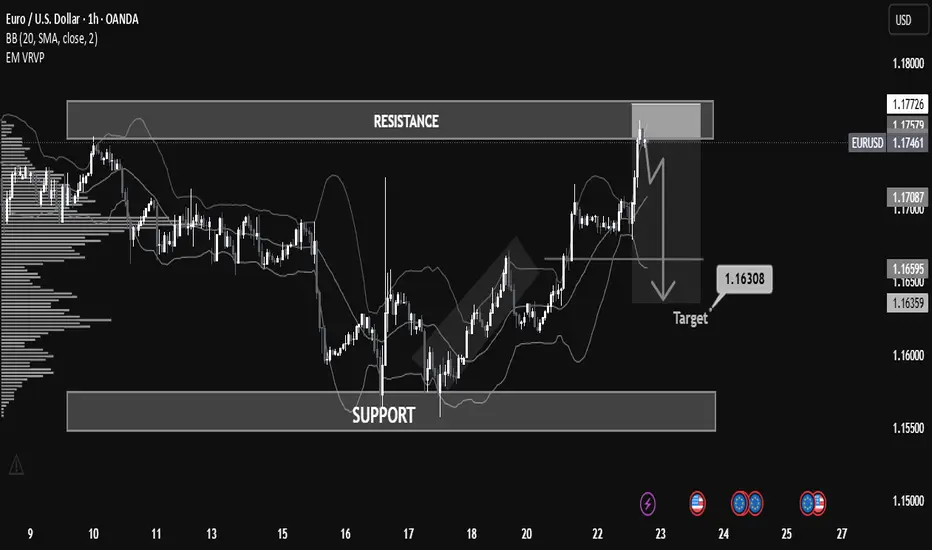
Why EUR/USD Dropped: A Step-by-Step Breakdown for Learners📉 Overview:
The EUR/USD has recently approached a key resistance zone near 1.17726, showing signs of a potential rejection after a bullish rally. The price is currently hovering around 1.17468, forming a short-term bearish setup that could lead to a retracement or reversal.
⸻
⚙ Key Technical Zones:
• 🔼 Resistance: 1.17500 – 1.17726
Price was strongly rejected after testing this area. This level has historically acted as a supply zone.
• 🔽 Support: 1.15500 – 1.16000
This is a historically significant demand zone, where price previously consolidated and reversed.
• 🎯 Target Zone: 1.16308
Marked as a potential take-profit level based on prior price structure and volume profile imbalance.
⸻
🧠 Indicators & Tools:
• Bollinger Bands: Price touched the upper band in overbought conditions, suggesting a possible mean reversion.
• Volume Profile (VRVP): Indicates declining volume near resistance, pointing to weak buyer momentum.
• Price Action: Bearish engulfing candle and strong rejection wick at resistance, confirming selling pressure.
⸻
🧭 Market Bias:
📌 Short-Term Bearish
A short opportunity is forming based on the rejection from resistance and overextension of price.
⸻
🧩 Possible Scenario:
1. Breakdown below 1.17061 (mid-level support) could trigger acceleration to the downside.
2. 1.16500 and 1.16308 are ideal short targets before reevaluation for continuation or bounce.
⸻
🛑 Risk Management Tips:
• Consider SL above 1.17800 (previous high).
• Monitor for confirmation before entry (e.g., bearish candle close below 1.17000).
• Adjust size and risk-reward ratio appropriately.
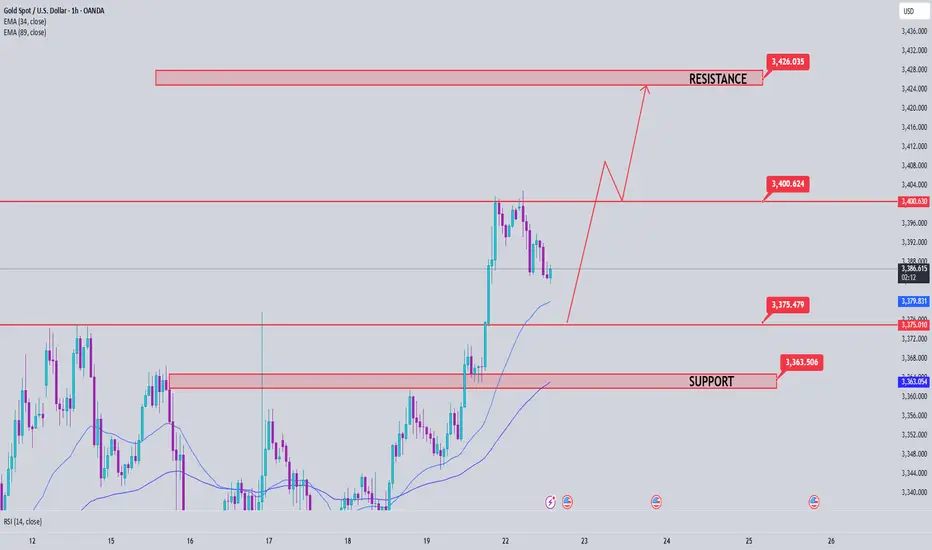
Gold Price Analysis July 22Gold continues to maintain its upward momentum as expected, and yesterday's session reached the target of 3400. This is a signal that the bullish wave structure is still holding. In today's European trading session, the price is likely to make a technical correction to important support zones before continuing the main trend in the US session.
The current trading strategy still prioritizes following the uptrend, focusing on observing price reactions at support zones to find safe entry points. Waiting for buyers to confirm participation is a key factor to avoid FOMO at the wrong time.
🔑 Key Levels
Support: 3375 – 3363
Resistance: 3400 – 3427
✅ Trading Strategy
Buy Trigger #1: Price reacts positively and rejects the support zone at 3375
Buy Trigger #2: Price rebounds strongly from the deeper support zone at 3363
Buy DCA (Moving Average): When price breaks and holds above 3400
🎯 Next Target: 3427
📌 Note: It is necessary to closely monitor price reaction at support zones to determine whether buying power is strong enough. If there is no clear confirmation signal, it is better to stay on the sidelines and observe instead of FOMOing to place orders.
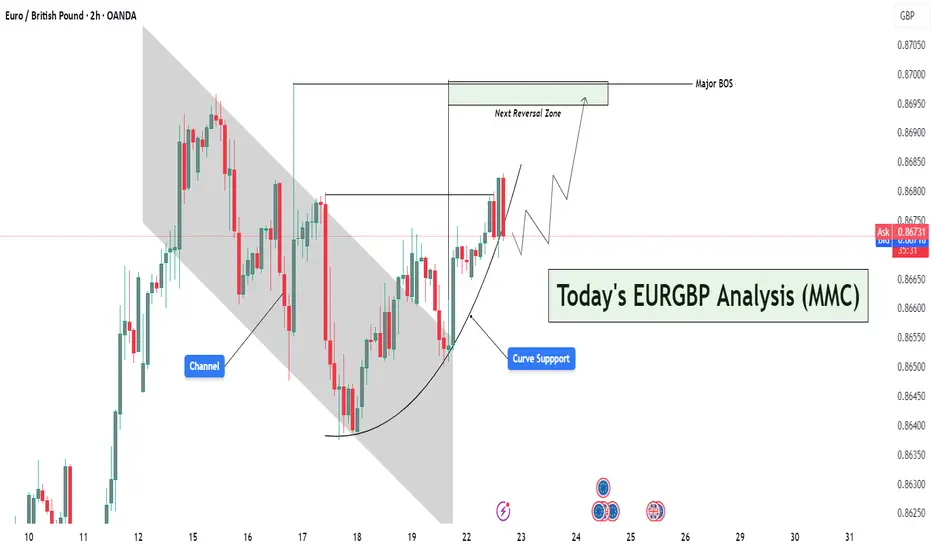
EURGBP Curved Support Breakout – Targeting Reversal Zone🔍 Market Context & Structural Narrative (MMC Style)
The EURGBP pair is currently displaying a textbook MMC structural evolution, transitioning from a bearish trend into a potential bullish leg driven by curve dynamics and trap-break logic.
🔨 Phase 1: Bearish Channel & Trap Formation
The market initially moved within a clearly defined descending channel, which acted as a trap for reactive sellers. Each lower high and lower low within the channel created a perception of sustained bearishness, luring breakout traders and late sellers into short positions.
✅ Key Insight:
This trap zone represents the first step in MMC logic — create a visible structure, generate bias, then prepare for inversion.
🌙 Phase 2: Curve Support – Psychological Accumulation
Around the base of the channel, the market began forming a rounded bottom or curve support. This is a signature MMC accumulation pattern, where market makers gradually absorb sell orders and build long positions without triggering immediate attention.
The curve support has the following implications:
Represents passive accumulation.
Suggests waning bearish pressure.
Builds bullish pressure subtly, often missed by retail traders.
🧠 MMC Mindset Tip:
Curved price action isn't just technical — it's psychological. It represents a controlled shift in sentiment, not an impulsive change, which is what makes it so powerful.
💥 Phase 3: Break of Structure (BOS) – Confirmation of Strength
Price breaks out of both the descending channel and the curved base, leading to a Major Break of Structure (BOS). This BOS is critical, as it confirms the invalidity of the previous bearish narrative and activates a new bullish leg.
📌 This BOS is more than a line — it’s a wall of liquidity getting broken. Price has now closed above key swing highs, which suggests:
Smart money is in control.
Trend shift is validated.
New demand zone created below.
🎯 Projection: The Path to the Next Reversal Zone (NRZ)
Following the breakout, price is projected to:
Possibly retest the breakout level (structure retest) aligned with the curve support — a healthy bullish pullback.
Then move higher towards the Next Reversal Zone (NRZ), which is your defined target area.
📌 NRZ Insight:
This zone is where the market is likely to face:
High liquidity.
Strong previous supply.
Potential profit-taking by early bulls.
Thus, this becomes the make-or-break zone — price either:
Reverses sharply,
Or breaks through and continues the bull rally.
⚠️ Multiple Scenarios Based on MMC Conditions
✅ Scenario 1: Retest & Bounce (Ideal MMC Setup)
Price pulls back to retest the breakout level or the curve support.
Shows bullish confirmation (e.g., pin bar, bullish engulfing).
Targets the NRZ above 0.8700.
❌ Scenario 2: Failed Retest – Fakeout Trap
Price breaks below the curve and structure again.
Suggests that the BOS was a false breakout.
Could re-enter the previous bearish channel structure.
🔄 Scenario 3: Direct Rally Without Retest
Strong momentum buyers push price directly to NRZ.
Wait for reaction at NRZ — could trigger a reversal or continuation depending on price behavior.
🧠 MMC Strategic Takeaways:
Trap → Break → Shift is the psychological framework in play.
The curve is not just support — it's evidence of silent accumulation.
The NRZ isn’t just resistance — it's the battleground where MM logic resolves.
🔐 Trading Insights (Optional Entry Ideas):
Entry: On bullish confirmation near 0.8660–0.8665 (curve/structure support).
SL: Below curve base (e.g., 0.8640).
TP: Near or slightly below NRZ (0.8700–0.8705), partial profits or full exit.
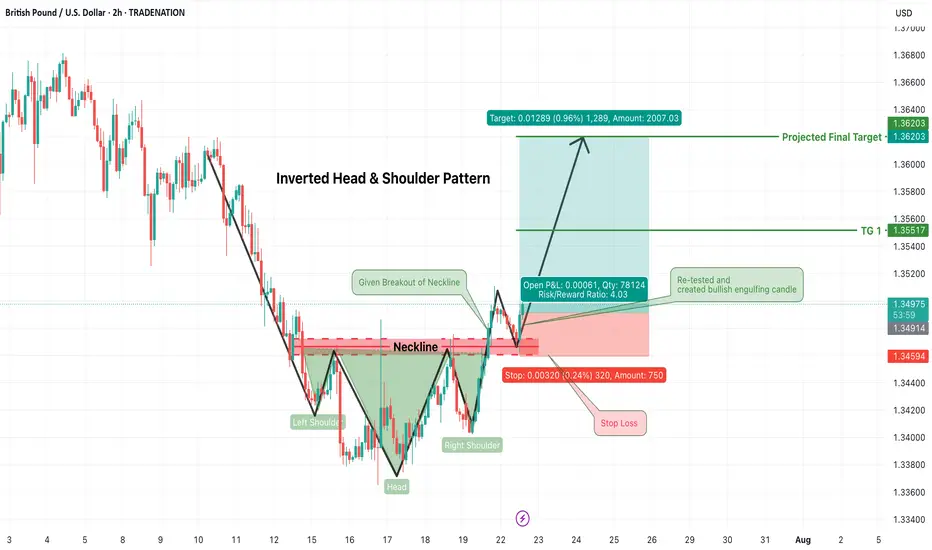
GBPUSD Long Trade Alert – Inverted Head & Shoulders BreakoutGBPUSD has confirmed a classic Inverted Head & Shoulders pattern, signaling a strong bullish reversal opportunity on the 2-hour chart. Price has successfully broken above the neckline resistance zone (~1.3490) and has now retested that zone, forming a bullish engulfing candle — an ideal confirmation for long entries.
🟢 Trade Plan:
Entry: After bullish engulfing candle formed on neckline retest (~1.3490–1.3500)
Stop Loss: Just below the right shoulder low / retest swing low (~1.3455)
Risk/Reward Ratio: ~4:1 (High reward with tightly controlled risk)
🎯 Target Levels:
Target 1: 1.3555
Final Target (Projected): 1.3620
These levels align with structure resistance and measured move of the pattern
📌 Why This Trade Matters:
Pattern confirmed ✅
Retest successful ✅
Bullish confirmation candle ✅
Clean invalidation and upside potential ✅
This is a textbook reversal play, offering solid structure, clear stop placement, and attractive upside. Perfect for swing traders or short-term position setups.
📉 Trade what you see, not what you think. Let price action lead your execution.
=================================================================
Disclosure: I am part of Trade Nation's Influencer program and receive a monthly fee for using their TradingView charts in my analysis.
=================================================================
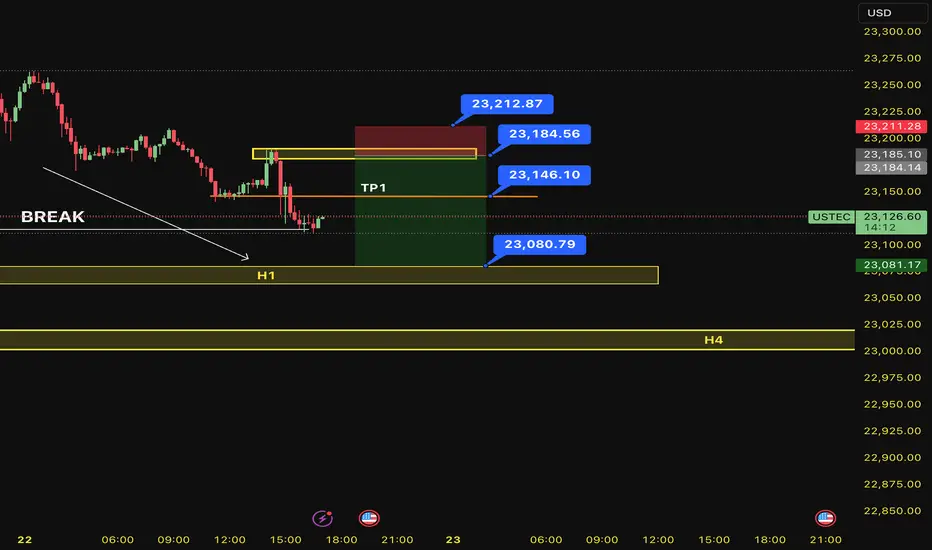
SELL USTEC 22.7.2025Confluence trade order: SELL at M15
Type of entry: Limit order
Condition:
- If the price break down THE LAST TOP confirming the down trend into H1.
Note:
- Management of money carefully at the price of bottom (23,146)
Set up entry:
- Entry sell at 23,184
- SL at 23,212
- TP1: 23,146
- TP2: 23,080
Trading Method: Price action (No indicator, only trend and candles)
22.07.25 Morning ForecastPairs on Watch -
FX:GBPJPY
FX:AUDUSD
OANDA:XAUUSD
FX:GBPUSD
A short overview of the instruments I am looking at for today, multi-timeframe analysis down to what I will be looking at for an entry. Enjoy!

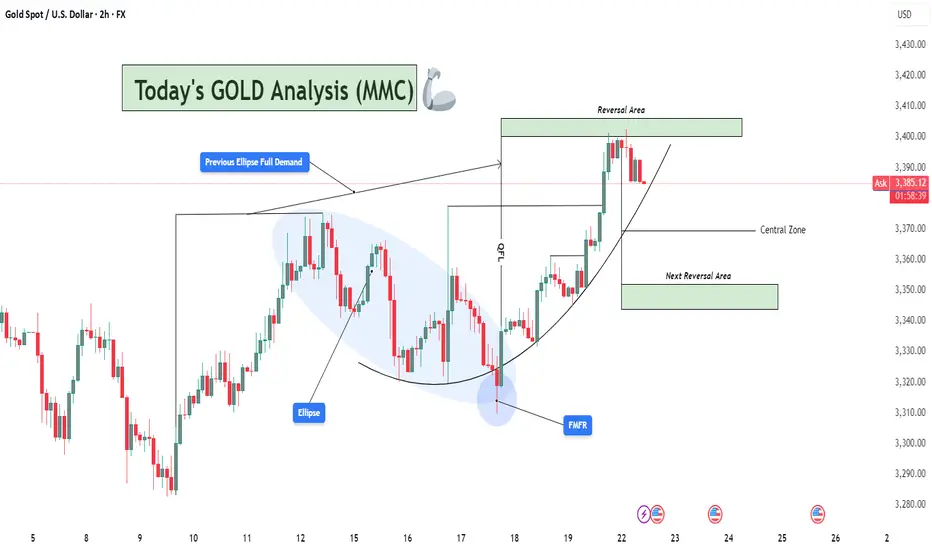
XAUUSD Analysis : From Ellipse Demand to Reversal Zone – Target Hello traders!
Let’s decode today’s GOLD setup using the MMC (Mirror Market Concepts) strategy. This is a clean and textbook example of how institutional price delivery works – from demand creation to reversal zones. Let’s go step by step👇
🔵 Previous Ellipse Full Demand – The Accumulation Phase:
The market initially formed an Ellipse structure, which you’ve rightly marked as the Previous Full Demand Zone. This is where smart money started to accumulate long positions after pushing the market into a discounted area.
Price remained inside this ellipse zone for a while, showing slow and controlled price action with multiple rejections from the bottom. This type of price behavior is usually a trap zone, where retail traders are shaken out, and institutions silently build their positions.
💥 FMFR Zone – Where Momentum Begins:
On July 18, a clear FMFR (Fresh Money Flow Reversal) took place. This is the moment where price broke out of the ellipse demand zone with strength.
This FMFR marks the transition from accumulation to markup phase. It signals that the market makers have done their job in collecting liquidity and are now ready to drive price upward.
From this FMFR, the market respected a curved path — a classic MMC parabolic build-up, showing buyer dominance throughout.
📈 One-Time Delivery (OTD) – Clean Impulse:
Following the FMFR, price followed a One-Time Delivery (OTD) move. You’ve marked this beautifully with the vertical box showing the aggressive bullish impulse.
The candles are strong, consecutive, and with minimal pullbacks — a sign that the market is being delivered efficiently by the institutions toward their target.
🟩 Reversal Area – Target Reached:
Price has now entered the Reversal Area (Supply Zone), which was expected based on previous structure and imbalance. The market is reacting to this area already — giving signs of exhaustion.
From an MMC perspective, this is a potential “sell to buy” or “buy to sell” trap zone, where the market could either reverse completely or engineer liquidity before moving again.
⚖️ Central Zone – Balance Area:
Below the current price lies the Central Zone, which is a neutral area where the market may consolidate if it fails to hold higher or reject immediately. This area usually acts as a pause or buffer zone, often seen before the market decides the next leg (up or down).
🔄 Next Reversal Area – Demand Reload Zone:
If price drops, the Next Reversal Area marked below (around the 3,345–3,355 range) will be crucial. This is the zone where you should watch for:
Bullish rejections
FMFR signals
Trap candles (like liquidity wicks)
Expect this area to act as the next “Buy Program”, where institutions might step back in to reload longs.
🧠 Conclusion & Trader Mindset:
✅ Market respected MMC phases: Accumulation ➝ FMFR ➝ Delivery ➝ Reversal
🛑 Currently in a high-probability reaction zone – wait for confirmation before trading.
👁️ Watch how price behaves in the Reversal Area — rejection or continuation?
🔁 If market retraces, Next Reversal Area is your prime hunting zone for long setups.
🔔 Stay Patient – React, Don’t Predict.
Let the market reveal its next move. Whether it’s a pullback to reload longs or a deeper retracement, MMC logic will guide you to stay on the right side.
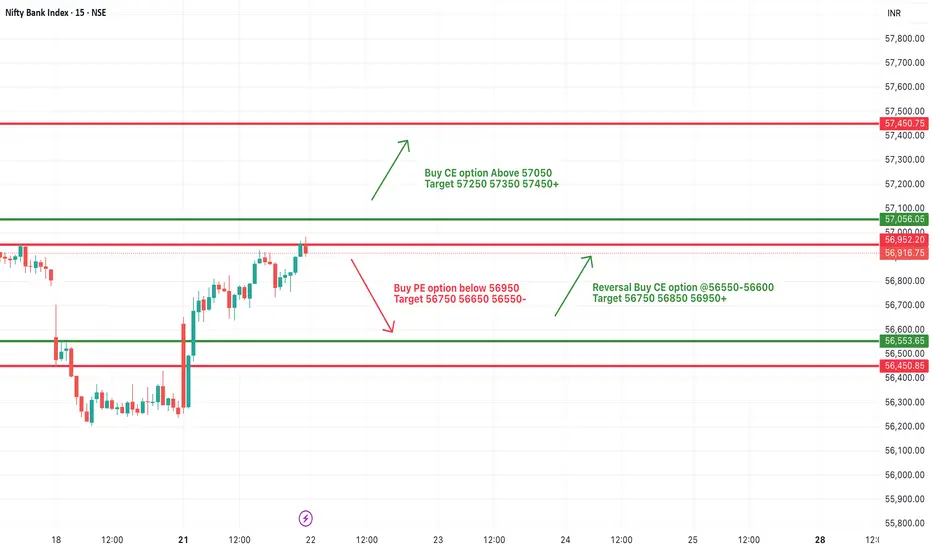
[INTRADAY] #BANKNIFTY PE & CE Levels(22/07/2025)Bank Nifty is expected to open gap-up today, continuing the momentum seen in yesterday’s session. The index has successfully crossed above the short-term resistance zone near 56,900, showing bullish strength. The next key breakout level is at 57,050, and once crossed decisively, we may see a sharp upward rally.
Traders can look to Buy CE option above 57,050, targeting 57,250, 57,350, and 57,450+. The structure indicates that momentum buyers may take over above this zone, with the potential for strong upside if Bank Nifty sustains above the breakout level.
On the downside, if the index slips back and breaks 56,950 decisively, then Buy PE option below 56,950 can be considered, with potential downside targets of 56,750, 56,650, and 56,550-. This zone will act as an immediate intraday support and any fall below it can lead to quick profit-booking.
Additionally, if Bank Nifty finds support near the 56,550–56,600 zone again, traders may also consider reversal CE buying with upside targets of 56,750, 56,850, and 56,950+.
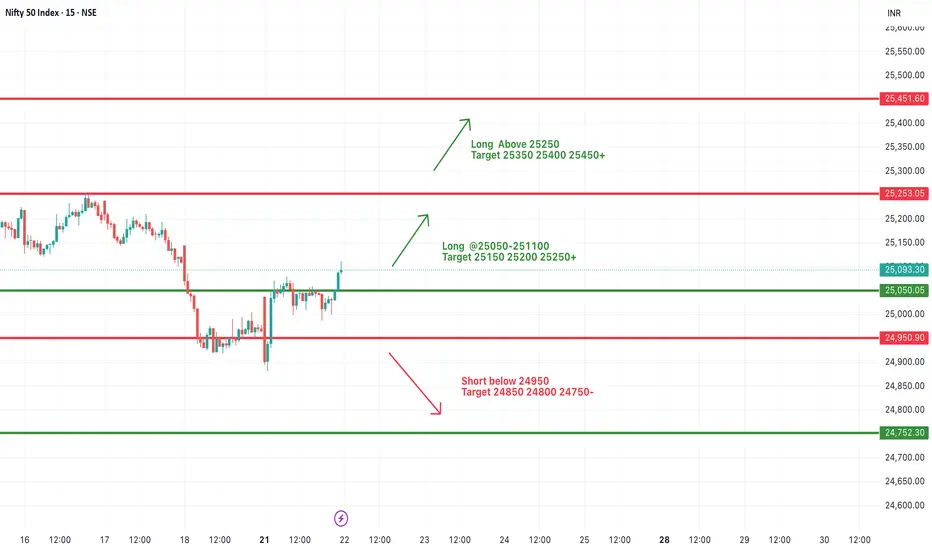
#NIFTY Intraday Support and Resistance Levels - 22/07/2025Today, Nifty is expected to open slightly gap-up, indicating positive early sentiment. After breaking out from the previous day’s consolidation zone, the index has shown strength around the 25,050 level, which will now act as an important intraday support. If this level is held during the early session, we can expect further upside continuation.
A move above the 25,050–25,100 zone can trigger upward momentum with potential targets at 25,150, 25,200, and 25,250+. Sustained strength above 25,250 will open the door for further bullish moves toward 25,350, 25,400, and 25,450+, making it a favorable long scenario for trending market conditions.
However, if the index fails to hold above the 25,050 level and starts trading back below 24,950, it may again enter a bearish territory. In such a case, downside targets of 24,850, 24,800, and 24,750- are possible, indicating weakness and reversal from resistance.
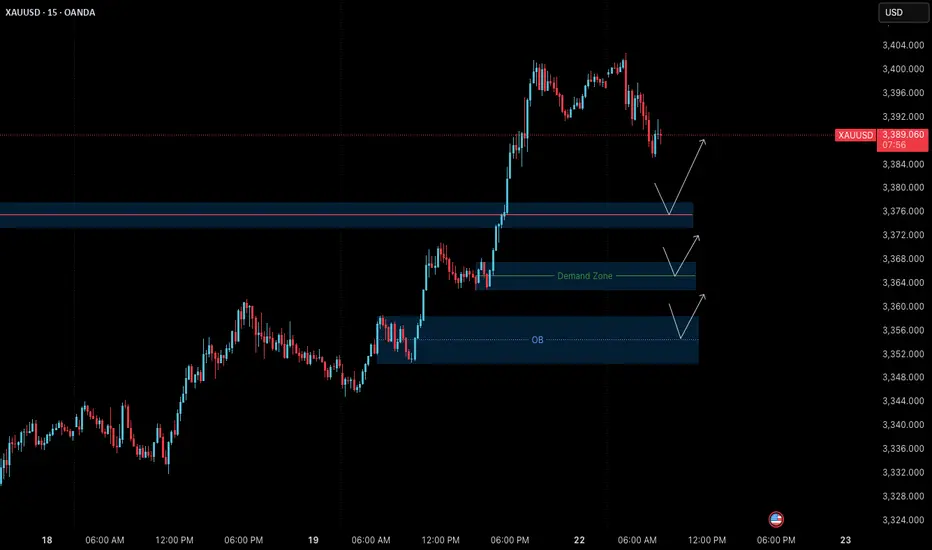
Gold (XAUUSD) – 22 July Outlook | Reversal Zones in FocusGold (XAUUSD) – 22 July Outlook | Three Key Reversal Zones to Watch
Yesterday, Gold gave a strong breakout above the key resistance level at 3377 , shifting the M15 structure bullish and confirming upside strength.
Today, the market is likely entering a retracement phase on both the H4 and M15 timeframes — a healthy pullback after a breakout, which may lead to the next leg of the uptrend.
So where should we focus for long opportunities?
We are observing three key zones as potential bases for the continuation move:
📍 Zone 1 – 3377.6–3373.5 (Breaker Block):
This is the immediate structure zone — previous resistance which may now flip into support.
→ If price respects this area, we can anticipate a classic S&R Flip setup.
📍 Zone 2 – 3367.5–3363 (Demand Block):
If the first level doesn’t hold, this zone becomes critical. It lies just under the breakout base and could act as the next level of defense by bulls.
📍 Zone 3 – 3358.5–3350.5 (H4 Order Block):
This is the most significant support zone for the day. It aligns with a higher-timeframe order block, making it a high-probability POI for a deeper pullback and reversal.
But remember, we do not predict blindly .
Plan of Action:
– Observe price behavior at each zone
– Wait for confirmation via M1 internal structure shifts + BoS
– Trade only when all conditions align
– SL: 40 pips | TP: 120 pips
Risk-Reward: Always 1:3
Summary:
✅ Structure is now bullish on M15 and H4
✅ We’re in a pullback phase — ideal for continuation trades
✅ Three clear POIs mapped — now we wait for the market to speak
Patience. Precision. Discipline.
Let the trade come to you — not the other way around.
📘 Shared by @ChartIsMirror
GBPAUD's wide trading range remains intact✏️GBPAUD is trading in a wide range. After the increase on Friday, the pair is retesting the support zone breaking past resistance. And the current reaction point also coincides with the 20 SMA. There is not much momentum for the pair to break out of the wide trading range, so buying the pair to the upper range of 2.097 is a reasonable choice at the moment.
📉 Key Levels
Support: 2.058
Resistance: 2.083-2.096
BUY Trigger: Confirmed bounce from 2.059 (EMA support)
Target 2.09600
BUY DCA Trigger: Break 2.083
Leave your comments on the idea. I am happy to read your views.

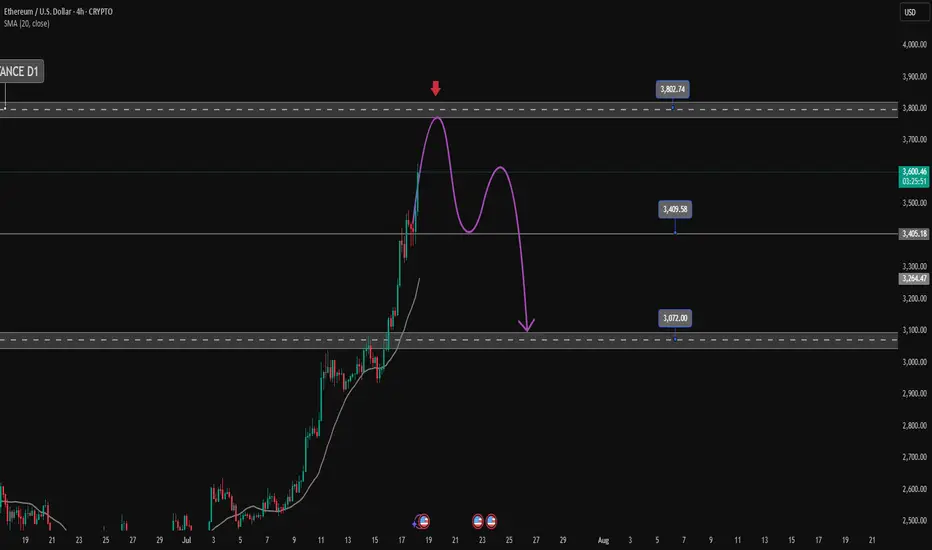
ETHUSD heading towards the top of the D1 frame✏️ CRYPTO:ETHUSD is in a strong uptrend towards the resistance zone of the 3800 daily frame. There are not many conditions for the sellers to jump in and reverse the current trend. Wait for the price reaction at the resistance of the D1 frame to consider the SELL strategy. Because currently if BUY is too Fomo.
📉 Key Levels
Sell trigger: Rejection from 3800
Target 3400, potentially 3,380
Leave your comments on the idea. I am happy to read your views.
Gold returns to its original nature. Price increase towards 3400✏️ OANDA:XAUUSD is back to its inherent uptrend. Currently trading in a wide range. Shaped by CPI news last week. Trendline is still supporting Gold price towards 3400 next week. Pay attention to the important zone 3373 to DCA BUY and do not SELL when breaking this important zone 3373. Effective trading strategy is to wait for Gold to correct and buy.
📉 Key Levels
Support: 3343 - 3322
Resistance: 3373-3400
Buy Trigger: Rejects the support zone 3343 and reacts to the upside
Buy Trigger: Rebound from 3322
Target 3400
Leave your comments on the idea. I am happy to read your views.

Gold Price Analysis July 21After being reinforced by CPI data last week, gold prices have regained their bullish momentum and are currently trading in a wide range. The technical structure still shows a dominant uptrend, with the trendline continuing to act as reliable support, targeting the important resistance zone of 3400 next week.
📌 Preferred trading strategy:
Watch the price reaction around the support zone of 3343. If there is a rejection signal of this zone accompanied by buying pressure, that will be the ideal entry point.
If the price continues to correct deeper, the strong support zone of 3322 will be a reasonable DCA point.
It is not recommended to SELL if the price breaks the confluence zone of 3373, as this is a signal confirming the strong bullish momentum continues.
📍 Important price zones:
Support: 3343 – 3322
Resistance: 3373 – 3400
🚀 Buy Trigger:
Price rejects 3343 zone with clear bullish signal
Strong bounce from 3322 zone

21.07.25 Morning ForecastPairs on Watch -
FX:GBPAUD
FX:EURUSD
FX:AUDUSD
OANDA:XAUUSD
A short overview of the instruments I am looking at for today, multi-timeframe analysis down to what I will be looking at for an entry. Enjoy!

#NIFTY Intraday Support and Resistance Levels - 21/07/2025Nifty is likely to start the day with a flat opening, as current price action is indicating a consolidation phase near the lower range. The zone between 24,950–25,050 is acting as a key area of indecision, where prices are stuck in a tight range, showing a lack of clear momentum. This consolidation could lead to a breakout or breakdown depending on how the index reacts at key levels.
If Nifty sustains above 25,050, it may trigger a short-term upward move, breaking the consolidation phase. In such a scenario, an upside rally towards 25,150, 25,200, and 25,250+ levels can be expected, making it a favorable long setup for intraday traders.
On the contrary, if the index slips below 24,950, the selling pressure may increase, and downside momentum can accelerate. A breakdown here could pull the index towards support levels of 24,850, 24,800, and even 24,750-, which would confirm bearish strength.
Traders are advised to avoid aggressive positions within the consolidation zone and wait for a breakout or breakdown for directional trades. Quick entries with partial profit booking at every level and strict stop-losses are recommended to manage risk efficiently in today’s range-bound environment.