17.01.25 Morning ForecastPairs on Watch -
OANDA:XAGUSD
FX:GBPNZD
A short overview of the instruments I am looking at for today, multi-timeframe analysis down to what I will be looking at for an entry. Enjoy!
Priceactionanalysis

#NIFTY Intraday Support and Resistance Levels - 17/01/2025Flat opening expected in nifty. After opening it will face resistance zone at 23350-23400 level. Any strong bullish rally only expected above the 23400 level breakout. Downside 23150 act as a support for today's session. Any reversal downside rally can be goes upto this support level in today's session.

[INTRADAY] #BANKNIFTY PE & CE Levels(17/01/2025)Today will be flat opening expected in banknifty. After opening it will consolidated in range of 49050-49450 level. 49450 level act as a upside resistance for banknifty. If index gives breakout of this resistance then expected strong upside rally of 400-500+ points possible. Similarly, If banknifty starts trading below 48950 level then downside fall expected upto the 48550 level.

16.01.25 Morning ForecastPairs on Watch -
FX:USDJPY
OANDA:XAGUSD
FX:GBPAUD
A short overview of the instruments I am looking at for today, multi-timeframe analysis down to what I will be looking at for an entry. Enjoy!

[INTRADAY] #BANKNIFTY PE & CE Levels(16/01/2025)Today will be gap up opening in banknifty. Expected opening near 49000 level. After opening possible reversal from this level to continue bearish trend. If reversal confirmation at this level can gives 400-500 points downside rally in banknifty. This rally can be extend for another 400-500 points if its starts trading below 48450 level. Any upside rally only expected if banknifty sustain and starts trading above 49050 level.

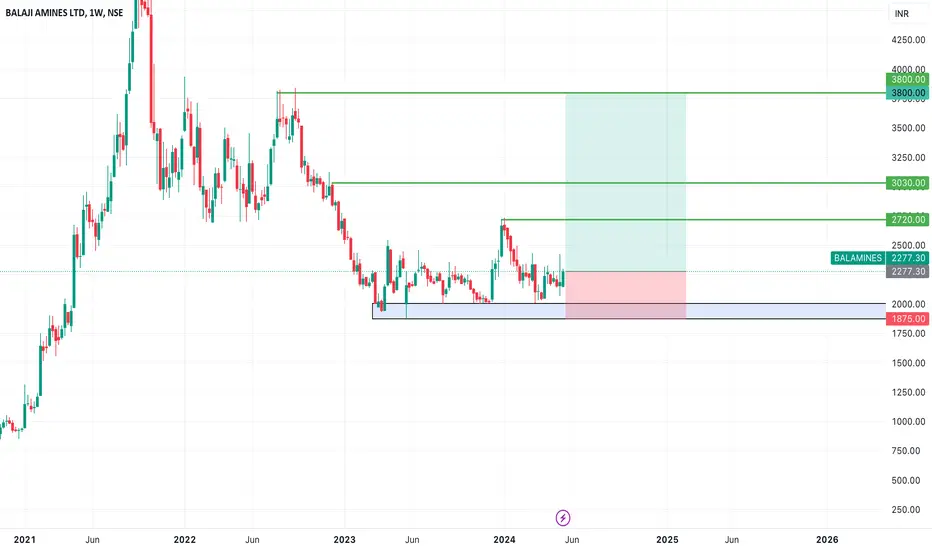
SWING IDEA - BALAJI AMINESBalaji Amines , a leading manufacturer of specialty chemicals, is showing promising signs for a potential swing trade.
Reasons are listed below:
Crucial Support Zone (1850-2000) : The 1850-2000 range has proven to be a strong support zone, indicating significant buying interest and potential for a price rebound.
0.618 Fibonacci Support : The price has found support at the 0.618 Fibonacci retracement level, often referred to as the "golden ratio," suggesting a likely reversal or continuation of the uptrend.
Bullish Marubozu Candle on Weekly Timeframe : The recent weekly candle is a bullish marubozu, characterized by little to no shadows, indicating strong buying pressure and potential for further upward movement.
Support from 50 and 200 EMA on Weekly Timeframe : The stock is trading above both the 50-week and 200-week exponential moving averages, providing strong support and confirming the long-term uptrend.
Increase in Volumes : A noticeable spike in trading volume often confirms the strength of a price move, indicating greater participation and confidence in the direction of the trend.
Target - 2720 // 3030 // 3800
Stoploss - weekly close below 1875
DISCLAIMER -
Decisions to buy, sell, hold or trade in securities, commodities and other investments involve risk and are best made based on the advice of qualified financial professionals. Any trading in securities or other investments involves a risk of substantial losses. The practice of "Day Trading" involves particularly high risks and can cause you to lose substantial sums of money. Before undertaking any trading program, you should consult a qualified financial professional. Please consider carefully whether such trading is suitable for you in light of your financial condition and ability to bear financial risks. Under no circumstances shall we be liable for any loss or damage you or anyone else incurs as a result of any trading or investment activity that you or anyone else engages in based on any information or material you receive through TradingView or our services.
@visionary.growth.insights
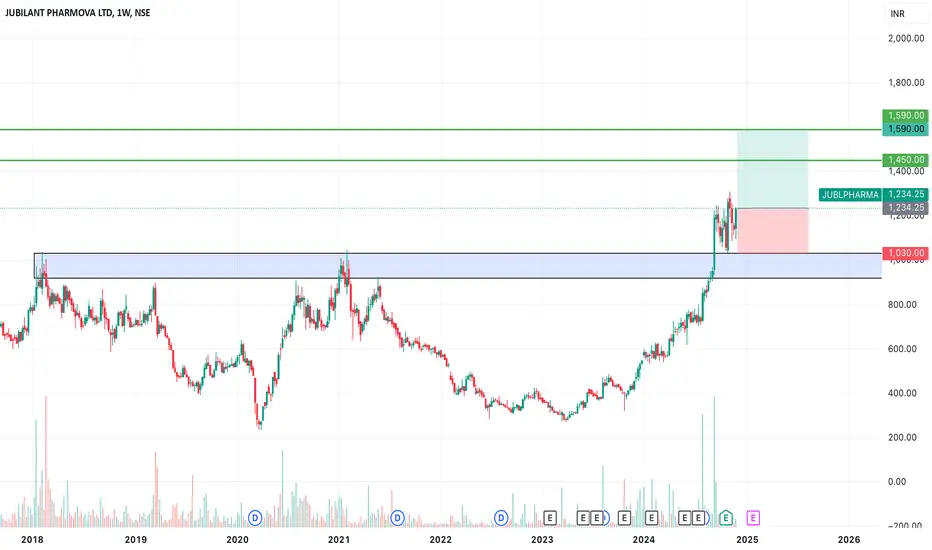
SWING IDEA - JUBILANT PHARMOVAJubilant Pharmova , a diversified global pharmaceutical and life sciences company, offers an attractive swing trade setup with the following technical factors.
Reasons are listed below :
Break of 1000 Resistance : The price has decisively broken above the significant 1000 level and is sustaining, indicating strength and bullish momentum.
Consolidation Breakout : The stock is breaking out of a consolidation phase lasting over 6 years, suggesting a potential long-term uptrend.
Volume Spike : Increased trading volumes highlight growing investor interest and support the breakout.
Engulfing Candle : A bullish engulfing candle on the weekly timeframe reflects strong buying sentiment.
Target - 1450 // 1590
Stoploss - weekly close below 1030
DISCLAIMER -
Decisions to buy, sell, hold or trade in securities, commodities and other investments involve risk and are best made based on the advice of qualified financial professionals. Any trading in securities or other investments involves a risk of substantial losses. The practice of "Day Trading" involves particularly high risks and can cause you to lose substantial sums of money. Before undertaking any trading program, you should consult a qualified financial professional. Please consider carefully whether such trading is suitable for you in light of your financial condition and ability to bear financial risks. Under no circumstances shall we be liable for any loss or damage you or anyone else incurs as a result of any trading or investment activity that you or anyone else engages in based on any information or material you receive through TradingView or our services.
@visionary.growth.insights
SWING IDEA - DEEPAK NITRITE LTDDeepak Nitrite , a leading chemical company known for its diverse product portfolio, is showing a promising setup for swing trading.
Reasons are listed below :
2500 Support Zone : The price is resting on a well-tested support level around 2500, adding to the reliability of a potential bounce.
Hammer Candle on Weekly Timeframe : The appearance of a hammer candle suggests a reversal could be on the horizon as buyers regain control.
Golden Fibonacci Support : The current price aligns with a key Fibonacci retracement level, providing additional support.
50 EMA Support on Weekly Timeframe : The price holding above the 50 EMA is a sign of continued strength and underlying support.
Trend Intact with Higher Highs and Higher Lows : The consistent formation of higher highs and higher lows reinforces a bullish trend.
Target - 3000 // 3170
Stoploss - weekly close below 2440
DISCLAIMER -
Decisions to buy, sell, hold or trade in securities, commodities and other investments involve risk and are best made based on the advice of qualified financial professionals. Any trading in securities or other investments involves a risk of substantial losses. The practice of "Day Trading" involves particularly high risks and can cause you to lose substantial sums of money. Before undertaking any trading program, you should consult a qualified financial professional. Please consider carefully whether such trading is suitable for you in light of your financial condition and ability to bear financial risks. Under no circumstances shall we be liable for any loss or damage you or anyone else incurs as a result of any trading or investment activity that you or anyone else engages in based on any information or material you receive through TradingView or our services.
@visionary.growth.insights

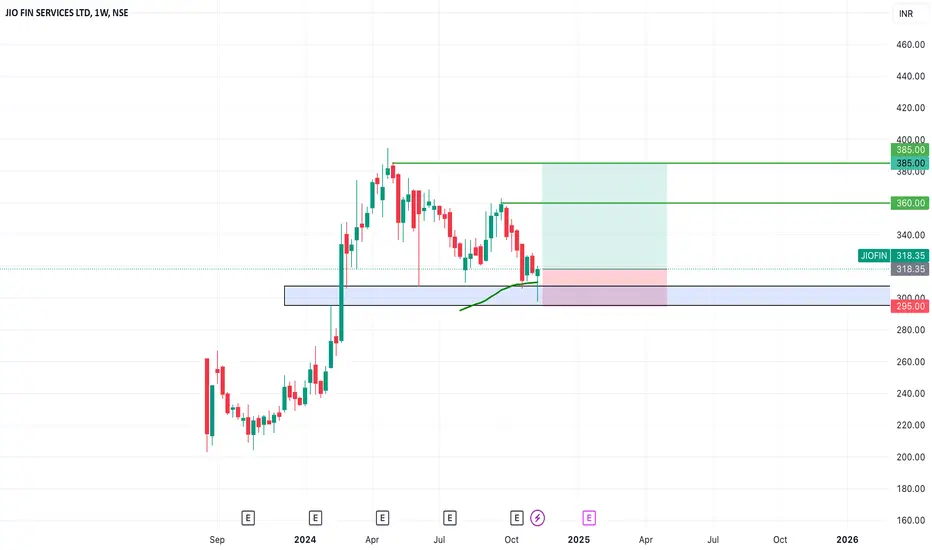
SWING IDEA - JIO FINANCIAL SERVICESJio Financial Services , an emerging force in the financial sector, exhibits signs of a potential upward move, presenting a swing trading opportunity.
Reasons are listed below :
Strong Support Zone at 300 : This level has proven to be a strong support, enhancing the likelihood of a bounce.
Bullish Hammer on Weekly Timeframe : A bullish hammer candlestick pattern indicates potential reversal and buyer interest at lower levels.
0.5 Fibonacci Support : The price is aligned with the 0.5 Fibonacci retracement level, suggesting that it could act as a springboard for further upward movement.
50 EMA Support on Weekly Timeframe : Trading above the 50 EMA adds to the bullish outlook and provides an additional layer of support.
Target - 360 // 385
Stoploss - weekly close below 295
DISCLAIMER -
Decisions to buy, sell, hold or trade in securities, commodities and other investments involve risk and are best made based on the advice of qualified financial professionals. Any trading in securities or other investments involves a risk of substantial losses. The practice of "Day Trading" involves particularly high risks and can cause you to lose substantial sums of money. Before undertaking any trading program, you should consult a qualified financial professional. Please consider carefully whether such trading is suitable for you in light of your financial condition and ability to bear financial risks. Under no circumstances shall we be liable for any loss or damage you or anyone else incurs as a result of any trading or investment activity that you or anyone else engages in based on any information or material you receive through TradingView or our services.
@visionary.growth.insights
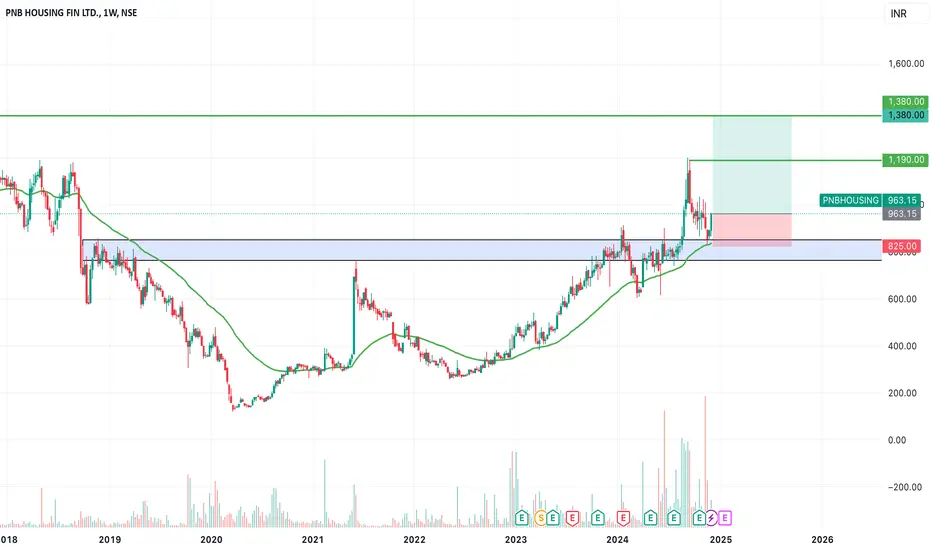
SWING IDEA - PNB HOUSING FINANCEPNB Housing Finance , a prominent housing finance company in India, is exhibiting a promising swing trade setup supported by strong technical signals.
Reasons are listed below :
Breakout and Retest of 800 Zone : The stock previously broke a strong resistance at 800 and is now retesting it, showing potential for upward momentum.
Bullish Marubozu Candle : A strong bullish marubozu candle on the weekly timeframe indicates robust buying interest.
Golden Fibonacci Zone : The stock is bouncing back from a key Fibonacci retracement level, suggesting a continuation of the uptrend.
50 EMA Support : Price action is well-supported by the 50 EMA on the weekly timeframe, affirming bullish sentiment.
Volume Spike : A significant increase in trading volumes highlights growing investor confidence.
Target - 1190 // 1380
Stoploss - weekly close below 825
DISCLAIMER -
Decisions to buy, sell, hold or trade in securities, commodities and other investments involve risk and are best made based on the advice of qualified financial professionals. Any trading in securities or other investments involves a risk of substantial losses. The practice of "Day Trading" involves particularly high risks and can cause you to lose substantial sums of money. Before undertaking any trading program, you should consult a qualified financial professional. Please consider carefully whether such trading is suitable for you in light of your financial condition and ability to bear financial risks. Under no circumstances shall we be liable for any loss or damage you or anyone else incurs as a result of any trading or investment activity that you or anyone else engages in based on any information or material you receive through TradingView or our services.
@visionary.growth.insights
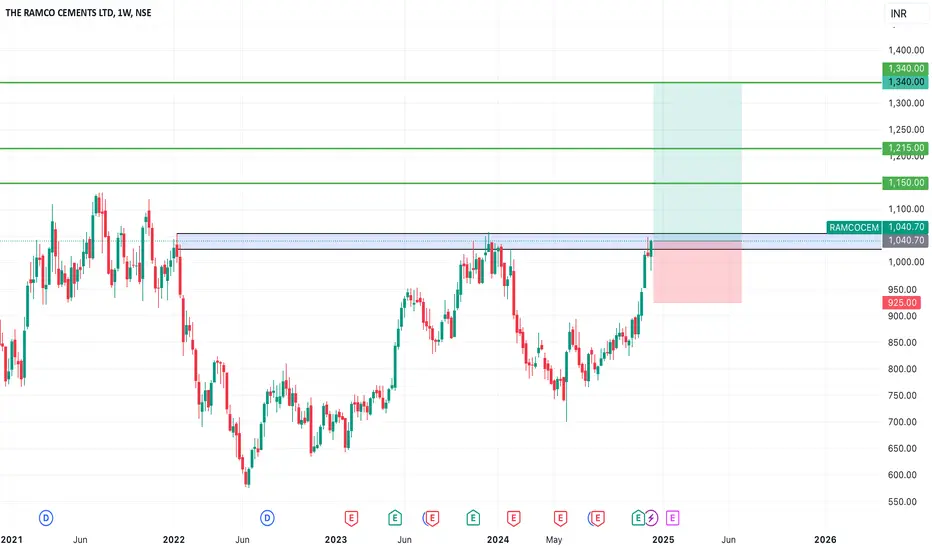
SWING IDEA - THE RAMCO CEMENTS Ramco Cements , one of India's leading cement manufacturers, is showing a promising swing trade setup with compelling technical signals.
Reasons are listed below :
Cup and Handle Pattern Breakout : The price is breaking out from a classic cup and handle pattern, which indicates a continuation of the upward trend.
1050 Resistance Zone : This level has been tested multiple times and is now showing signs of a breakout, suggesting strong bullish sentiment.
2.5+ Year Consolidation Break : The stock is emerging from a prolonged consolidation phase, which often signals a significant trend reversal or continuation.
Bullish Engulfing Candle : A bullish engulfing candle on the daily timeframe highlights strong buying momentum.
Target - 1150 // 1215 // 1340
Stoploss - weekly close below 925
DISCLAIMER -
Decisions to buy, sell, hold or trade in securities, commodities and other investments involve risk and are best made based on the advice of qualified financial professionals. Any trading in securities or other investments involves a risk of substantial losses. The practice of "Day Trading" involves particularly high risks and can cause you to lose substantial sums of money. Before undertaking any trading program, you should consult a qualified financial professional. Please consider carefully whether such trading is suitable for you in light of your financial condition and ability to bear financial risks. Under no circumstances shall we be liable for any loss or damage you or anyone else incurs as a result of any trading or investment activity that you or anyone else engages in based on any information or material you receive through TradingView or our services.
@visionary.growth.insights
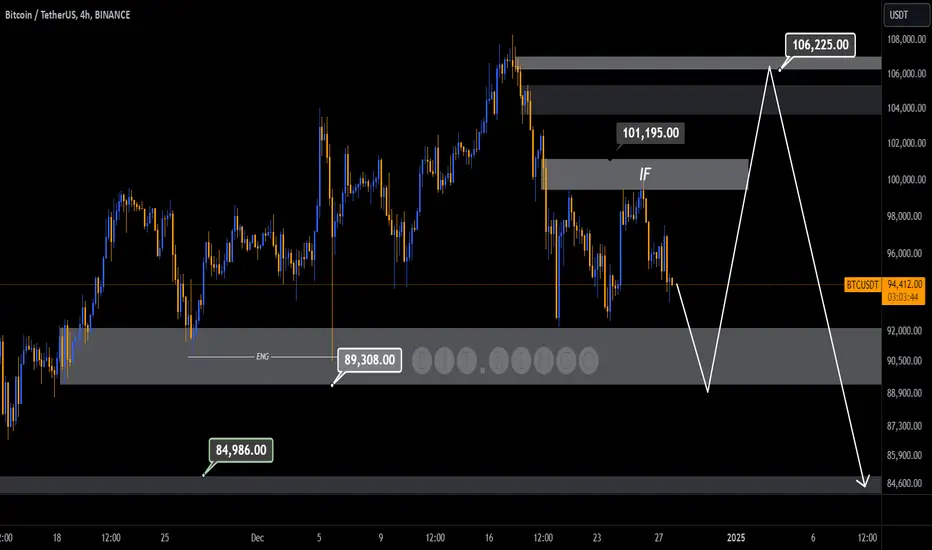
BiTcoinThe corrective scenario is valid only if the $89,308 support zone is fully mitigated. After a single liquidity sweep into this level, we anticipate a bullish retracement targeting the $106,225 price range, where sell-side liquidity is expected to be tapped. Following this, a bearish continuation toward the $84,000 zone is likely.
If the $89,308 support zone remains unmitigated and the $101,195 resistance zone is fully cleared, the probability of revisiting lower levels becomes invalid for now.
That said, considering the current market structure and order flow, the bearish scenario appears more probable, but confirmation is still required.
What’s your perspective on this?
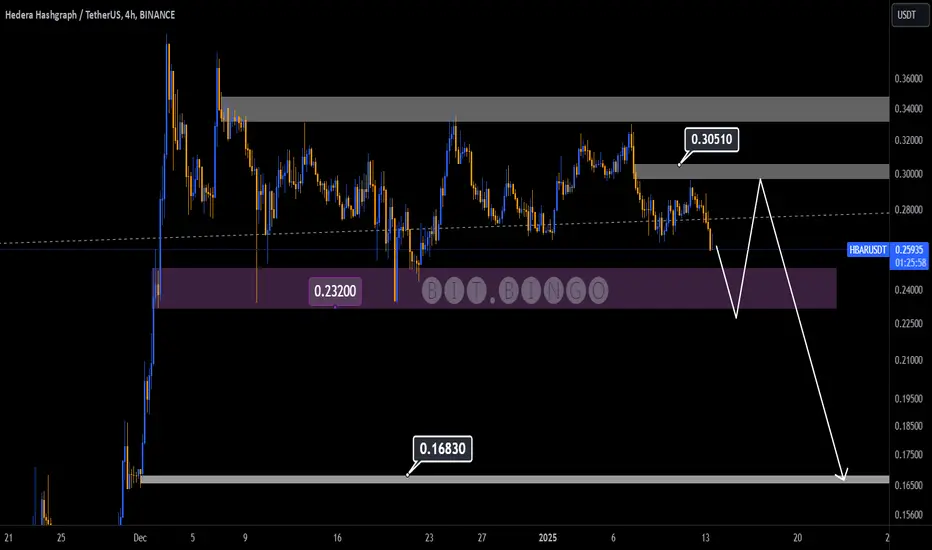
HBARUSDT
The purple support zone within the price range of $0.232 has been tested multiple times so far. If this support area is breached, we expect the bearish trend to continue towards lower levels.
Upon closer examination, we observe that the resistance zone at $0.3484 has not yet been tested, and the momentum of the bearish trend has been stronger. Once the purple support zone is consumed, the bearish scenario will be further confirmed.
What’s your opinion?
15.01.25 Morning ForecastPairs on Watch -
FX:NZDCAD (Live)
FX:EURUSD
FX:GBPAUD
FX:NZDJPY
A short overview of the instruments I am looking at for today, multi-timeframe analysis down to what I will be looking at for an entry. Enjoy!

[INTRADAY] #BANKNIFTY PE & CE Levels(15/01/2025)Today will be flat or slightly gap up opening expected in banknifty. After opening banknifty face upside resistance at 48950 level. If banknifty starts trading above 49050 level then possible strong upside rally in index. Below 48450 level further bearish movement expected in banknifty. Downside movement expected upto 48050 and 47550 level in case banknifty not sustain above the 48550 and starts trading below 48450.

EthereumThe resistance level at $4165 has not been fully consumed yet. As long as the support area at $2982.5 holds, we can expect a bullish trend similar to the previous scenario.
Currently, the probability of a bearish scenario and the consumption of the $2982.5 support level is much higher. If this support zone is consumed, we can expect to see the $2700 price range as well.
At the moment, the $3060 and $2700 price zones are considered low-risk areas for buying Ethereum. What’s your take on this?
